. 2024 Sep 30:15:1444558.
doi: 10.3389/fimmu.2024.1444558. eCollection 2024.

Unveiling signaling pathways inducing MHC class II expression in neutrophils

Affiliations

Unveiling signaling pathways inducing MHC class II expression in neutrophils

Pascal Forrer et al. Front Immunol. .

Abstract

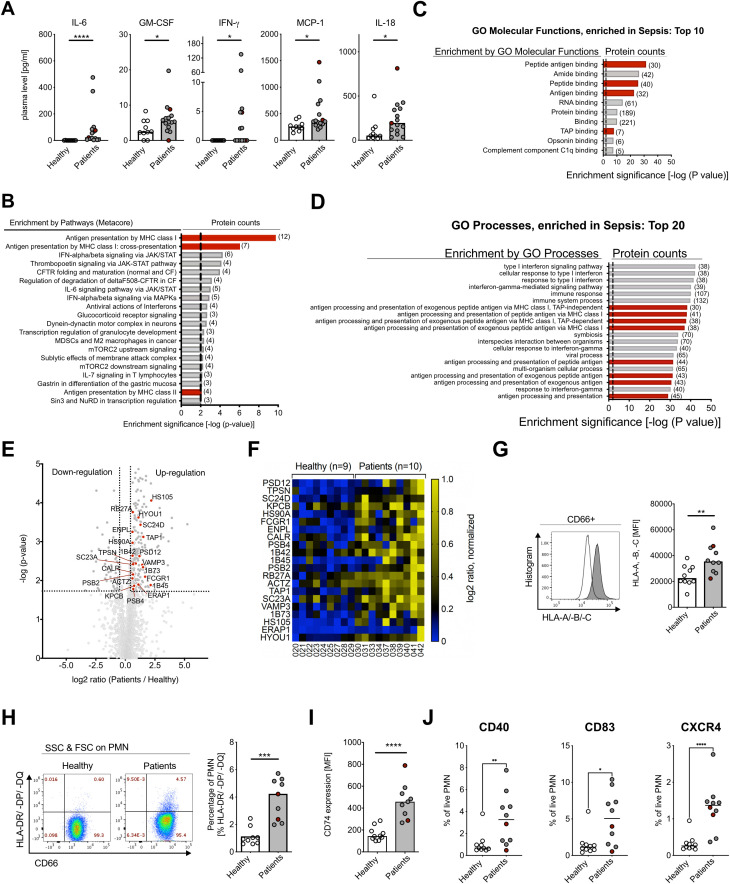
Introduction: Gram-negative bacillary bacteremia poses a significant threat, ranking among the most severe infectious diseases capable of triggering life-threatening sepsis. Despite the unambiguous involvement of neutrophils in this potentially fatal disease, there are limited data about the molecular signaling mechanisms, phenotype, and function of human neutrophils during the early phase of gram-negative bacillary bacteremia.

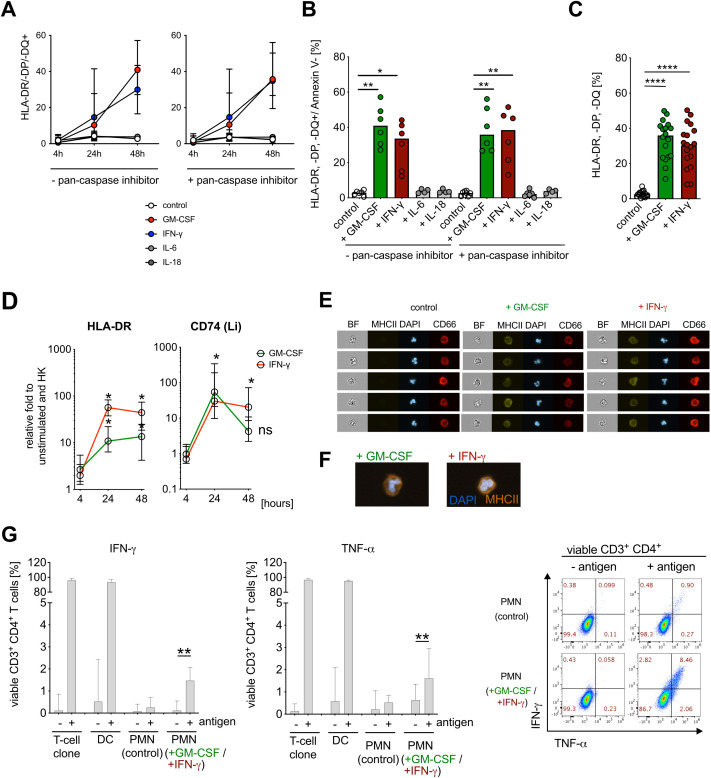
Methods: By using an unbiased proteomics and flow cytometry approach, we identified an antigen-presenting cell (APC)-like phenotype in human peripheral blood neutrophils (PMN) with MHC class II molecule expression in the early phase of bacteremia. Using an in-vitro model of GM-CSF-mediated induction of APC-like phenotype in PMN, we investigated downstream signaling pathways leading to MHC class II expression.

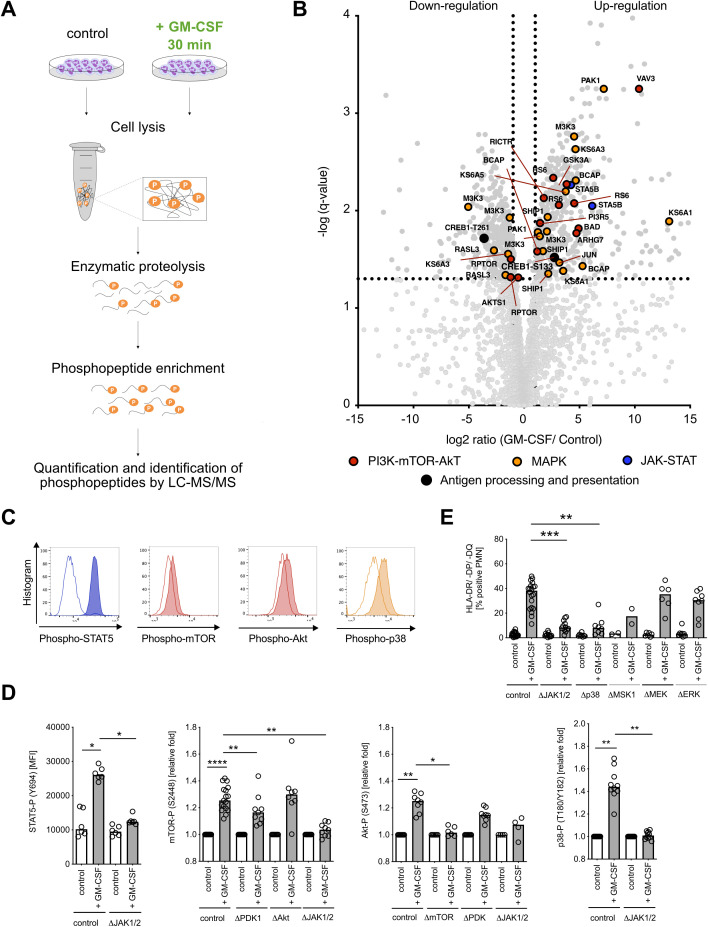
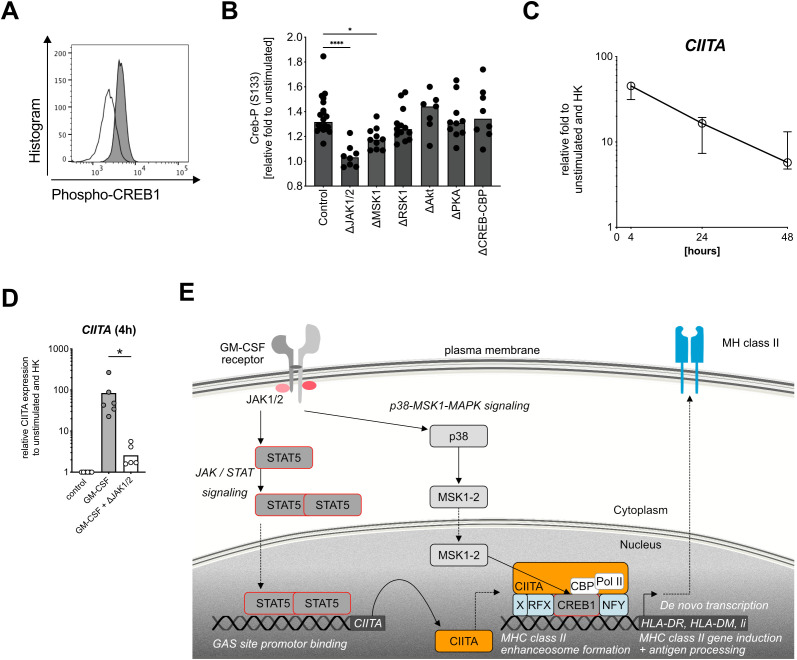
Results: GM-CSF stimulation of neutrophils leads to the activation of three major signaling pathways, the JAK-STAT, the mitogen-activated protein kinase (MAPK), and the phosphoinositide 3-kinase (PI3K)-Akt-mTOR pathways, while MHC class II induction is mediated by a MAPK-p38-MSK1-CREB1 signaling cascade and the MHC class II transactivator CIITA in a strictly JAK1/2 kinase-dependent manner.

Discussion: This study provides new insights into the signaling pathways that induce MHC class II expression in neutrophils, highlighting the potential for therapeutic targeting of JAK1/2 signaling in the treatment of gram-negative bacteremia and sepsis. Understanding these mechanisms may open up novel approaches for managing inflammatory responses during sepsis.

Keywords: APC-like neutrophils; GM-CSF; JAK-STAT signaling; MHC class II; antigen-presenting cells; gram-negative bacteremia; innate immunity; sepsis.


Conflict of interest statement

The authors declare that the research was conducted in the absence of any commercial or financial relationships that could be construed as a potential conflict of interest.

Figures

Figure 1
Figure 1
Human neutrophils in gram-negative bacteremia show APC-like phenotype. (A) Plasma cytokine concentrations for IL-6, GM-CSF, IFN-γ, MCP-1, and IL-18 of healthy controls and patients. Medians, Mann–Whitney test. (B) Enriched pathways from proteomics analysis on neutrophils from healthy controls (n=9) and patients (n=10), using Metacore Enrichment by Pathway Maps. The P-value of proteomics data was set < 0.05, threshold = 0, top 20 hits with an enrichment significance of P-value < 0.01. Red bars highlight Antigen Presentation and processing by MHC class I and MHC class II as highly changed pathways in GN bacteremia patients. (C) Gene Ontology (GO) Molecular Functions Enrichment from proteomics analysis, using Metacore Enrichment by GO Molecular Functions. P-value of proteomics data was set < 0.05, threshold = 0, top 10 hits with an enrichment significance of P-value < 0.01. Red bars highlight Molecular Functions involved in Antigen processing and presentation in GN bacteremia. (D) GO Process Enrichment from proteomics analysis, using Metacore Enrichment by GO Processes. The P-value of proteomics data was set < 0.05, threshold = 0, top 20 hits with an enrichment significance of P-value < 0.01. Red bars highlight processes involved in Antigen processing and presentation in GN bacteremia. (E) Volcano dot plot from proteomics analysis. Highlighted proteins (red dots) are associated with Antigen presentation and processing by MHC class I and II, significance threshold (dotted line) was set at P-value < 0.02 and fold change ≤ 1.5 cutoff in order of P-value. (F) Heat map of proteins involved in Antigen presentation and processing by MHC class I and II, shown on an individual level with log2 ratio, normalized (0–1, blue to yellow). Significance threshold was set at P-value < 0.02 and fold change ≤ 1.5 cutoff in order of P-value. Protein names are used according to entry names in UniProt database (www.uniprot.org). (G) HLA-A, -B, -C (MHC class I) surface expression on neutrophils of healthy controls and patients, measured with flow cytometry, representative histogram (left) and statistical analysis (right, medians, Mann–Whitney test). (H) CD66b and HLA-DR/-DP/-DQ (MHC class II) surface expression on human neutrophils of healthy controls and patients, measured with flow cytometry; representative scatter dot plot (left) and statistical analysis (right, medians, Mann–Whitney test). (I) CD74 (Li) surface expression on human neutrophils of healthy controls and patients, measured with flow cytometry. Medians, Mann–Whitney test. (J) Co-stimulatory factors of healthy controls and patients, measured with flow cytometry. Medians, Mann–Whitney test. For (A, G, F), sepsis patient samples are marked in red. MFI, mean fluorescence intensity. * P ≤ 0.05; ** P ≤ 0.01, *** P ≤ 0.001, **** P ≤ 0.0001.
Figure 2
Figure 2
IFN-γ and GM-CSF induce APC-like neutrophil phenotype in vitro. (A) HLA-DR/-DP/-DQ (MHC class II) surface expression on human neutrophils (CD66b+ cells, gated on Annexin V) after stimulation with human recombinant GM-CSF (10 ng/ml), IFN-γ (10 ng/ml), IL-6 (10 ng/ml) and IL-18 (10 ng/ml) for 48 h, preincubated −/+ pan-caspase inhibitor q.OPh (3 µM) for 4 h, 24 h, and 48 h, measured consequently with flow cytometry, medians with range (n=6). (B) Summary of HLA-DR/-DP/-DQ+/Annexin V neutrophils after pre-incubation with −/+ q.OPH and stimulation with GM-CSF, IFN-γ, IL-6, and IL-18 for 48h. Medians, Kruskal–Wallis test (compared with controls). (C) Percentage of HLA-DR/-DP/-DQ+/Annexin V neutrophils after pre-incubation with q.OPh and stimulation with GM-CSF and IFN-γ for 48h. Medians (n=18), Mann–Whitney test. (D) HLA-DR and Li (CD74) mRNA expression after stimulation with GM-CSF and IFN-γ for 4 h, 24 h, and 48h. Values are shown as relative fold change to unstimulated control and internal control (housekeeping genes, HK) (medians, n=6, Mann–Whitney test; ns, not significant). (E) de novo MHC class II (HLA-DR/-DP/-DQ) surface molecule expression on neutrophils after stimulation with GM-CSF and IFN-γ for 48 h, measured with ImageStreamX, representative example. DAPI was used for nuclear staining and CD66b as a surface expression marker. BF, bright field. (F) Representative overlay of de novo MHC class II (HLA-DR/-DP/-DQ, orange) surface molecule expression on neutrophils after stimulation with GM-CSF and IFN-γ for 48 h, measured by ImageStreamX at 60× magnification. DAPI (blue) was used for nuclear staining and CD66b as a surface expression marker. (G) Intracellular cytokine staining for IFN-γ- and TNF-α-positive viable CD3+ CD4+ T cells, co-incubated with PMN or antigen-pulsed PMN [PMN (control), ratio 1:10], and cytokine-stimulated PMN [GM-CSF (10 ng/ml) + IFN-γ (10 ng/ml)] or antigen-pulsed cytokine-stimulated PMN (ratio 1:10) for 6h. Percentage for IFN-γ and TNF-α expression (left), and representative scatter dot plot (right). As a positive control, autologous dendritic cells (DCs, 1:1 ratio) and T-cell clones alone were used. All values are shown as medians with interquartile ranges (n=11; n=6 for positive control with DCs; Wilcoxon signed rank test; * P ≤ 0.05; ** P ≤ 0.01, **** P ≤ 0.0001; ns, not significant.
Figure 3
Figure 3
GM-CSF signaling leads to the activation of JAK-STAT, MAPK p38, and mTOR-Akt signaling pathways and phosphorylation of transcription factor CREB. (A) Visualization of the phosphoproteomics experimental procedure. Neutrophils (108 cells each condition) were stimulated with GM-CSF (10 ng/ml) for 30 min and then collected for further processing. (B) Volcano dot plot of detected phosphopeptide changes (n=3,579) after stimulation with GM-CSF for 30 min. The significance threshold was set at q-value < 0.05 and fold change ≤ 2 cutoff in order of P-value. (C) Representative histograms for STAT5- (Y694), mTOR- (S2448), Akt- (S473), and p38- (T180/Y182) phosphorylation after GM-CSF stimulation for 30 min by using Phosflow antibodies for flow cytometry. Unstimulated control is shown in white, GM-CSF stimulation is shown shaded. (D) STAT5- (Y694), mTOR- (S2448), Akt- (S473), and p38- (T180/Y182) phosphorylation after GM-CSF stimulation, measured by phospho flow cytometry. Inhibitors ruxolitinib (ΔJAK1/2 inhibitor, final conc. = 3 µM), BX-795 (ΔPDK1 inhibitor, final conc. = 10 µM), MK-2206 (ΔAkt1/2/3 inhibitor, final conc. = 10 µM), and PP242 (ΔmTORC1/2 inhibitor, final concentrations = 5 µM) were used. Medians, Kruskal–Wallis test. (E) HLA-DR/-DP/-DQ+ (MHC class II+)/Annexin V neutrophils after pre-incubation with/without inhibitors ruxolitinib (ΔJAK1/2 inhibitor, final concentrations = 3 µM), SB203580 (Δp38 inhibitor, final conc. = 10 µM), SB 747651 A (ΔMSK1 inhibitor, final conc. = 10 µM), trametinib (ΔMEK1/2 inhibitor, final conc. = 10 µM), and SCH772984 (ΔERK1/2 inhibitor, final conc. = 5 µM), and stimulation with human recombinant GM-CSF (10 ng/ml) for 48h. Medians, Kruskal–Wallis test. MFI, mean fluorescence intensity. * P ≤ 0.05; ** P ≤ 0.01, **** P ≤ 0.0001.
Figure 4
Figure 4
Targeting the MHC class II enhanceosome in human neutrophils. (A) Representative histogram for CREB1 phosphorylation (S133) in healthy donor neutrophils after GM-CSF stimulation (gray) compared with unstimulated (white) for 30 min by using Phosflow antibody for flow cytometry. (B) CREB1 phosphorylation at S133 (Creb-P) after GM-CSF stimulation, measured by phospho flow cytometry, relative fold changes to unstimulated control. Medians, Kruskal–Wallis test. Inhibitors ruxolitinib (ΔJAK1/2 inhibitor, final conc. = 3 µM), SB 747651 A (ΔMSK1 inhibitor, final conc. = 10 µM), BI-D1870 (ΔRSK1-4 inhibitor, final conc. = 10 µM), and MK-2206 (ΔAkt1/2/3 inhibitor, final conc. = 10 µM), CAS 92-78-4 (ΔCREB-CBP interaction inhibitor, final conc. = 50 µM) were used. (C) CIITA mRNA expression after stimulation with human recombinant GM-CSF (10 ng/ml) for 4 h, 24 h, and 48h. Values are shown as relative fold change to unstimulated control and internal control (housekeeping genes, HK). Medians with interquartile range, n=6. (D) CIITA mRNA expression after stimulation with human recombinant GM-CSF for 4 h, pretreated with or without ruxolitinib for 1h. Relative control to unstimulated and housekeeping genes (HK). Medians, comparison of GM-CSF-stimulated via Wilcoxon signed rank test. (E) Human neutrophil signaling cascade leading to de novo MHC class II induction after stimulation with GM-CSF. JAK1/2, Janus kinase 1 and 2; STAT5, signal transducer and activator of transcription 5; Y694, tyrosine phosphorylation site at residue 694; CIITA, MHC class II transactivator; p38, p38 mitogen-activated protein kinase; MSK1, mitogen- and stress-activated protein kinase-1; RFX, regulatory factor X; CREB1, cAMP-responsive element binding protein 1; Pol II; polymerase II; CBP, CREB-binding protein; HLA-DR, HLA-DM, Li, MHC class II genes. * P ≤ 0.05; **** P ≤ 0.0001.

References

    1. Holmes CL, Anderson MT, Mobley HLT, Bachman MA. Pathogenesis of gram-negative bacteremia. Clin Microbiol Rev. (2021) 34. doi: 10.1128/CMR.00234-20 - DOI - PMC - PubMed
    1. Polat G, Ugan RA, Cadirci E, Halici Z. Sepsis and septic shock: current treatment strategies and new approaches. Eurasian J Med. (2017) 49:53–8. doi: 10.5152/eurasianjmed.2017.17062 - DOI - PMC - PubMed
    1. Kang CI, Kim SH, Park WB, Lee KD, Kim HB, Kim EC, et al. . Bloodstream infections caused by antibiotic-resistant gram-negative bacilli: risk factors for mortality and impact of inappropriate initial antimicrobial therapy on outcome. Antimicrob Agents Chemother. (2005) 49:760–6. doi: 10.1128/AAC.49.2.760-766.2005 - DOI - PMC - PubMed
    1. Kumar A, Roberts D, Wood KE, Light B, Parrillo JE, Sharma S, et al. . Duration of hypotension before initiation of effective antimicrobial therapy is the critical determinant of survival in human septic shock. Crit Care Med. (2006) 34:1589–96. doi: 10.1097/01.CCM.0000217961.75225.E9 - DOI - PubMed
    1. Gikas A, Samonis G, Christidou A, Papadakis J, Kofteridis D, Tselentis Y, et al. . Gram-negative bacteremia in non-neutropenic patients: a 3-year review. Infection. (1998) 26:155–9. doi: 10.1007/BF02771841 - DOI - PubMed

MeSH terms

Substances

LinkOut - more resources