Meta-Analysis
. 2024 Sep 30:15:1343805.
doi: 10.3389/fimmu.2024.1343805. eCollection 2024.

Unlocking the secrets of NPSLE: the role of dendritic cell-secreted CCL2 in blood-brain barrier disruption

Affiliations
Meta-Analysis

Unlocking the secrets of NPSLE: the role of dendritic cell-secreted CCL2 in blood-brain barrier disruption

Lei Wang et al. Front Immunol. .

Abstract

Background: This study employed RNA-seq technology and meta-analysis to unveil the molecular mechanisms of neuropsychiatric systemic lupus erythematosus (NPSLE) within the central nervous system.

Methods: Downloaded transcriptomic data on systemic lupus erythematosus (SLE) from the Gene Expression Omnibus (GEO) and analyzed differential genes in peripheral blood samples of NPSLE patients and healthy individuals. Employed WGCNA to identify key genes related to cognitive impairment and validated findings via RNA-seq. Conducted GO, KEGG, and GSEA analyses, and integrated PPI networks to explore gene regulatory mechanisms. Assessed gene impacts on dendritic cells and blood-brain barrier using RT-qPCR, ELISA, and in vitro models.

Results: Public databases and RNA-seq data have revealed a significant upregulation of CCL2 (C-C motif chemokine ligand 2) in the peripheral blood of both SLE and NPSLE patients, primarily secreted by mature dendritic cells. Furthermore, the secretion of CCL2 by mature dendritic cells may act through the RSAD2-ISG15 axis and is associated with the activation of the NLRs (Nod Like Receptor Signaling Pathway) signaling pathway in vascular endothelial cells. Subsequent in vitro cell experiments confirmed the high expression of CCL2 in peripheral blood dendritic cells of NPSLE patients, with its secretion being regulated by the RSAD2-ISG15 axis and inducing vascular endothelial cell pyroptosis through the activation of the NLRs signaling pathway. Clinical trial results ultimately confirmed that NPSLE patients exhibiting elevated CCL2 expression also experienced cognitive decline.

Conclusions: The secretion of CCL2 by dendritic cells induces pyroptosis in vascular endothelial cells, thereby promoting blood-brain barrier damage and triggering cognitive impairment in patients with systemic lupus erythematosus.

Keywords: CCL2; NLR signaling pathway; RNA-seq; dendritic cells; neuropsychiatric systemic lupus erythematosus.


Conflict of interest statement

The authors declare that the research was conducted in the absence of any commercial or financial relationships that could be construed as a potential conflict of interest.

Figures

Figure 1
Figure 1
Differential Analysis and WGCNA Analysis for Identification of Core Differentially Expressed Genes in SLE-related GEO Dataset and Sequencing Data. (A) Volcano plot for differential analysis of GSE112087 dataset (normal=58, SLE=62); (B) Scale-free fit index analysis for various soft threshold powers; (C) Gene co-expression network constructed by WGCNA, where each colour represents a module in the gene co-expression network constructed by WGCNA; (D) Correlation analysis between different modules and disease phenotypes, with each cell containing the correlation coefficient and corresponding p-value; (E) Venn diagram of differentially expressed genes in the GSE112087 dataset, module genes most correlated with disease, and gene list related to cognitive impairment from GeneCard database; (F) Expression trends of three core differentially expressed genes in the GSE112087 dataset; (G) Volcano plot for differential analysis of sequencing data (normal=3, NPSLE=3); (H) Venn diagram of differential genes between GSE112087 dataset and sequencing data; (I) Expression trends of three core differentially expressed genes in sequencing data. * indicates comparison between two groups, p<0.05, **p<0.01, ***p<0.0001.
Figure 2
Figure 2
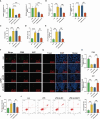
Investigation of the Effect of CCL2 on the Blood-Brain Barrier and Endothelial Cells in vitro. (A, B) TEER experiments and ELISA for assessing the effects of CCL2 on the in vitro blood-brain barrier iPS-EC; (C) Immunofluorescence staining experiments to evaluate the impact of CCL2 on the expression of Ki67 and CD69 in iPS-EC composing the blood-brain barrier (Scale bar = 50 μm); (D, E) Tunel staining and flow cytometry to explore the influence of CCL2 on the apoptosis of iPS-EC composing the blood-brain barrier (Scale bar = 100 μm). Cell experiments repeated 3 times, * indicates comparison between two groups, p<0.05, *p<0.01.
Figure 3
Figure 3
Analysis and Experimental Validation of Peripheral Blood Immune Cell Infiltration in Healthy Individuals and SLE Patients. (A) Stacked bar chart showing the proportions of 22 immune cell types in peripheral blood of healthy individuals (n=58) and SLE patients (n=62); (B) Heatmap illustrating the proportions of 22 immune cell types in peripheral blood of healthy individuals (n=58) and SLE patients (n=62); (C) Violin plots comparing the proportions of 22 immune cell types in peripheral blood of healthy individuals (n=58) and SLE patients (n=62), with blue representing healthy individuals and red representing SLE patients; (D) Correlation analysis between the expression of CCL2 in peripheral blood of SLE patients (n=62) and the increased proportions of activated memory CD4 T cells, activated dendritic cells, and neutrophils; (E) Flow cytometry analysis of the activation level of dendritic cells in peripheral blood of healthy individuals (n=12) and NPSLE patients (n=7); (F, G) RT-qPCR experiment to detect the expression levels of CCL2 mRNA in activated dendritic cells and monocytes extracted from peripheral blood of healthy individuals (n=12) and NPSLE patients (n=7). * indicates comparison between two groups, *p<0.05.
Figure 4
Figure 4
Enrichment analysis of GO, KEGG, and GSEA and PPI network of differentially expressed genes in the GSE112087 dataset and in vitro experimental validation. (A) GO and KEGG enrichment analysis of differentially expressed genes in the GSE112087 dataset (normal=58, SLE=62); (B) GSEA enrichment analysis of the GSE112087 dataset (normal=58, SLE=62); (C) Top 4 signalling pathways upregulated in peripheral blood of SLE patients based on GSEA enrichment analysis (normal=58, SLE=62); (D) PPI network of proteins encoded by differentially expressed genes in the GSE112087 dataset (normal=58, SLE=62); (E) The measurement of mRNA expression levels of ISG15, CXCL10, LIF, CXCR6, TNFAIP6, and CXCR5 in peripheral blood dendritic cells of healthy volunteers (n=7) and NPSLE patients (n=12) was conducted using RT-qPCR experiments; (F) The assessment of protein expression levels of ISG15, CXCL10, LIF, CXCR6, TNFAIP6, and CXCR5 in peripheral blood dendritic cells of healthy volunteers (n=7) and NPSLE patients (n=12) was performed through Western blotting experiments. Statistical significance between the two groups is represented by *p<0.05.
Figure 5
Figure 5
In vitro experimental validation of the regulatory relationship between ISG15 and CCL2 in mature dendritic cells. (A) Silencing efficiency of CCL2 and ISG15 shRNA sequences determined by RT-qPCR experiment; (B) Effects of silencing CCL2 or ISG15 on their respective mRNA expression levels determined by RT-qPCR experiment; (C) CCL2 content in co-culture medium of hCMEC/D3 cells determined by ELISA experiment; (D) TEER experiment detected the effects of co-culturing different DCs and hCMEC/D3 on the in vitro blood-brain barrier; (E) Enzyme-linked immunosorbent assay detected the effects of co-culturing different DCs and hCMEC/D3 on the in vitro blood-brain barrier; (F) Immunofluorescence staining experiment detected the expression levels of Ki67 and CD69 in hCMEC/D3 cells co-cultured under a scale bar of 50 μm; (G) Tunel staining detected the apoptosis levels of hCMEC/D3 cells co-cultured with a scale bar of 100 μm; (H) Statistical graph of Ki67 and CD69 fluorescence intensity in hCMEC/D3 cells in the immunofluorescence staining experiment; (I) Statistical graph of fluorescence intensity in positive regions of hCMEC/D3 cells in the Tunel staining experiment; (J) Flow cytometry detected the apoptosis rate of hCMEC/D3 cells. Cell experiments were repeated three times, and statistical significance is represented by # for p<0.05; *** 0.001.
Figure 6
Figure 6
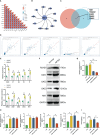
In vitro experimental validation of the effects of silencing RSAD2 on the expression of ISG15 and CCL2 in mature dendritic cells. (A) Co-expression correlation heatmap of ISG15-related genes in the PPI network; (B) Top 10 genes ranked by co-expression correlation with ISG15 predicted by Coexpedia website; (C) Venn diagram showing the intersection of genes related to ISG15 in the PPI network and genes predicted by Coexpedia website; (D) Expression correlation of ISG15 with the intersecting genes in normal blood (n=444) predicted by ChipBase3.0 website; (E) Expression levels of RSAD2, OAS1, OAS2, OAS3 and MX1 mRNA in peripheral blood dendritic cells of healthy volunteers (n=7) and NPSLE patients (n=12) determined by RT-qPCR experiment; (F) Expression levels of RSAD2, OAS1, OAS2, OAS3 and MX1 protein in peripheral blood dendritic cells of healthy volunteers (n=7) and NPSLE patients (n=12) determined by Western blot experiment; (G) Silencing efficiency of RSAD2 shRNA sequences determined by RT-qPCR experiment; (H) Effects of silencing CCL2 or ISG15 and silencing RSAD2 on the expression of RSAD2, ISG15, and CCL2 determined by RT-qPCR experiment; (I) Effects of silencing RSAD2 on the secretion of CCL2 in mature dendritic cells determined by ELISA experiment. Cell experiments were repeated three times, and statistical significance is represented by # for p<0.05; *0.05; **0.01.
Figure 7
Figure 7
Mechanistic exploration and in vitro experimental validation of CCL2-mediated blood-brain barrier disruption. (A) Heatmap of gene expression in the “Nod Like Receptor Signaling Pathway” in healthy individuals (n=58) and SLE patients (n=62) in the GSE112087 dataset; (B) Co-expression relationship validation of CCL2 and NLRP3 in normal vascular tissue (n=444) using ChipBase v3.0 website; (C) Expression levels of NLRP3, ASC, and GSDMD proteins in iPS-EC cells stimulated with CCL2 and co-cultured with mature dendritic cells determined by Western blot experiment; (D) Effects of silencing CCL2 on the expression of NLRP3, ASC, and GSDMD proteins in hCMEC/D3 cells co-cultured with mature dendritic cells determined by Western blot experiment. Cell experiments were repeated three times, and statistical significance is represented by * for p<0.05 and # for p<0.05.
Figure 8
Figure 8
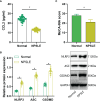
Validation of Cognitive Function and CCL2 Expression in Peripheral Blood of NPSLE Patients. (A) ELISA assessment of CCL2 expression in NPSLE patients; (B) Western blot examination of NLRs signaling pathway activation downstream of CCL2; (C) Evaluation of cognitive abilities in NPSLE patients using MoCA-INA. * indicates comparisons between the two groups, with statistical significance at p<0.05.
Figure 9
Figure 9
Molecular mechanism diagram of CCL2-induced blood-brain barrier damage leading to cognitive impairment in systemic lupus erythematosus patients.

Similar articles

Cited by

References

    1. Anliker-Ort M, Dingemanse J, van den Anker J, Kaufmann P. Treatment of rare inflammatory kidney diseases: drugs targeting the terminal complement pathway. Front Immunol. (2020) 11:599417. doi: 10.3389/fimmu.2020.599417 - DOI - PMC - PubMed
    1. Boismal F, Serror K, Dobos G, Zuelgaray E, Bensussan A, Michel L. Vieillissement cutané - Physiopathologie et thérapies innovantes [Skin aging: Pathophysiology and innovative therapies]. Med Sci (Paris). (2020) 36:1163–72. doi: 10.1051/medsci/2020232 - DOI - PubMed
    1. Harris-Tryon TA, Grice EA. Microbiota and maintenance of skin barrier function. Science. (2022) 376:940–5. doi: 10.1126/science.abo0693 - DOI - PubMed
    1. Jin S, Guerrero-Juarez CF, Zhang L, Chang I, Ramos R, Kuan CH, et al. . Inference and analysis of cell-cell communication using CellChat. Nat Commun. (2021) 12:1088. doi: 10.1038/s41467-021-21246-9 - DOI - PMC - PubMed
    1. Carrión-Barberà I, Salman-Monte TC, Vílchez-Oya F, Monfort J. Neuropsychiatric involvement in systemic lupus erythematosus: A review. Autoimmun Rev. (2021) 20:102780. doi: 10.1016/j.autrev.2021.102780 - DOI - PubMed

Publication types

MeSH terms

LinkOut - more resources