. 2024 Sep 24;10(19):e38370.
doi: 10.1016/j.heliyon.2024.e38370. eCollection 2024 Oct 15.

NF-κB pathway activation by Octopus peptide hydrolysate ameliorates gut dysbiosis and enhances immune response in cyclophosphamide-induced mice

Affiliations

NF-κB pathway activation by Octopus peptide hydrolysate ameliorates gut dysbiosis and enhances immune response in cyclophosphamide-induced mice

Muhsin Ali et al. Heliyon. .

Abstract

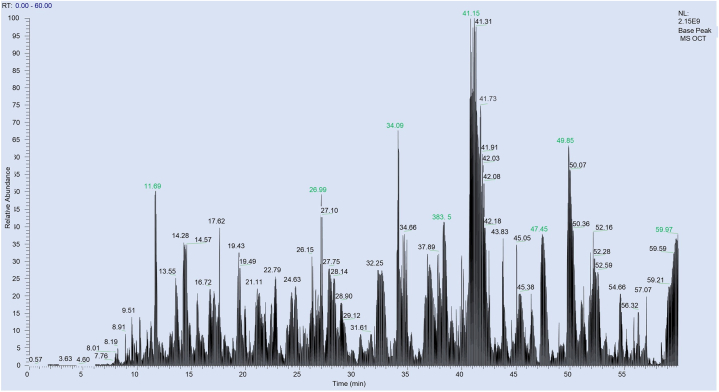
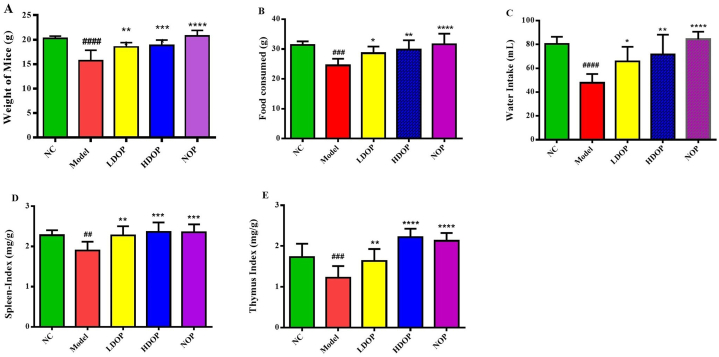
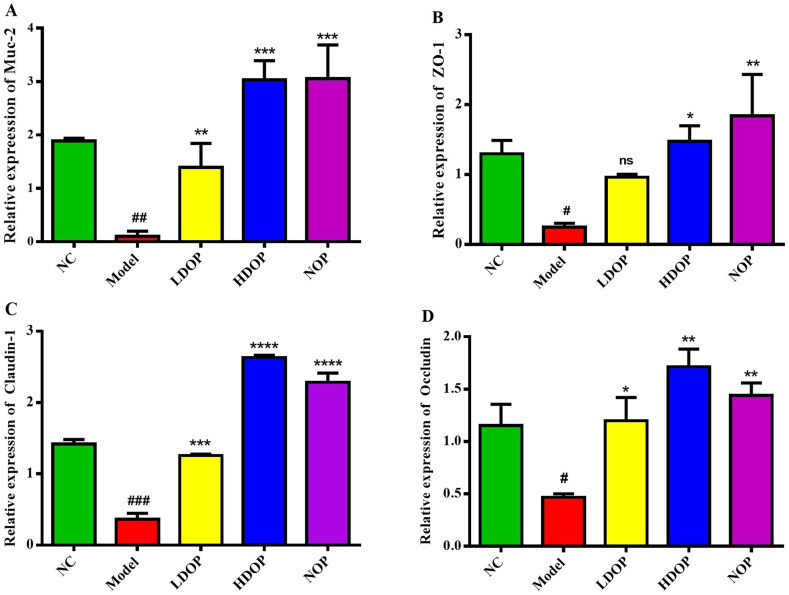
Cyclophosphamide (CTX) is an anticancer medication that suppresses host immunity as well as adversely affects mucosal inflammation and gut microflora dysbiosis. The gut microflora is recognized as a substantial factor in host metabolism and immunological homeostasis. To improve immunity and inhibit cytotoxic and homeostatic imbalances triggered by CTX, it is essential to monitor immunoregulators. In this research, we assessed the impact of Octopus peptide hydrolysate (OPH) on immune modulation, intestinal integrity, and gut microbial composition in CTX-induced immune-deficient mice. The results revealed that OPH increased body weight, and immunological organ indices, and improved the histological changes in the colon, thymus, and spleen. The OPH stimulated the secretion of cytokines (IL-1β, IL-6, and TNF-α) and antibodies (IgM and IgA) while reducing the ratio of lipopolysaccharide (LPS) and diamine oxidase (DAO) in the serum. OPH further enhanced goblet cell and mucus production, upregulated the expression of gut tight-junction proteins (Occludin, Zonula Occludin-1, Mucin-2, and Claudin-1), and activated the TLR4/NF-κB cascade (p-IκBα, P65/p-p65). In addition, OPH treatment declined the Bacteroidetes/Firmicutes ratio, enhanced the relative ratio of Alistipes/Lachnospiraceae, and reversed the ecological equilibrium of the gut microflora. The findings revealed that OPH serves as a prebiotic to prevent CTX-mediated disruption in the intestinal barrier and boosts gut mucosal immunity by attenuating gut microflora imbalance, implying that OPH could be used as an immunological ingredient in nutritious foods to regulate the immune system and protect the gut from inflammatory diseases.

Keywords: Cyclophosphamide; Gut microbiota; Immunomodulatory; NF-κB pathway; Octopus; peptides.


Conflict of interest statement

The authors declare that the research was conducted in the absence of any commercial or financial relationships that could be construed as a potential conflict of interest.

Figures

Fig. 1
Fig. 1
Total relative abundance of peptides in OPH. Scanning range: 300–3500 m/z.
Fig. 2
Fig. 2
The effects of OPH on the (A) Body weight (B) Food (C) Water (D) Spleen index (E) Thymus index in CTX-immunodeficient mice. Mean ± SD is used to represent the data (n = 10). ###p < 0.001 comparison to the Normal control group. ∗p < 0.05, ∗∗p < 0.01, ∗∗∗p < 0.001, and ∗∗∗∗p < 0.0001, comparison to the CTX-Model group.
Fig. 3
Fig. 3
The effect of OPH on serum cytokines level (A) TNF-α, (B) IL-1β, (C) IL-6, and immunoglobulin (D) IgA, (E) IgM in immunosuppressed mice (N = 10). Mean ± SD is used to represent the data (n = 10). ###p < 0.001 comparison to the Normal control group. ∗p < 0.05, ∗∗p < 0.01, ∗∗∗p < 0.001, and ∗∗∗∗p < 0.0001, comparison to the CTX-Model group.
Fig. 4
Fig. 4
The effect of OPH on the relative expression level of (A) Mucin-2, (B) ZO-1, (C) Claudin-1, and (D) Occludin in the colon of mice. β-actin was utilized for normalization. Mean ± SD is used to represent the data. ###p < 0.001 comparison to the Normal control group. ∗p < 0.05, ∗∗p < 0.01, ∗∗∗p < 0.001, and ∗∗∗∗p < 0.0001, comparison to the CTX-Model group.
Fig. 5
Fig. 5
Morphological impacts of OPH on spleen and thymus tissues as depicted by H& E staining. The spleen represented white Pulp (WP: arrow), red pulp (RP), lymphoid follicle (LF), and inflammatory cells (IC). In the thymus represented cortex (C), medulla (M). Magnification lens ( × 10), scale bar (200 μm). (For interpretation of the references to color in this figure legend, the reader is referred to the Web version of this article.)
Fig. 6
Fig. 6
Effect of OPH on colon histomorphometry in CTX-immunodeficient mice as shown by H&E staining. Crypts (black arrowhead), inflammatory cell (black arrow), epidermal surface (red arrow). Magnification lens (up: × 10, down: × 20), scale bar (200 μm). (For interpretation of the references to color in this figure legend, the reader is referred to the Web version of this article.)
Fig. 7
Fig. 7
Effect of OPH on goblet cell reinstates and mucin production in the colon of CTX-induced mice. (A) Periodic acid staining (PAS) as depicted the goblet cell production in a bluish color (black arrow). (B) Immunohistochemistry staining illustrates the express level of Mucin-2 as depicted via a goldish Color (black arrow), and inflammatory cell (red arrow). Magnification lens (up: × 10, down: × 20), scale bar (200 μm). (For interpretation of the references to color in this figure legend, the reader is referred to the Web version of this article.)
Fig. 8
Fig. 8
Effect of OPH on tight junction proteins (ZO-1, Claudin-1 and Occludin) expression level in the colon tissue of distinct mice. (A) Immunofluorescent analysis (Lens: × 20, scale bar: 200). (B) Western blot analysis. Mean ± SD is used to represent the data. ###p < 0.001 comparison to the Normal control group. ∗p < 0.05, ∗∗p < 0.01, ∗∗∗p < 0.001, and ∗∗∗∗p < 0.0001, comparison to the CTX-Model group. Original western plot images are provided in Fig. S2.
Fig. 9
Fig. 9
OPH outcomes at the level of (A) DAO and (B) LPS in the serum of mice. Mean ± SD is used to represent the data. ###p < 0.001 comparison to the Normal control group. ∗p < 0.05, ∗∗p < 0.01, ∗∗∗p < 0.001, and ∗∗∗∗p < 0.0001, comparison to the CTX-Model group.
Fig. 10
Fig. 10
Effects of OPH by regulating the NF-κB pathways via TLR4 receptor in the colon of CTX-induced mice. (A) The protein expression level of TLR4, p-IκBα, p-P65, and p65. Original western plot images are provided in Fig. S3. (B) The ratio of TLR4/β-actin. (C)The ratio of p-IκBα/β-actin. (D) The ratio of p-p65/p65. Beta-actin was utilized as an internal control. Mean ± SD is used to represent the data (n = 3). ###p < 0.001 comparison to the Normal control group. ∗p < 0.05, ∗∗p < 0.01, ∗∗∗p < 0.001, and ∗∗∗∗p < 0.0001, comparison to the CTX-Model group. (E) A prospective signaling mechanism in the immunomodulation of CTX-treated immunosuppressed mice.
Fig. 11
Fig. 11
The influence of OPH on intestinal microbial richness and diversity. (A) The rarefaction curves indicated that the sequencing depth of the gut microbiota in each sample. (B) The rank abundance curve depicts the variation and richness of species (OTU). (C) The Venn diagram illustrates the overlap of bacterial OTUs across various experimental groups. (D) Alpha coefficient indexes Shannon, Simpson, and Chao to measure richness and diversity.
Fig. 12
Fig. 12
The influence of OPH on gut microbiota. (A) The beta diversity index is described in a principal coordinate analysis (PCoA) plot with Bray–Curti's dissimilarity. The various colors indicate different groups, and every point represents an individual sample (n = 3) as verified by PERMANOVA analysis. (BC) Individual samples on the phylum and genus level. #p < 0.05 comparison to the Normal Control. ∗p < 0.05, comparison to the CTX-Model. (D) LEfSe bar analysis identifies the most prevalent taxonomic biomarker at various taxonomy levels. (E) The cladogram indicated the taxonomic richness of various study groups. (F) A heatmap examination displaying metabolic function and other significant activities within groups, with different colors representing their proportions. (For interpretation of the references to color in this figure legend, the reader is referred to the Web version of this article.)

References

    1. Vitkina T., et al. The impact of multi-walled carbon nanotubes with different amount of metallic impurities on immunometabolic parameters in healthy volunteers. Food Chem. Toxicol. 2016;87:138–147. - PubMed
    1. Ying M., et al. Ganoderma atrum polysaccharide ameliorates intestinal mucosal dysfunction associated with autophagy in immunosuppressed mice. Food Chem. Toxicol. 2020;138 - PubMed
    1. Kurashima Y., Goto Y., Kiyono H. Mucosal innate immune cells regulate both gut homeostasis and intestinal inflammation. Eur. J. Immunol. 2013;43(12):3108–3115. - PubMed
    1. Hansson G.C. Role of mucus layers in gut infection and inflammation. Curr. Opin. Microbiol. 2012;15(1):57–62. - PMC - PubMed
    1. Martens E.C., Neumann M., Desai M.S. Interactions of commensal and pathogenic microorganisms with the intestinal mucosal barrier. Nat. Rev. Microbiol. 2018;16(8):457–470. - PubMed

LinkOut - more resources