. 2024 Sep 25:20:100564.
doi: 10.1016/j.jvacx.2024.100564. eCollection 2024 Oct.

Three doses of Sars-CoV-2 mRNA vaccine in older adults result in similar antibody responses but reduced cellular cytokine responses relative to younger adults

Affiliations

Three doses of Sars-CoV-2 mRNA vaccine in older adults result in similar antibody responses but reduced cellular cytokine responses relative to younger adults

Geir Bredholt et al. Vaccine X. .

Abstract

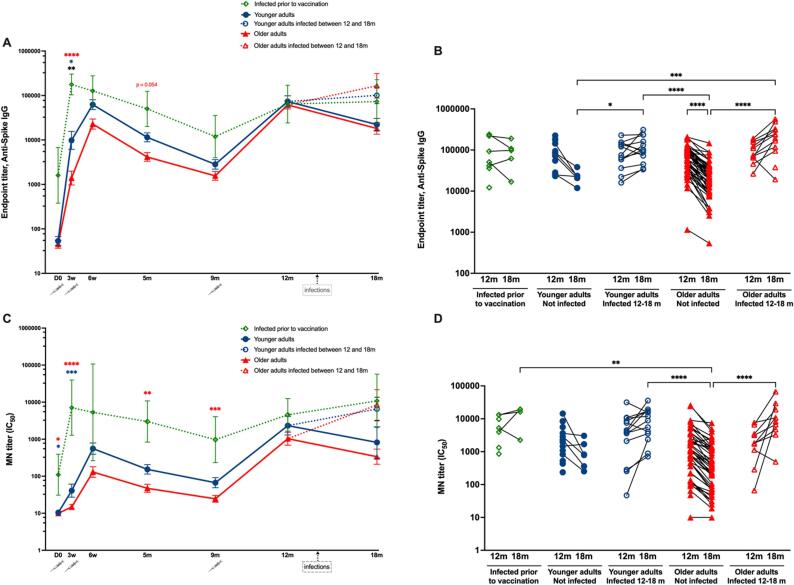
Objectives: Booster COVID-19 vaccinations are used to protect the elderly, a group vulnerable to severe disease. We compared humoral and cellular immunity in older versus younger adults up to eight months after administering a BNT16b2 booster vaccine dose. Next, we analyzed the plasma levels of soluble T cell activation/exhaustion markers.

Methods: Home-dwelling older adults (n = 68, median age 86) and younger healthcare workers (n = 35, median age 39), previously vaccinated with two doses of BNT162b2, were given a booster dose at ten months after the initial dose. Our analysis consisted of spike-specific IgG, neutralizing antibodies, memory B cells, IFN-γ and IL-2 secreting T cells and soluble T cell exhaustion/activation markers.

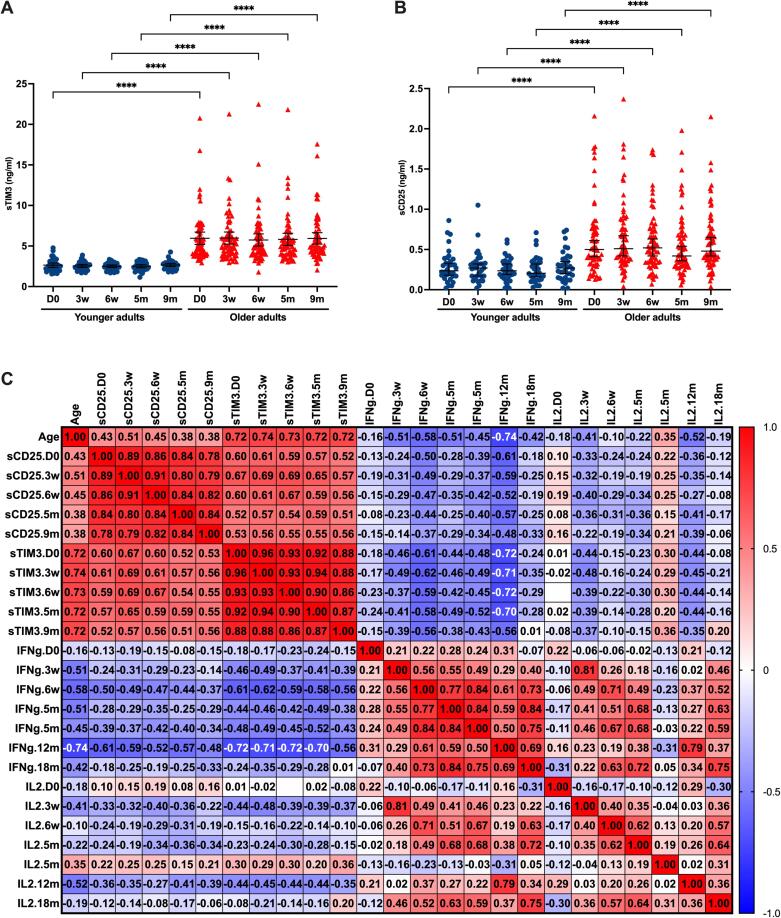
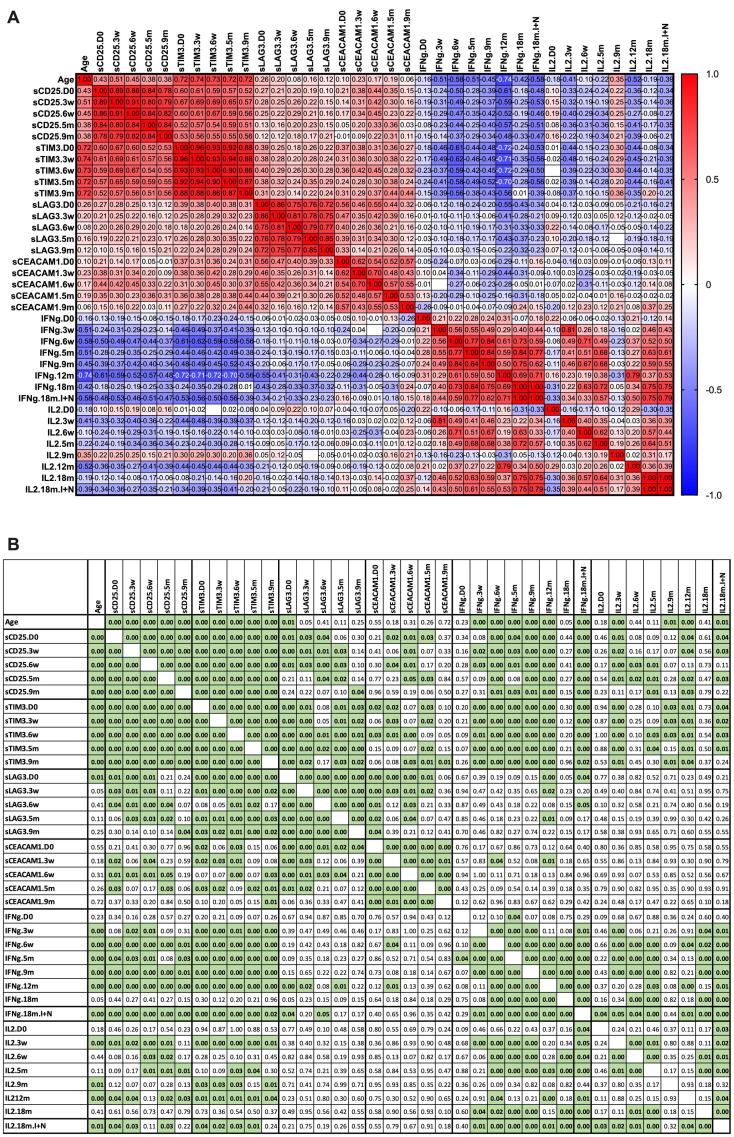
Results: Following the initial two doses, the elderly cohort exhibited lower humoral and IFN-γ responses compared to younger adults. The booster dose increased the humoral responses in both older and younger adults. At two months after the booster dose, older and younger vaccinees had comparable levels of antibodies and the responses were maintained up to 18 months. The younger cohort elicited an increase in the cellular response, while no increase was detected in the elderly. The elderly had higher plasma levels of soluble forms of the T cell activation/exhaustion markers CD25 and TIM-3, which inversely correlated with age and T-cell cytokine responses. This suggests that these markers may be related to the observed dysfunctional cellular cytokine response in older adults. However, both elderly and younger adults who experienced breakthrough infections after booster vaccination, elicited more robust humoral and IFN-γ responses.

Conclusions: The booster dose elicited neutralizing and spike-specific antibody responses in the elderly that were comparable with that of the younger cohort. However, the lack of a strong cellular cytokine response to the third dose in the elderly may explain their vulnerability to severe infection and may be a consequence of exhausted or senescent T cell responses. (https://clinicaltrials.gov/study/NCT04706390).

Keywords: Aging; Interferon-gamma; Memory B cells; Neutralizing antibodies; SARS-CoV-2; T-lymphocytes; mRNA vaccines.


Conflict of interest statement

The authors declare that they have no known competing financial interests or personal relationships that could have appeared to influence the work reported in this paper.

Figures

Fig. 1
Fig. 1
Study population flowchart. Number of vaccinees included at baseline and number of vaccinees analyzed with serological assays (ELISA, microneutralization (MN), cellular assays (peripheral blood mononuclear cells (PBMC)) and assay for soluble T cell activation/exhaustion receptors (Sol. rec.) in plasma during the study.
Fig. 2
Fig. 2
Kinetics of SARS CoV-2 specific serum antibody responses after vaccination and boosting. (A) Anti-spike IgG endpoint titers measured by ELISA in younger adults, older adults and individuals recovered from SARS-CoV-2 infection before vaccination. (B) Individual anti-spike IgG ELISA endpoint titers at 12 and 18 months in younger and older adults. (C) Neutralizing antibody titers measured by microneutralization assay (MN) against ancestral D614G strain in younger adults, older adults, and pre-vaccination convalescents. (D) Individual MN titers at 12 and 18 months in younger adults, older adults, pre-vaccination convalescents and younger and older adults infected with SARS-CoV-2 between 12 and 18 months. Data are presented as geometric mean titers (GMT) with 95 % confidence intervals (A, C) or as individual titers (B, D). Blue and red dotted lines with open symbols represent younger and older adults with breakthrough infections between 12 and 18 months, respectively. Significant differences were assessed by Kruskal-Wallis and Dunn’s multiple comparisons test. ****P < 0.0001, ***P < 0.001, **P < 0.01, *P < 0.05. Black, blue and red asterisks in figure A and C denote significant differences between younger versus older adults, pre-vaccination convalescents versus younger adults, and pre-vaccination convalescents versus older adults, respectively.
Fig. 3
Fig. 3
SARS CoV-2 specific IgG memory B cell responses after vaccination and boosting. (A) Spike-specific IgG memory B cells (MBC) measured by ELISpot in younger and older adults. (B) Individual anti-spike IgG MBC at 12 and 18 months in younger and older adults, and younger and older adults infected with SARS-CoV-2 between 12 and 18 months. (C) SARS-CoV-2 RBD-specific IgG MBC measured by ELISpot in younger and older adults. (D) Individual RBD-specific IgG MBC at 12 and 18 months in younger adults, older adults, and younger and older adults infected with SARS-CoV-2 between 12 and 18 months. Data are presented as mean spot forming cells/units (SFU) per million PBMC with 95 % confidence intervals (A, C) or as individual SFU per million PBMC (B, D). Blue and red dotted lines with open symbols represent younger and older adults with breakthrough infections between 12 and 18 months, respectively. Significant differences were assessed by Kruskal-Wallis and Dunn’s multiple comparisons test. *P < 0.05.
Fig. 4
Fig. 4
SARS CoV-2 spike specific T-cell responses after vaccination and boosting. (A) IFN-γ secreting T cells measured by FluoroSpot in younger and older adults. (B) Individual IFN-γ secreting T-cells at 12 and 18 months in younger and older adults, and younger and older adults infected with SARS-CoV-2 between 12 and 18 months. (C) IL-2 secreting T-cells measured by FluoroSpot in younger and older adults. (D) Individual IL-2 secreting T-cells at 12 and 18 months in younger and older adults, and younger and older adults infected with SARS-CoV-2 between 12 and 18 months. Data are presented as mean spot forming cells/units (SFU) per million PBMC with 95 % confidence intervals (A, C) or as individual SFU per million PBMC (B, D). Blue and red dotted lines with open symbols represent younger and older adults with breakthrough infections between 12 and 18 months. Significant differences were assessed by Kruskal-Wallis and Dunn’s multiple comparisons test. ***P < 0.001, **P < 0.01, *P < 0.05.
Fig. 5
Fig. 5
Associations between soluble T cell activation/exhaustion markers (sCD25, sTIM-3), age, and IFN-γ/IL-2 responses to spike peptides. Plasma levels of sTIM-3 (A) and sCD25 (B) from baseline to 9 months post vaccination in younger adults and older adults. Significant differences were assessed by Kruskal-Wallis and Dunn’s multiple comparisons test. ****P < 0.0001. (C) Spearman correlation matrix between age, sCD25, sTIM-3, and IFN-γ (IFNg) and IL-2 (IL2) secreting cells to the spike protein peptide pool at different sampling time points. For the 18 months data, individuals infected with SARS-CoV-2 between 12 and 18 months are not included. Spearman correlation coefficients (r) are shown.
Supplementary Fig. 1
Individual humoral and cellular responses in younger and older adults at 0–18 months. (A) Individual spike specific IgG endpoint titers measured by ELISA in younger adults, older adults and individuals recovered from SARS-CoV-2 infection before vaccination. (B) Individual microneutralization antibody titers against ancestral D614G strain in younger adults, older adults, and pre-vaccination convalescents. (C) Individual spike-specific IgG memory B cells (MBC) measured by ELISpot in younger and older adults. Data are presented as spot forming cells/units (SFU) per million PBMC. (D) Individual RBD-specific IgG memory B cells (MBC) measured by ELISpot in younger and older adults. Data are presented as SFU per million PBMC (peripheral blood mononuclear cells). (E) Individual IFN-γ secreting T-cells in younger and older adults. Data are presented as SFU per million PBMC. (F) Individual IL-2 secreting T-cells in younger and older adults. Data are presented as SFU per million PBMC. Significant differences were assessed by Kruskal-Wallis and Dunn’s multiple comparisons test. ****P < 0.0001, ***P < 0.001, **P < 0.01, *P < 0.05. Individuals with breakthrough infections between 12 and 18 months are not included at 18 months.
Supplementary Fig. 2
SARS CoV-2 nucleocapsid specific T-cell responses to SARS-CoV-2 spike peptide pool after vaccination and boosting. Number of IFN-γ producing cells in response to SARS-CoV-2 nucleocapsid peptide pool day 0 to 18 months in younger adults, older adults, and younger and older adults infected with SARS-CoV-2 between 12 and 18 months. Data are presented as mean spot forming cells/units (SFU) per million PBMC with 95% CIs (A) or as individual responses at 12 and 18 months of vaccinees not infected between 12 and 18 months versus vaccinees with breakthrough infections between 12 and 18 months (B). Blue and red dotted lines with open symbols represent younger and older adults with breakthrough infections between 12 and 18 months. Significant differences were assessed by Kruskal-Wallis and Dunn’s multiple comparisons test. ****P < 0.0001, *P < 0.05.
Supplementary Fig. 3
Spearman correlation matrix between all analyzed, soluble T cell activation/exhaustion markers, age, and IFN-γ/IL-2 responses to spike peptides. (A) Spearman correlation coefficients (r) and (B) Spearman correlation p-values. Significant p-values (p<0.050) are marked in green. Combined 18 months data for younger and older adults infected and not infected between 12 and 18 months (I+N) are included in the analysis.
Supplementary Fig. 4
Spearman correlation matrix between soluble T cell activation/exhaustion markers sTIM-3 and sCD25, age, and humoral responses. (A) Spearman correlation coefficients (r) and (B) Spearman correlation p-values. Significant p-values (p<0.050) are marked in green. Combined 18 months data for younger and older adults infected and not infected between 12 and 18 months (I+N) are included in the analysis.
Supplementary Fig. 5
Spearman correlation matrix between IFN-γ/IL-2 responses to spike peptides and humoral responses. (A) Spearman correlation coefficients (r) and (B) Spearman correlation p-values. Significant p-values (p<0.050) are marked in green. Combined 18 months data for younger and older adults infected and not infected between 12 and 18 months (I+N) are included in the analysis.

References

    1. Polack F.P., Thomas S.J., Kitchin N., Absalon J., Gurtman A., Lockhart S., et al. Safety and Efficacy of the BNT162b2 mRNA Covid-19 Vaccine. N Engl J Med. 2020;383(27):2603–2615. - PMC - PubMed
    1. Asamoah-Boaheng M., Goldfarb D., Prusinkiewicz M.A., Golding L., Karim M.E., Barakauskas V., et al. Determining the Optimal SARS-CoV-2 mRNA Vaccine Dosing Interval for Maximum Immunogenicity. Cureus. 2023;15(1):e34465. - PMC - PubMed
    1. Prusinkiewicz M.A., Sediqi S., Li Y.J., Goldfarb D.M., Asamoah-Boaheng M., Wall N., et al. Effect of vaccine dosing intervals on Omicron surrogate neutralization after three doses of BNT162b2. Heliyon. 2023;9(6):e17259. - PMC - PubMed
    1. Naaber P., Tserel L., Kangro K., Sepp E., Jurjenson V., Adamson A., et al. Dynamics of antibody response to BNT162b2 vaccine after six months: a longitudinal prospective study. Lancet Reg Health Eur. 2021;10 - PMC - PubMed
    1. Feikin D.R., Higdon M.M., Abu-Raddad L.J., Andrews N., Araos R., Goldberg Y., et al. Duration of effectiveness of vaccines against SARS-CoV-2 infection and COVID-19 disease: results of a systematic review and meta-regression. Lancet. 2022;399(10328):924–944. - PMC - PubMed

Associated data