. 2024 Sep 21:7:35.
doi: 10.20517/cdr.2024.50. eCollection 2024.

Screening of photosensitizers-ATP binding cassette (ABC) transporter interactions in vitro

Affiliations

Screening of photosensitizers-ATP binding cassette (ABC) transporter interactions in vitro

Shruti Vig et al. Cancer Drug Resist. .

Abstract

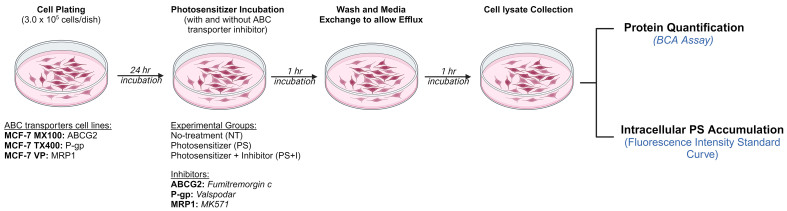
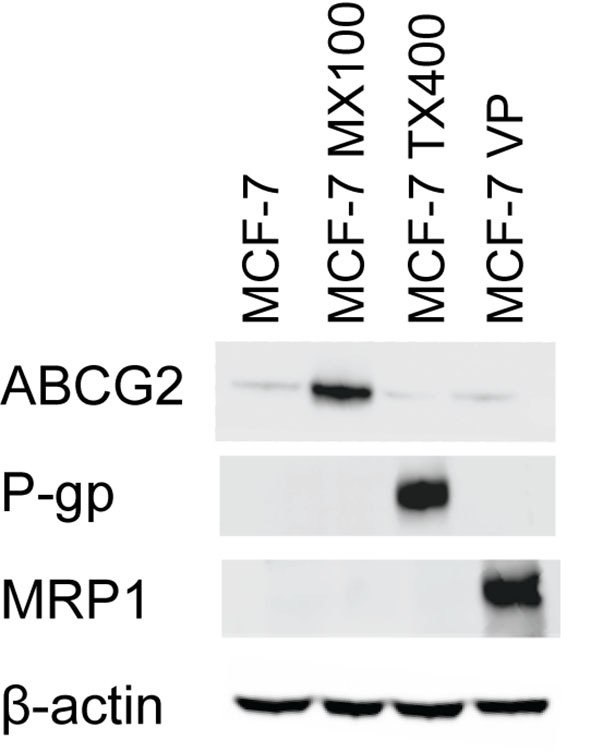
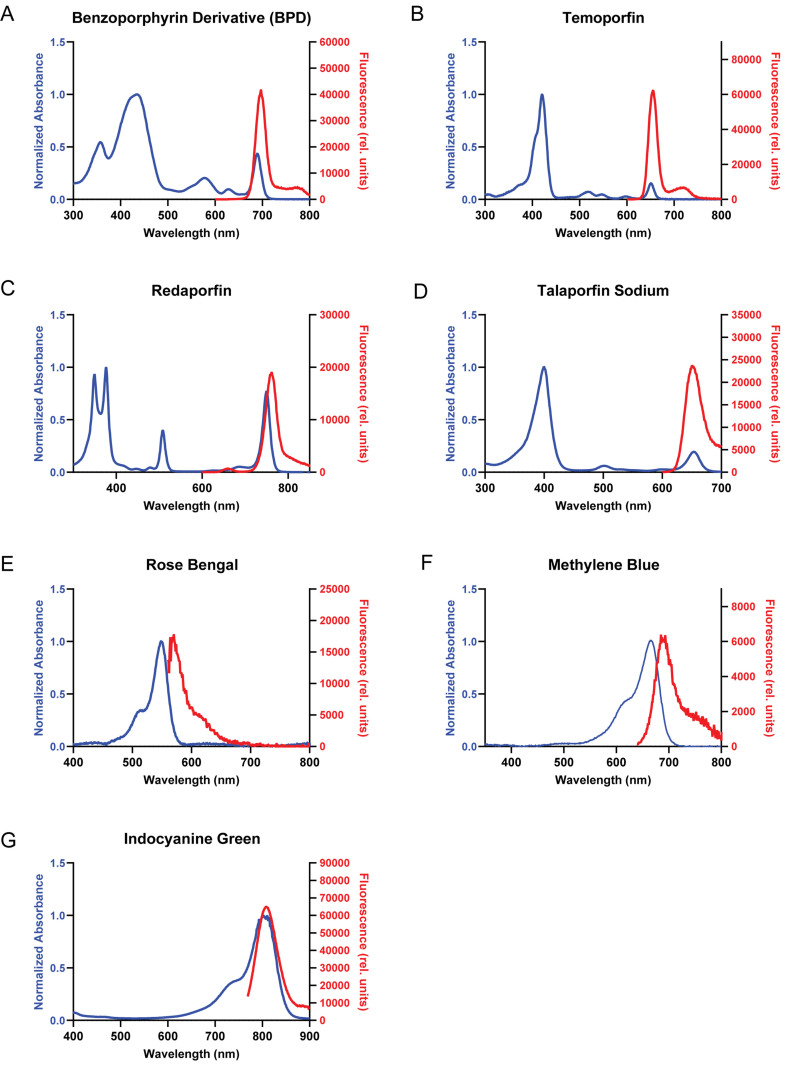
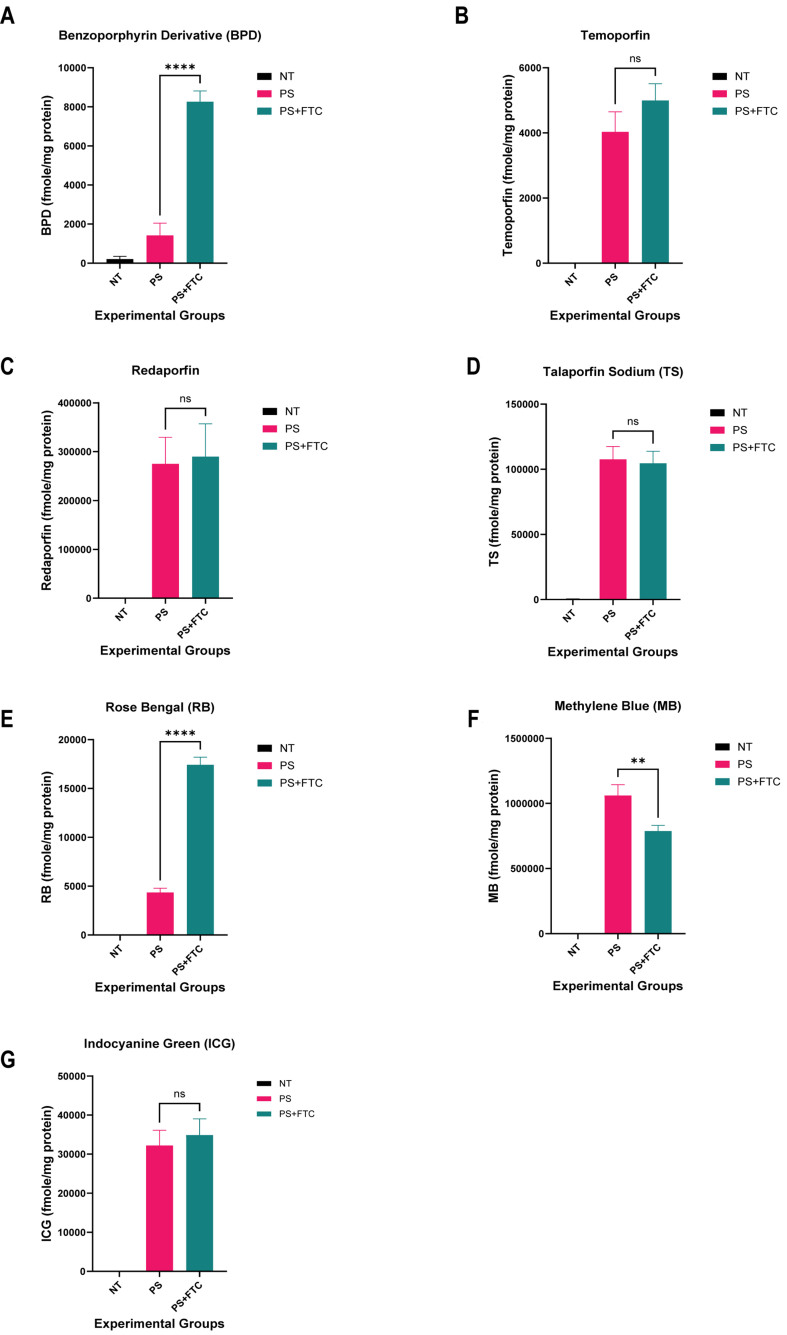
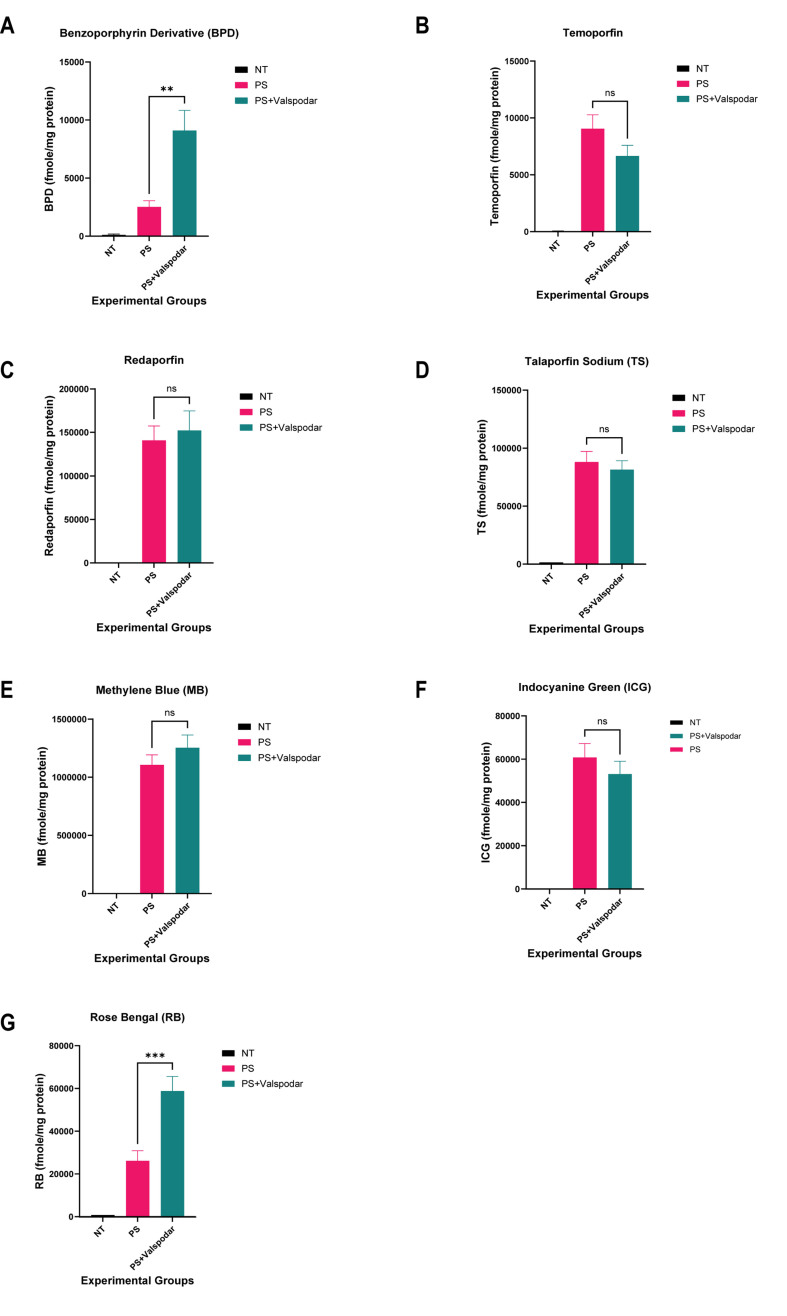
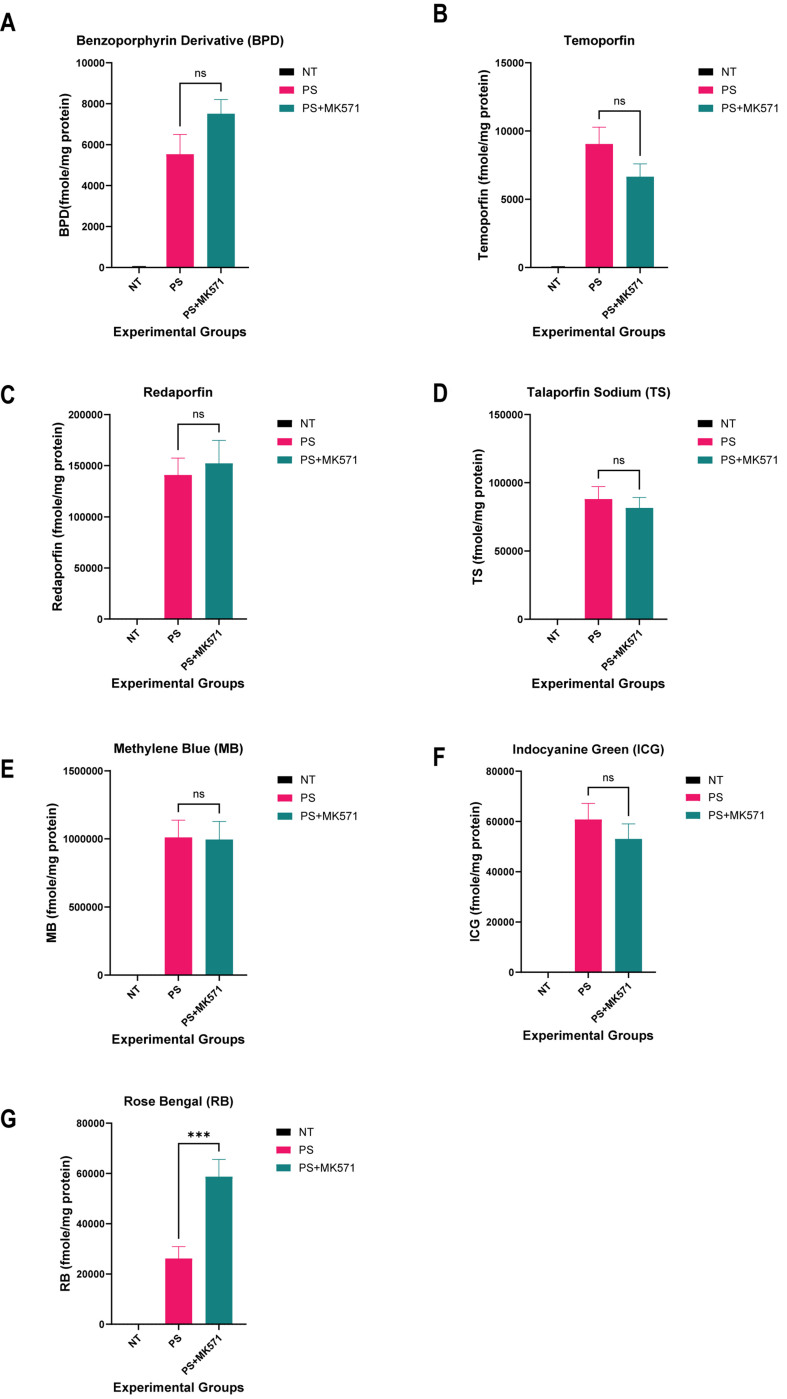
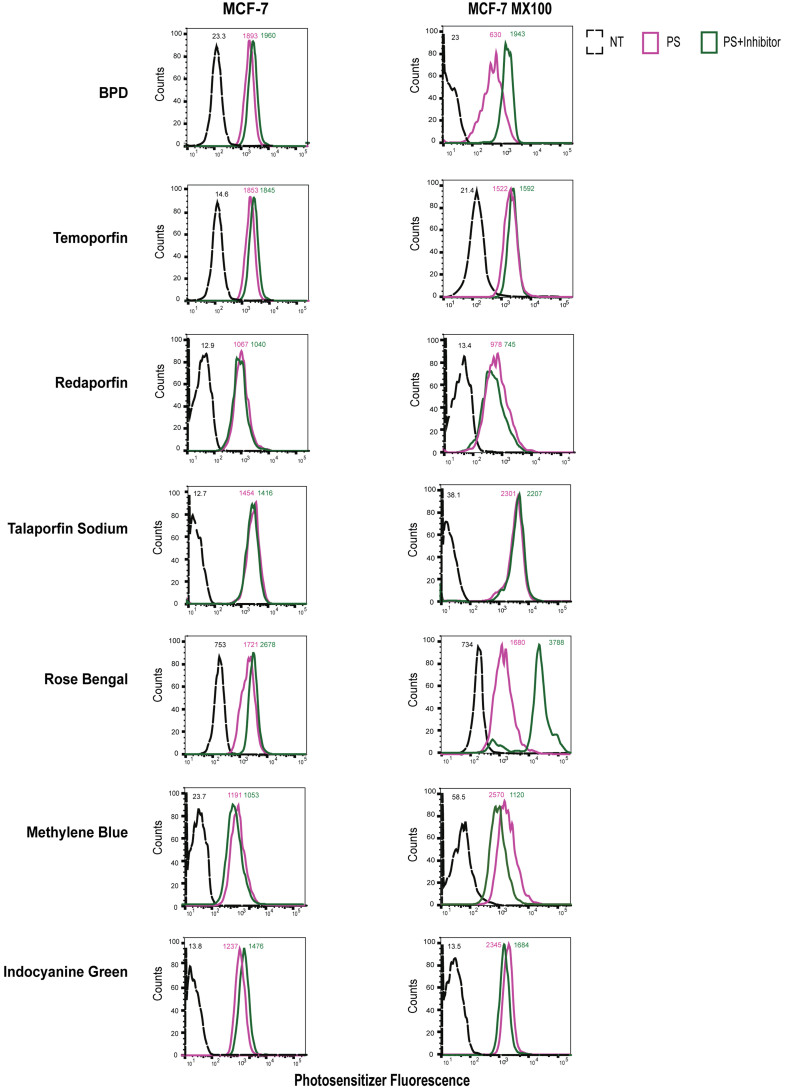
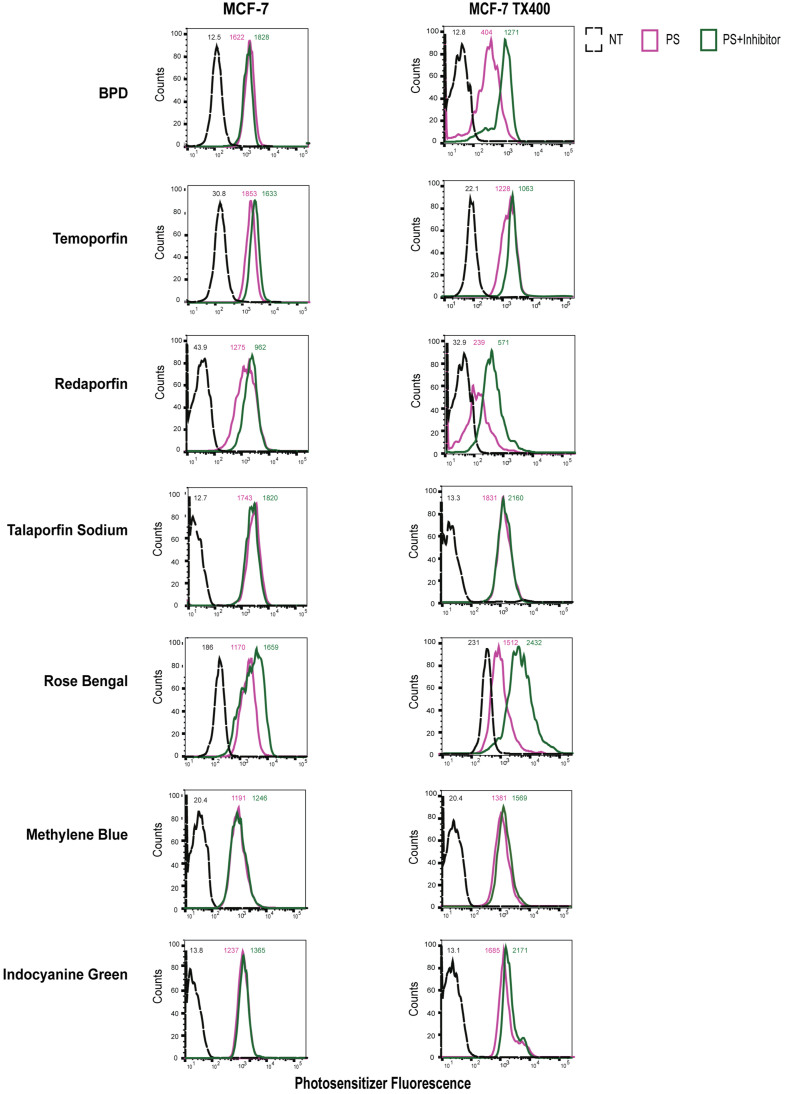
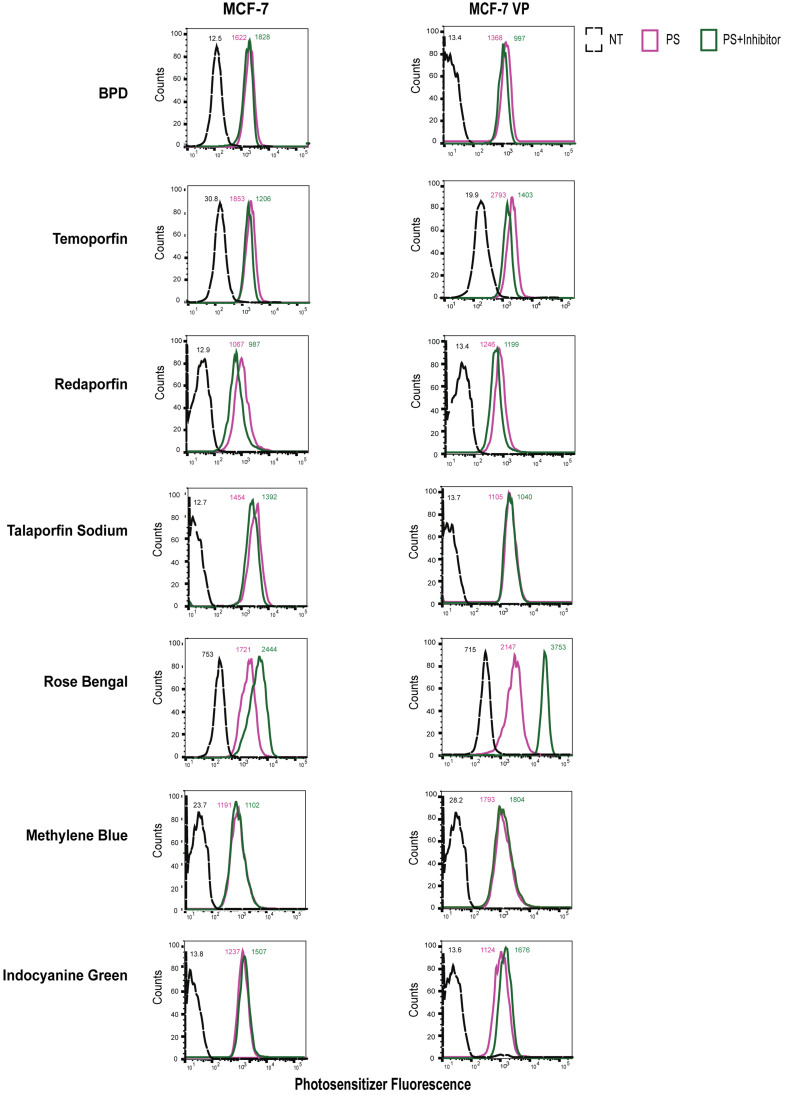
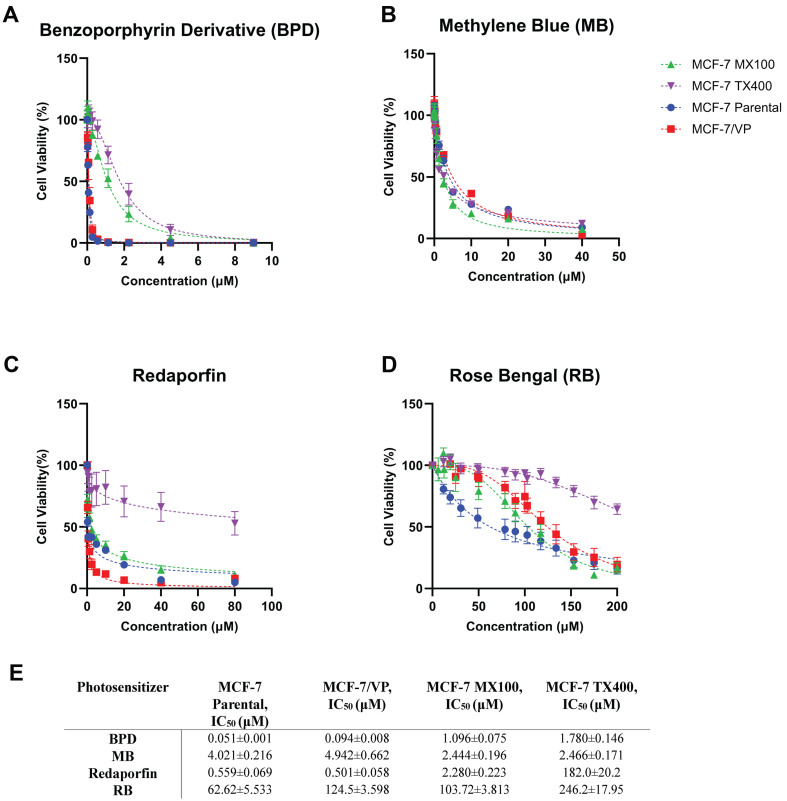
Aim: ATP-binding cassette (ABC) transporters are proteins responsible for the efflux of drug molecules from cancer cells, reducing the efficacy of anti-cancer treatments. This study assesses the susceptibility of a panel of clinically used photosensitizers to be transported by ABC transporters in vitro. Methods: The involvement of P-glycoprotein (P-gp/ABCB1), breast cancer resistance protein (BCRP/ABCG2), and multidrug resistance-associated protein 1 (MRP1/ABCC1) in the transport of 7 clinically utilized photosensitizers [benzoporphyrin derivative (BPD), temoporfin, redaporfin, talaporfin sodium, rose bengal, methylene blue, and indocyanine green] were investigated using human breast cancer cell lines following well-established protocols. Briefly, parental MCF-7 cells and sublines that overexpress P-gp (MCF-7 TX400), ABCG2 (MCF-7 MX100), or MRP1 (MCF-7/VP) were treated with photosensitizers with and without ABC transporter inhibitors. Intracellular levels of photosensitizers were measured using extraction method and flow cytometry to determine whether the ABC transporters are associated with efflux or uptake of photosensitizers. Results: The ABCG2 inhibitor (fumitremorgin C) and P-gp inhibitor (valspodar) effectively blocked the transport mediated by ABCG2 and P-gp of rose bengal and BPD. Redaporfin showed increased accumulation in the presence of valspodar with flow cytometry. Interestingly, MCF-7/VP cells were found to have reduced intracellular accumulation of rose bengal, which was restored with MRP1 inhibitor (MK571). The cell viability assay showed photodynamic therapy (PDT) resistance with Redaporfin in P-gp-overexpressing cells, BPD in ABCG2- and P-gp-overexpressing cells, and with Rose bengal in ABCG2-, P-gp- and MRP1-overexpressing cells, respectively. However, no change in intracellular retention was observed for other photosensitizers. Conclusion: In summary, our study provided new knowledge that temoporfin, talaporfin sodium, methylene blue, and indocyanine green are not substrates of ABCG2, P-gp, or MRP1. Redaporfin is a substrate for P-gp. BPD is a known substrate of ABCG2 and P-gp. Rose bengal is a substrate of ABCG2, P-gp, and MRP1. The results presented here indicate ABC transporter substrate status as a possible cause for cellular resistance to photodynamic therapy with rose bengal, redaporfin, and BPD.

Keywords: ATP-binding cassette (ABC) transporters; Multidrug resistance; photodynamic therapy; photosensitizers.


Conflict of interest statement

Uusimaa P is a co-founder of and has equity in Modulight Corporation, Finland. Huang HC has research agreements with Modulight Corporation, Finland. The remaining authors declared that there are no conflicts of interest.

Figures

Figure 1
Figure 1
Schematic of the intracellular photosensitizer accumulation quantification (Extraction) method. 3.0 × 10⁵ MCF-7 MX 100, MCF-7 TX400, and MCF-7/VP cells were plated in 35-mm dishes in duplicate and incubated overnight. After 24 h, the cells were incubated with the desired photosensitizer with or without ABC transporter inhibitors (ABCG2: FTC, P-gp: valspodar or MRP1: MK571) for 1 h at 37 °C in 5% CO2. Cells were washed with PBS and then incubated for 1 h at 37 °C in a photosensitizer-free medium with or without ABC transporter inhibitors to allow efflux. The cells were subsequently washed and collected for cell lysate preparation. The cell lysates were analyzed using BCA assay for protein quantification. The fluorescence intensity of the experimental groups was recorded using the spectrophotometer at specific Ex/Em wavelengths. Created with BioRender.com. FTC: Fumitremorgin C; PBS: phosphate-buffered saline; ABC: ATP binding cassette; BCA: bicinchoninic acid.
Figure 2
Figure 2
Western blot analysis of ABGC2, P-gp, and MRP1 expression in MCF-7 (parent cell line), MCF-7 MX100, MCF-7 TX400, and MCF-7/VP cells. Whole-cell extracts were collected and analyzed using Western blot. 20 µg of the whole cell extract was loaded in each lane. β-Actin was used as a loading control. ABC transporter selective cell lines show increased expression of respective transporters compared to the parental (control) cell line. ABC: ATP binding cassette.
Figure 3
Figure 3
Normalized absorbance (blue) and fluorescence (red) spectra of (A) BPD, (B) temoporfin, (C) redaporfin, (D) talaporfin sodium, (E) rose bengal, (F) methylene blue and (G) ICG used in the study. The absorbance spectrum of the test photosensitizers was recorded using a spectrophotometer. The photosensitizers were excited at respective Soret and Q bands to record the emission spectrum of the photosensitizers. BPD Ex: 435 nm; Temoporfin Ex: 422 nm; Redaporfin Ex: 510 nm; Talaporfin sodium Ex: 398 nm; Rose bengal Ex: 520 nm; Methylene blue Ex: 610 nm; ICG Ex: 730 nm. Respective excitation wavelengths at the Soret or Q band were chosen to avoid overlap between the excitation and the emission wavelengths while recording the fluorescence intensity during extraction experiments. BPD: Benzoporphyrin derivative; ICG: indocyanine green.
Figure 4
Figure 4
Intracellular levels of photosensitizers in MCF-7 MX100 (ABCG2-overexpressing) cell line using extraction method. Intracellular levels of the photosensitizers from cell lysates were determined by the fluorescence signals of the photosensitizer. BPD and rose bengal show a significant increase in accumulation in MCF-7 MX100 cells in the presence of ABCG2 inhibitor (FTC). The fmole/mg protein of photosensitizer is plotted for all the experimental groups. (A) Benzoporphyrin derivative; (B) Temoporfin; (C) Redaporfin; (D) Talaporfin sodium; (E) Rose Bengal; (F) Methylene blue; (G) Indocyanine green. (*P < 0.05, **P < 0.01, ***P < 0.001; One-way ANOVA Tukey’s range test) (N = 3-6). NT: not treated control; PS: photosensitizer only; PS+FTC: photosensitizer + inhibitor; ns: non-significant; BPD: benzoporphyrin derivative; FTC: fumitremorgin C.
Figure 5
Figure 5
Intracellular levels of photosensitizers in MCF-7 TX400 (P-gp overexpressing) cell line using extraction method. Intracellular levels of the photosensitizers from cell lysates were determined by the fluorescence signals of the photosensitizer. BPD and rose bengal show a significant increase in accumulation in MCF-7 TX400 cells in the presence of a P-gp inhibitor (valspodar). The fmole/mg protein of the photosensitizer was plotted for all the experimental groups. (A) Benzoporhyrin derivative; (B) Temoporfin; (C) Redaporfin; (D) Talaporfin sodium; (E) Methylene blue; (F) Indocyanine green; (G) Rose bengal. *P < 0.05, **P < 0.01, ***P < 0.001; One-way ANOVA Tukey’s range test (N = 3-5). NT: Not treated, control; PS: photosensitizer only; PS+Valspodar: photosensitizer + inhibitor; ns: non-significant; BPD: benzoporphyrin derivative.
Figure 6
Figure 6
Intracellular levels of photosensitizers in MRP1-overexpressing MCF-7/VP cell line using extraction method. Intracellular levels of the photosensitizers from cell lysates were determined by the fluorescence signals of the photosensitizer. Rose bengal shows a significant increase in accumulation in MCF-7/VP cells in the presence of MRP1 inhibitor (MK571). The fmole/mg protein of photosensitizer is plotted for all the experimental groups. (A) Benzoporhyrin derivative; (B) Temoporfin; (C) Redaporfin; (D) Talaporfin sodium; (E) Methylene blue; (F) Indocyanine green; (G) Rose bengal. *P < 0.05, **P < 0.01, ***P < 0.001; One-way ANOVA Tukey’s range test (N = 3-5). NT: Not treated control; PS: photosensitizer only; PS+MK571: photosensitizer + inhibitor; ns: non-significant.
Figure 7
Figure 7
ABCG2-overexpressing cells transport selected photosensitizers (BPD and Rose Bengal). Flow cytometry was performed to assess the intracellular fluorescence of photosensitizer. The raw mean fluorescence intensity values are reported for individual histograms. BPD and Rose bengal show higher uptake in the presence of the ABCG2 inhibitor, FTC. NT: Not treated, control; PS: photosensitizer only; PS+Inhibitor: photosensitizer + FTC; BPD: benzoporphyrin derivative; FTC: fumitremorgin C.
Figure 8
Figure 8
P-gp-overexpressing cells transport selected photosensitizers (BPD, Rose Bengal, and Redaporfin*). Flow cytometry was performed to assess the intracellular fluorescence of photosensitizer. The raw mean fluorescence intensity values are reported for individual histograms. BPD, redaporfin, and rose bengal show higher uptake in the presence of P-gp inhibitor valspodar. Heterogeneity in the single-cell population for the redaporfin-only group was observed in MCF-7 TX400 cells. NT: Not treated, control; PS: photosensitizer only; PS+Inhibitor: photosensitizer + valspodar; BPD: benzoporphyrin derivative.
Figure 9
Figure 9
MRP1 transports a selected photosensitizer (Rose Bengal). Flow cytometry was performed to assess the intracellular fluorescence of photosensitizer. The raw mean fluorescence intensity values are reported for individual histograms. Rose bengal shows higher uptake in the presence of MRP1 inhibitor MK571. NT: Not treated, control; PS: photosensitizer only; PS+Inhibitor: photosensitizer + MK571.
Figure 10
Figure 10
Photosensitizers that are ABC transporter substrates are resistant to PDT. Cell viability assays were performed 24 h post-PDT for (A) BPD, (B) Methylene Blue, (C) Redaporfin, and (D) Rose Bengal; (E) The IC50 (reported in μM) for each photosensitizer for the respective cell line is summarized in the table. ABC: ATP binding cassette; PDT: photodynamic therapy; BPD: benzoporphyrin derivative.

Similar articles

Cited by

References

    1. Obaid G, Celli JP, Broekgaarden M, et al. Engineering photodynamics for treatment, priming and imaging. Nat Rev Bioeng. 2024;2:752–69. doi: 10.1038/s44222-024-00196-z. - DOI
    1. Dolmans DEJGJ, Fukumura D, Jain RK. Photodynamic therapy for cancer. Nat Rev Cancer. 2003;3:380–7. doi: 10.1038/nrc1071. - DOI - PubMed
    1. Celli JP, Spring BQ, Rizvi I, et al. Imaging and photodynamic therapy: mechanisms, monitoring, and optimization. Chem Rev. 2010;110:2795–838. doi: 10.1021/cr900300p. - DOI - PMC - PubMed
    1. Allison RR, Moghissi K. Photodynamic therapy (PDT): PDT mechanisms. Clin Endosc. 2013;46:24–9. doi: 10.5946/ce.2013.46.1.24. - DOI - PMC - PubMed
    1. Ethirajan M, Chen Y, Joshi P, Pandey RK. The role of porphyrin chemistry in tumor imaging and photodynamic therapy. Chem Soc Rev. 2011;40:340–62. doi: 10.1039/b915149b. - DOI - PubMed

LinkOut - more resources