. 2025 Jan 10;64(2):e202414495.
doi: 10.1002/anie.202414495. Epub 2024 Nov 11.

Transient transition from Stable to Dissipative Assemblies in Response to the Spatiotemporal Availability of a Chemical Fuel

Affiliations

Transient transition from Stable to Dissipative Assemblies in Response to the Spatiotemporal Availability of a Chemical Fuel

Haridas Kar et al. Angew Chem Int Ed Engl. .

Abstract

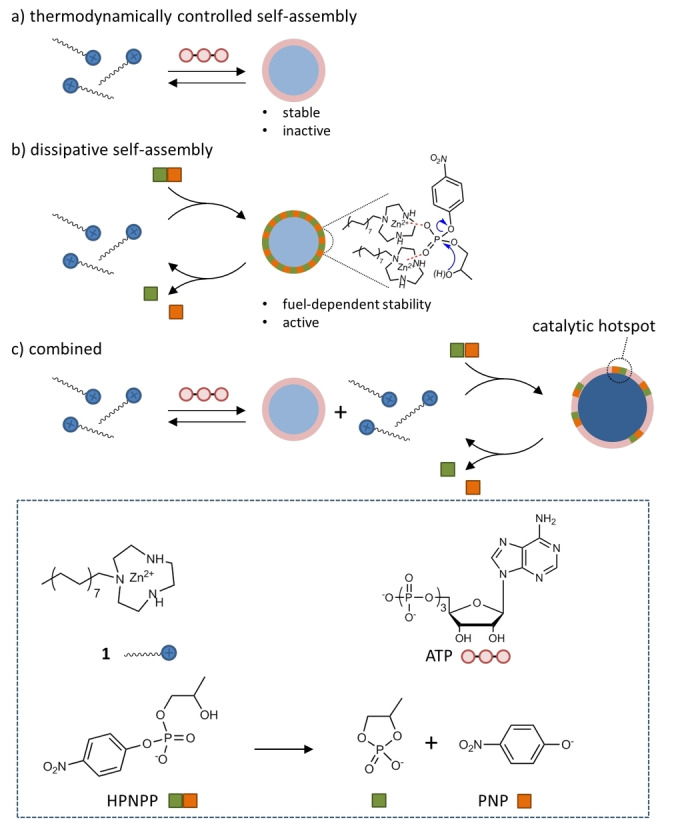
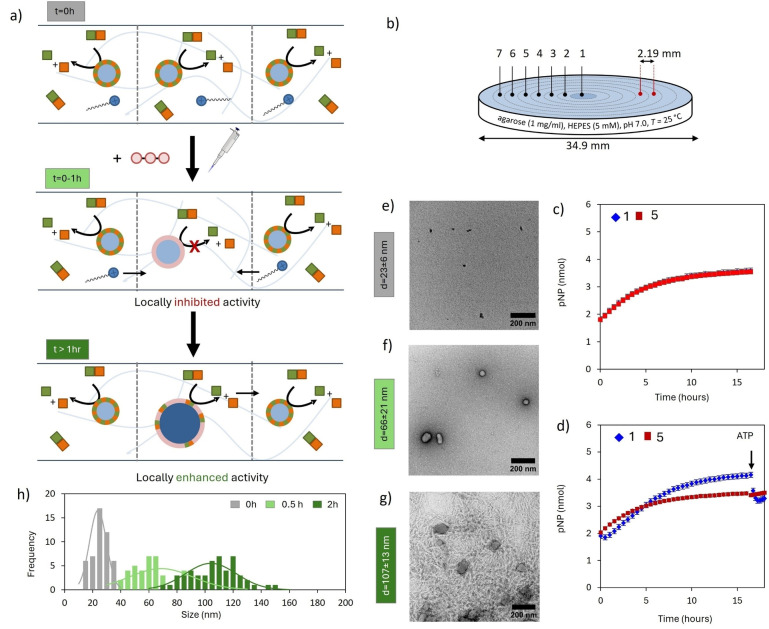
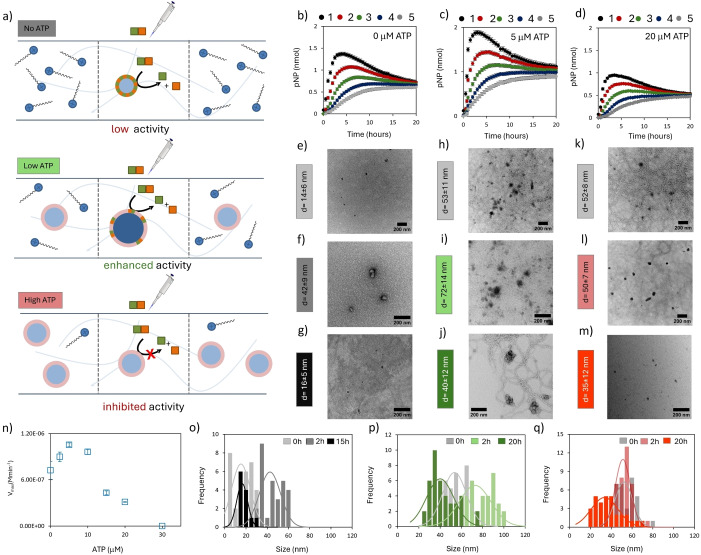
The transition from inactive to active matter implies a transition from thermodynamically stable to energy-dissipating structures. Here, we show how the spatiotemporal availability of a chemical fuel causes a thermodynamically stable self-assembled structure to transiently pass to an energy-dissipating state. The system relies on the local injection of a weak affinity phosphodiester substrate into an agarose hydrogel containing surfactant-based structures templated by ATP. Injection of substrate leads to the inclusion of additional surfactant molecules in the assemblies leading to the formation of catalytic hotspots for substrate conversion. After the local disappearance of the substrate as a result of chemical conversion and diffusion the assemblies spontaneously return to the stable state, which can be reactivated upon the injection of a new batch of fuel. The study illustrates how a dissipating self-assembled system can cope with the intermittent availability of chemical energy without compromising long-term structural stability.

Keywords: active matter; dissipative self-assembly; hydrogel; reaction-diffusion; systems chemistry.


Conflict of interest statement

The authors declare no conflict of interest.

Figures

Figure 1
Figure 1
Schematic representation of thermodynamic and dissipative self‐assembly processes and a combination of both.
Figure 2
Figure 2
(a) Schematic representation of the chemical processes that occur in a gel containing 1 and HPNPP upon the injection of ATP. (b) Experimental set up for local activation. The numbers indicated in the gel refer to the areas of which the absorbance intensity values are measured. Experimental data for areas 1 and 5 are reported in Figures 2c and d. A full account is given in Figure S4. (c) Absorbance at 405 nm for positions 1 and 5 as a function of time for a gel containing 1 (100 μM) and HPNPP (125 μM). (d) Absorbance at 405 nm for positions 1 and 5 as a function of time after the injection of 1 μL of a 5 mM stock solution of ATP in the position 1 of a gel containing 1 (100 μM) and HPNPP (125 μM). After 17 h, 1 μL of a 5 mM stock solution of ATP was injected in position 1. Transmission electron microscopy (TEM) images of position 1 of the gel in which ATP was injected taken at time=0 h (e), 0.5 h (f), 2 h (g). Additional TEM images are provided in section 8 of the Supporting Information. The scale bars correspond to 200 nm. (h) Size distribution of structures observed in TEM images (see also section 8 and 11 of the Supporting Information), fitted with normal distribution function (represented with solid line). Experimental conditions: agarose=1 mg/ml, [1]= 100 μM, [HPNPP]= 125 μM, [HEPES]=5 mM, T=25 °C. Error bars indicate the standard deviation calculated from duplo measurements.
Figure 3
Figure 3
(a) Schematic representation of the processes that occur in a gel containing 1 in the absence of ATP (top), low concentration of ATP (5 μM, middle) and a high concentration of ATP (20 μM, top) upon the injection of same amount of HPNPP. In the top figure surfactant 1 is represented in an unassembled form in the absence of HPNPP. Considering the critical aggregation concentration of around 100 μM for 1 in solution and some stabilizing effect of agarose on assemblies of 1, we anticipate 1 to be in a partially assembled state. Previous studies have shown that this does not block the diffusion of 1 through the matrix. b) Absorbance at 405 nm for positions 1–5 as a function of time after the injection of 1 μL of a 90 mM stock solution of HPNPP in the center of a gel containing 1 (100 μM). Transmission electron microscopy (TEM) images of position 1 of the gel taken at time=0 h (e), 2 h (f), 15 h (g). (o) Size distribution of structures observed in TEM images taken at different times, fitted with normal distribution function (solid line). Additional TEM images are provided in reference 41 (SI). c) Absorbance at 405 nm for positions 1–5 as a function of time after the injection of 1 μL of a 90 mM stock solution of HPNPP in the center of a gel containing 1 (100 μM) and ATP (5 μM). Transmission electron microscopy (TEM) images of position 1 of the gel taken at time=0 h (h), 2 h (i), 20 h (j). (p) Size distribution of structures observed in TEM images taken at different times, fitted with normal distribution function (solid line). Additional TEM images are provided in section 9a of the Supporting Information. d) Absorbance at 405 nm for positions 1–5 as a function of time after the injection of 1 μL of a 90 mM stock solution of HPNPP in the center of a gel containing 1 (100 μM)+ATP (20 μM). Transmission electron microscopy (TEM) images of position 1 of the gel taken at time=0 h (k), 2 h (l), 20 h (m). (q) Size distribution of structures observed in TEM images taken at different times, fitted with normal distribution function (solid line). Additional TEM images are provided in section 9c of the Supporting Information. The scale bars in all TEM images correspond to 200 nm. n) Maximum rates of HPNPP hydrolysis (t=10–50 minutes) as a function of the initial amount of ATP present in the gel with [1]=100 μM. Experimental conditions: agarose=1 mg/ml, [HEPES buffer]=5 mM, T=25 °C. Error bars indicate the standard deviation calculated from duplo measurements.

References

    1. Schrödinger E., What Is Life? Cambridge Univ Press, Cambridge, UK, 1944.
    1. Onsager L., Phys. Rev. 1931, 37, 405–426.
    1. Pascal R., Pross A., Sutherland J. D., Open Biol. 2013, 3, 1–9. - PMC - PubMed
    1. Ruiz-Mirazo K., Briones C., De La Escosura A., Chem. Rev. 2014, 114, 285–366. - PubMed
    1. Mann S., Acc. Chem. Res. 2012, 45, 2131–2141. - PubMed

LinkOut - more resources