. 2024 Oct;13(19):e70303.
doi: 10.1002/cam4.70303.

A High-Throughput Drug Repurposing Strategy to Treat TBX2 and/or TBX3 Dependent Cancers

Affiliations

A High-Throughput Drug Repurposing Strategy to Treat TBX2 and/or TBX3 Dependent Cancers

Jenna S Bleloch et al. Cancer Med. 2024 Oct.

Abstract

Background: The highly homologous T-box transcription factors TBX2 and TBX3 are critical for embryonic development, and their overexpression in postnatal tissues contributes to a wide range of malignancies, including melanoma and rhabdomyosarcoma. Importantly, when TBX2 and TBX3 are depleted in cancers where they are overexpressed, the malignant phenotype is inhibited, and they have therefore been regarded as druggable targets. However, the time and costs associated with de novo drug development are challenging and result in drugs that are costly, especially for patients in low- and middle-income countries. In the current study, we therefore combined a targeted and drug repurposing approach to identify drugs that are expected to be more efficacious and cost-effective with significantly reduced side effects.

Methods: A high-throughput cell-based immunofluorescence screen was performed to identify drugs in the Pharmakon 1600 drug library that can negatively regulate TBX2 and/or TBX3 levels. "Hit" drugs were validated for their effect on TBX2/TBX3 levels and cytotoxicity in TBX2/TBX3-dependent melanoma and rhabdomyosarcoma cells. To this end, immunofluorescence, western blotting, quantitative real-time PCR, and MTT cell viability assays were performed.

Results: Niclosamide, piroctone olamine, and pyrvinium pamoate, were identified as TBX2 and/or TBX3-targeting drugs, and they exhibited cytotoxicity in a TBX2/TBX3-dependent manner. Furthermore, these "Hit" drugs were shown to induce senescence and/or apoptosis.

Conclusions: Niclosamide, piroctone olamine, and pyrvinium pamoate are promising, cost-effective therapeutic agents for the treatment of TBX2/TBX3-dependent cancers.

Keywords: T‐box factors; drug repurposing; high‐throughput screen; transcription factors.


Conflict of interest statement

The authors declare no conflicts of interest.

Figures
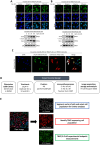
FIGURE 1
FIGURE 1
Tet‐On inducible cell culture model used in the high‐throughput screen. 501mel cell lines expressing an inducible FLAG‐tagged TBX2 and TBX3 treated with a range of doxycycline (dox) concentrations. Representative confocal immunofluorescence maximum intensity projection images (630X; Carl Zeiss LSM 880) and western blotting of (A) FLAG‐TBX2 and (B) FLAG‐TBX3. For immunofluorescence a FLAG primary antibody and Alexa Fluor 488 secondary antibody was used, and nuclei were stained with DAPI (scale bar is 20 μm) and for western blotting, antibodies used were as indicated and p38 was included as a loading control. Densitometry readings were obtained using ImageJ and protein expression levels are represented as a ratio of protein of interest/p38 normalised to the vehicle control sample. (C) Representative confocal immunofluorescence images (200X, 2X zoom; Carl Zeiss LSM 710) of co‐culture of FLAG‐TBX2 cells pre‐stained with CellTracker (DeepRed) and FLAG‐TBX3 cells treated with 20 ng/mL dox for 24 h and processed for immunofluorescence as described above. (D) Schematic of high‐throughput screen experimental design. (E) IN Cell Developer Toolbox customised parameter extraction protocol.
FIGURE 2
FIGURE 2
z‐score identification of commercially available ‘hit’ drugs that downregulate TBX2 and/or TBX3 protein levels. z‐score scatterplots of (A) FLAG‐TBX2 and (B) FLAG‐TBX3 expressing cells after 24 h of doxycycline induction (20 ng/mL) followed by Pharmakon drug library treatment (10 μM) for 4, 12 and 24 h. z‐scores were calculated from normalised mean FLAG‐TBX2/3 nuclear fluorescence data (z = (x‐μ)/σ, where x = well (drug) mean nuclear FLAG‐TBX2/3 fluorescence intensity value, μ = population (384‐well plate) mean FLAG‐TBX2/3 fluorescence intensity value and σ = population standard deviation). It was assumed that the data was normally distributed, and calculations were determined from two technical duplicates. A z‐score cut‐off of < −2 (i.e., more than 2 standard deviations below the population mean) and a cell count cut‐off of > 25 cells per FOV were used to select ‘hit’ compounds (red box on graphs) that downregulate TBX2 and or TBX3. (C) Venn diagram showing the ‘hit’ compounds identified in (A) and (B) above where 19, 6 and 7 compounds were identified to downregulate TBX2, TBX3 and both TBX2 and TBX3 total protein levels respectively. Compound names in blue represent already existing chemotherapeutics, purple represent DNA intercalating/binding and/or damaging agents and green are known protein synthesis inhibitors. Bolded compounds were taken further for validation.
FIGURE 3
FIGURE 3
High‐throughput screen immunofluorescence images of selected ‘commercially available ‘hit’ drugs that downregulate TBX2 and TBX3 protein levels. Representative IN Cell Analyser 6000 images of inducible FLAG‐TBX2 501mel and inducible FLAG‐TBX3 501mel co‐cultured cells treated for 24 h with 20 ng/mL doxycycline followed by 10 μM (A) vardenafil hydrochloride (ChemSpider ID: 8318471) (B) niclosamide (ChemSpider ID: 4322) (C) piroctone olamine (ChemSpider ID: 45574) (D) tacrolimus (ChemSpider ID: 393220) (E) pyrvinium pamoate (ChemSpider ID: 10152945) or vehicle for 24 h. The FLAG‐TBX2 population was pre‐stained with CellTracker Orange and a FLAG antibody with an Alexa Fluor 488 conjugated secondary antibody were used to detect FLAG‐tagged TBX2 and TBX3. Nuclei were stained with DAPI. The scale bar is 60 μm. Close up images in the far‐right panel show (A, B, E) FLAG‐TBX2 and (C, D) FLAG‐TBX3 expressing cells in red outlined boxes with unboxed cells expressing (A, B, E) FLAG‐TBX3 and (C, D) FLAG‐TBX2 (identified from CellTracker Orange staining).
FIGURE 4
FIGURE 4
Validation of selected ‘hit’ compounds identified to downregulate TBX2 and TBX3 protein levels. (A, C). Representative confocal immunofluorescence maximum intensity projection images (630X; Carl Zeiss LSM 880) of inducible (A) FLAG‐TBX2 (C) FLAG‐TBX3 501mel cells induced with doxycycline (dox) for 24 h followed by 10 μM drug (2.5 μM for pyrvinium pamoate due to cell sensitivity) or vehicle treatment for 24 h. Ectopic FLAG‐TBX2 and FLAG‐TBX3 was detected with a FLAG antibody and an Alexa Fluor 488 conjugated secondary antibody. Nuclei of cells were stained with DAPI. Scale bar is 20 μm. (B, D) Box plots represent quantification of (B) FLAG‐TBX2 (D) FLAG‐TBX3 levels per treatment condition as mean nuclear Alexa Fluor 488 fluorescence from 20 fields of view pooled from three independent repeats. Data was analysed using GraphPad Prism 6.0 and a parametric unpaired t‐test was performed where, ***p < 0.001, NS = not significant. Ectopic (E) TBX2 and (F) TBX3 protein levels detected by western blotting using a FLAG antibody in inducible TBX2‐FLAG 501mel and inducible TBX3‐FLAG 501mel cells respectively induced with doxycycline (dox) for 24 h followed by 10 μM drug (2.5 μM for pyrvinium pamoate due to cell sensitivity) or vehicle treatment for 24 h.
FIGURE 5
FIGURE 5
Niclosamide, piroctone olamine and pyrvinium pamoate regulation of TBX2 and TBX3 and the effect of tacrolimus on another Tet‐On inducible system. (A) Endogenous TBX2 and TBX3 levels in 501mel parental cell lines following 24 h treatment with 10 μM drug (2.5 μM for pyrvinium pamoate due to cell sensitivity) or vehicle determined by western blotting using antibodies to TBX2 and TBX3. (B) Quantitative RT‐PCR performed on reverse transcribed RNA extracted from Tet‐On inducible Cas9 stem cells induced with 20 ng/mL doxycycline (dox) for 24 h followed by treatment with 10 μM tacrolimus, piroctone olamine and vehicle for 24 h. Primers specific to Cas9 were used, mRNA levels were normalised to β‐actin and expressed relative to the uninduced control. (C) Western blotting showing levels of TBX2 and TBX3 in ERMS (RD cell line) and ARMS (RH30 cell line) cells after 24 h of 10 μM drug (2.5 μM pyrvinium pamoate) or vehicle treatment. (D) Quantitative RT‐PCR performed on reverse transcribed RNA extracted from 501mel, RD and RH30 cells treated for 24 h treatment with 10 μM drug (2.5 μM for pyrvinium pamoate due to cell sensitivity) or vehicle. Primers specific to TBX2 and TBX3 were used, mRNA levels were normalised to GUSB and expressed relative to the vehicle control. Data was analysed using GraphPad Prism 6.0 and a parametric unpaired t‐test was performed where, *p < 0.05, **p < 0.01, ***p < 0.001 an ****p < 0.0001. (E) Table showing the EC50 values from MTT cell viability assays of 501mel, RD and RH30 cells treated with a range of selected ‘Hit’ drug concentrations and vehicle as indicated for 72 h.
FIGURE 6
FIGURE 6
The effect of selected ‘hit’ drugs on TBX2 and TBX3 levels in melanoma, ERMS and ARMS cell lines. (A) Representative light microscopy images (200X; EVOS XL AMEX1000 Core Imaging System) of 501mel, RH30 and RD after 24 h of 10 μM drug (2.5 μM pyrvinium pamoate) or vehicle treatment. (B) Senescence‐Associated (SA)‐β‐Galactosidase staining of 501mel, RD and RH30 cells treated with either vehicle, or EC50 niclosamide, piroctone olamine and pyrvinium pamoate for 72 h after which cells were incubated with the SA‐β‐Gal chromogenic substrate 5‐bromo‐4‐chloro‐3‐indolyl β‐D‐galactopyranoside (X‐Gal) at pH 6 and SA‐β‐Gal positive cells were identified by a distinct blue colour. Representative brightfield microscopy images (200X; EVOS M5000 Imaging System; scale bars = 100 μm) are shown. (C) Western blot analyses of protein harvested from 501mel, RD and RH30 cells treated vehicle or EC50 concentrations of niclosamide, piroctone olamine and pyrvinium pamoate for 72 h and incubated with the PARP specific antibody. (D) 501mel, RD and RH30 cells were pre‐treated with 20 nM siControl, siTBX2 or siTBX3 24 h prior to the addition of EC50 concentrations of niclosamide, piroctone olamine and pyrvinium pamoate for 48 h after which the MTT cell viability assay was performed. p38 was used as a loading control and densitometry readings were obtained using ImageJ and protein expression levels are represented as a ratio of protein of interest/β‐actin normalised to the vehicle control sample (where possible). Blots are representative of at least two independent repeats. Graphs show mean cell viability as a percentage of vehicle control ± SEM for each concentration of drug determined from three independent experiments performed in quadruplicate. Data was analysed using GraphPad Prism 6.0 and a parametric unpaired t‐test was performed where, *p < 0.05, **p < 0.01, ***p < 0.001, NS = not significant.

Similar articles

Cited by

References

    1. Ciavarella S., Milano A., Dammacco F., and Silvestris F., “Targeted Therapies in Cancer,” BioDrugs 24 (2010): 77–88, 10.2165/11530830-000000000-00000. - DOI - PubMed
    1. Johnston S. J. and Carroll J. S., “Transcription Factors and Chromatin Proteins as Therapeutic Targets in Cancer,” Biochimica et Biophysica Acta (BBA)–Reviews on Cancer 1855 (2015): 183–192, 10.1016/j.bbcan.2015.02.002. - DOI - PubMed
    1. Papaioannou V. E., “The T‐Box Gene Family: Emerging Roles in Development, Stem Cells and Cancer,” Development 141 (2014): 3819–3833, 10.1242/dev.104471. - DOI - PMC - PubMed
    1. Bollag R. J. R. J., Siegfried Z., Cebra‐Thomas J. A. J. A., Garvey N., Davison E. M. E. M., and Silver L. M. L. M., “An Ancient Family of Embryonically Expressed Mouse Genes Sharing a Conserved Protein Motif With the T Locus,” Nature Genetics 7 (1994): 383–389, 10.1038/ng0794-383. - DOI - PubMed
    1. Sebé‐Pedrós A., Ariza‐Cosano A., Weirauch M. T., et al., “Early Evolution of the T‐Box Transcription Factor Family,” Proceedings of the National Academy of Sciences 110 (2013): 16050–16055, 10.1073/pnas.1309748110. - DOI - PMC - PubMed

MeSH terms

LinkOut - more resources