Observational Study
. 2024 Aug 29;134(20):e176567.
doi: 10.1172/JCI176567.

Immune-related events in individuals with solid tumors on immunotherapy associate with Th17 and Th2 signatures

Affiliations
Observational Study

Immune-related events in individuals with solid tumors on immunotherapy associate with Th17 and Th2 signatures

Chester J Kao et al. J Clin Invest. .

Abstract

BACKGROUNDImmune-related adverse events (irAEs) and their associated morbidity/mortality are a key concern for patients receiving immune checkpoint inhibitors (ICIs). Prospective evaluation of the drivers of irAEs in a diverse pan-tumor cohort is needed to identify patients at greatest risk and to develop rational treatment and interception strategies.METHODSIn an observational study, we prospectively collected blood samples and performed regular clinical evaluations for irAEs in patients receiving ICI therapy as standard of care for solid tumors. We performed in-parallel analysis of cytokines by Luminex immunoassay and circulating immune cells by cytometry by time-of-flight (CyTOF) at baseline and on treatment to investigate mechanisms of irAEs.RESULTSWe enrolled 111 patients, of whom 40.5% developed a symptomatic irAE (grade ≥ 2). Development of a grade ≥ 2 irAE was positively associated with the use of combination ICI and a history of an autoimmune disorder. Early changes in T helper 17 (Th17) (IL-6, IL-17f), type 2 (IL-5, IL-13, IL-25), and type 1 (TNF-α) cytokine signatures and congruent on-treatment expansions of Th17 and Th2 effector memory (Th2EM) T cell populations in peripheral blood were positively associated with the development of grade ≥2 irAEs. IL-6 levels were also associated with inferior cancer-specific survival and overall survival.CONCLUSIONSIn a diverse, prospective pan-tumor cohort, Th17 and Th2 skewing during early ICI treatment was associated with the development of clinically relevant irAEs but not antitumor responses, providing possible targets for monitoring and therapeutic interventions.FUNDINGJohns Hopkins Bloomberg-Kimmel Institute for Cancer Immunotherapy, the NCI SPORE in Gastrointestinal Cancers (P50 CA062924), NCI grant (R50CA243627 to LD), the NIH Center Core Grant (P30 CA006973), Swim Across America (to MY), NIAMS (K23AR075872 to LC), and imCORE-Genentech grant 137515 (to Johns Hopkins Medicine on behalf of MY).

Keywords: Cytokines; Immunotherapy; Oncology; T cells.


Figures

Figure 1
Figure 1. Study schema.
Diagram showing an overview of the key downstream analyses. Further details are provided in the Methods and Supplemental Materials. Created using icons from BioRender.com.
Figure 2
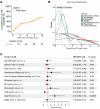
Figure 2. Grade ≥ 2 irAE distribution and association with clinicopathologic factors.
(A) Cumulative probability of grade ≥ 2 irAEs in the total cohort (n = 111). (B) Density plot showing the onset of different types of grade ≥ 2 irAEs with at least 2 events in the cohort (n = 40). (C) Forest plot displaying the HRs for time to grade ≥ 2 irAE onset from a univariate Cox model (n = 111). CI, confidence interval; GI, gastrointestinal; Gr≥2, grade ≥ 2; GU, genitourinary; HR, hazard ratio; ICI, immune checkpoint inhibitor; UAD, upper aerodigestive.
Figure 3
Figure 3. Early changes in T helper–associated cytokines precede grade ≥ 2 irAE development.
(A) Schema for early on-treatment time event analysis (n = 88). (B) Scatterplot displaying the adjusted HR for early on-treatment cytokine fold change and time to onset of grade ≥ 2 irAEs utilizing a multivariate Cox model and multitesting adjustment. The dotted line represents unadjusted P = 0.05, in which cytokines above the line are significant without multitesting correction. The size of each cytokine dot represents the width of the 95% CI range. (CH) Reverse Kaplan-Meier (KM) plots for cumulative probability of grade ≥ 2 irAEs for statistically significant cytokines from the multivariate Cox model after multitesting adjustment. Optimal cutoffs were determined using maximally selected log-rank statistics. (I) Reverse KM plot for the cumulative probability of grade ≥ 2 irAEs utilizing a combined cytokine status based on presence of high cytokine fold changes as determined by the optimal cutoffs calculated for the 6 cytokines: low, 0-1 cytokines; intermediate, 2-3 cytokines; and high, ≥4 cytokines. Time to irAE onset or last follow up was adjusted for time to early on-treatment sample collection to account for immortal time bias. adj., adjusted; CI, confidence interval; Gr≥2, grade ≥2; HR, hazard ratio; KM, Kaplan Meier.
Figure 4
Figure 4. Early treatment changes in T helper associated cytokines are associated with distinct grade ≥ 2 irAEs.
(A) Schema for early on-treatment cytokines and irAE group comparisons (no grade ≥ 2 irAE, n = 28; grade ≥ 2 irAE, n = 34). (B) Heatmap showing early treatment fold changes of 32 cytokines grouped by future irAE status. Additional clinical annotations include the type of ICI regimen given and cancer group. (C) Boxplots showing log2 transformed cytokine fold changes between patients who develop future grade ≥ 2 irAE or not. (D) Boxplots showing log2 transformed cytokine fold changes between patients who develop specific types of irAEs compared with no grade ≥ 2 irAE. Comparisons between groups were performed using Wilcoxon rank-sum test. Abbreviations: Gr≥2, grade ≥ 2; ICI, immune checkpoint inhibitor. *P < 0.05, **P < 0.01, ***P < 0.001.
Figure 5
Figure 5. Higher early treatment changes in IL-6 are associated with nonresponse.
Objective response was defined as complete response or partial response, while nonresponse included stable disease and progression. (A) Stacked barplot showing difference in best objective response between patients who develop future grade ≥ 2 irAE or not (91 patients had RECIST assessable disease). Fischer’s exact test was nonsignificant, P = 0.17. Landmark analysis at (B) 3 months (n = 95) and (C) 6 months (n = 63) to assess the influence of grade ≥ 2 irAE development on survival. For landmark analyses, grade ≥ 2 irAEs had to occur prior to the landmark time, and significance testing was performed with log-rank test. (D) Schema for early on-treatment cytokines and response comparisons. (E) Boxplots showing early treatment log2 transformed cytokine fold changes between patients who achieved an objective response (n = 26) or not (n = 48). Comparisons between groups were performed using Wilcoxon rank-sum test. Abbreviations: Gr≥, grade ≥ 2. *P < 0.05.
Figure 6
Figure 6. Higher early treatment changes in IL-6 are associated with worse cancer-specific and overall survival.
From the multivariate Cox models for the early on-treatment cohort (n = 88), scatterplots displaying log10 transformed adjusted HRs for early on-treatment cytokine fold changes and the time to grade ≥ 2 irAE onset compared with (A) cancer-specific survival and (B) overall survival. Cytokines that are significant after FDR adjustment are displayed. (C) Cancer-specific survival and (D) overall survival KM curves stratified by an optimal fold change cutoff of 2.3 for early treatment changes in IL-6. The optimal cutoff was determined using maximally selected log-rank statistics. (E) Landmark analysis at 10 weeks stratified by optimal fold change cutoff of 2.3 for early treatment changes in IL-6 and grade ≥ 2 irAE development. For landmark analyses, grade ≥ 2 irAEs had to occur prior to the landmark time. Significance for KM curves was assessed utilizing log-rank test. FDR, false discovery rate; Gr≥2, grade ≥ 2; HR, hazard ratio; KM, Kaplan Meier.
Figure 7
Figure 7. Higher changes in Th17 cytokines are detected at the onset of grade ≥ 2 irAEs.
(A) Schema for time of irAE cytokines and irAE group comparisons. (B) Heatmap showing on-treatment fold changes of 32 cytokines grouped by irAE status (no grade ≥ 2 irAE, n = 31; grade ≥ 2 irAE, n = 24) near the time of irAE onset. Additional clinical annotations include the type of ICI regimen given and cancer group. (C) Boxplots showing log2 transformed cytokine fold changes between patients who developed a grade ≥ 2 irAE or not near the time of irAE onset. (D) Boxplots showing log2 transformed cytokine fold changes between patients who develop specific types of irAEs compared with no grade ≥ 2 irAE near the time of irAE onset. Comparisons between groups were performed using Wilcoxon rank-sum test. Gr≥2, grade ≥2; ICI, immune checkpoint inhibitor. *P < 0.05, **P < 0.01, ***P < 0.001, ****P < 0.0001.
Figure 8
Figure 8. Higher fold change in abundance of Th17 and Th2EM cells are associated with the development of grade ≥ 2 irAEs.
CyTOF analysis of 99 paired on-treatment and baseline PBMC samples to assess cellular differences based on grade ≥ 2 irAE status. On-treatment PBMC samples utilized in this analysis included the closest sample to onset of the grade ≥ 2 irAE or the earliest available timepoint for patients without grade ≥ 2 irAEs. PBMC samples were thawed and assayed by a 37-marker CyTOF panel. A FlowSOM algorithm was used to generate 40 metaclusters, which were annotated into a final 27 clusters. (A) Scaled expression profile for each cluster is shown in the heatmap. (B) UMAP plots visualizing the annotated clusters (200 cells per sample). Boxplots showing the abundance of Th2EM cells at (C) baseline, (D) on treatment, and (E) fold change between the 2 timepoints in patients with grade ≥ 2 irAEs (n = 43) or not (n = 56). Boxplots showing the abundance of Th17 cells at (F) baseline, (G) on treatment, and (H) fold change between the 2 timepoints. Boxplots showing the abundance of Th1EM at (I) baseline and (J) on treatment. Comparisons between groups were performed using unpaired t test. CTL, cytotoxic T lymphocyte; CM, central memory; DNT, double-negative T; EFF, effector; EM, effector memory; N, naive; NK, natural killer; Tc, cytotoxic T cell; Th, helper T cell; UA, unassigned. *P < 0.05, ***P < 0.001.

Comment in

  • Distinguishing between help and harm: Helper T cell subsets and immune-related adverse events

References

    1. Zhang Z, et al. T Cell dysfunction and exhaustion in cancer. Front Cell Dev Biol. 2020;8:17. doi: 10.3389/fcell.2020.00017. - DOI - PMC - PubMed
    1. Postow MA, et al. Immune-related adverse events associated with immune checkpoint blockade. N Engl J Med. 2018;378(2):158–168. doi: 10.1056/NEJMra1703481. - DOI - PubMed
    1. Martins F, et al. Adverse effects of immune-checkpoint inhibitors: epidemiology, management and surveillance. Nat Rev Clin Oncol. 2019;16(9):563–580. doi: 10.1038/s41571-019-0218-0. - DOI - PubMed
    1. Motzer RJ, et al. Nivolumab plus Ipilimumab versus Sunitinib in advanced renal-cell carcinoma. N Engl J Med. 2018;378(14):1277–1290. doi: 10.1056/NEJMoa1712126. - DOI - PMC - PubMed
    1. Larkin J, et al. Five-year survival with combined nivolumab and ipilimumab in advanced melanoma. N Engl J Med. 2019;381(16):1535–1546. doi: 10.1056/NEJMoa1910836. - DOI - PubMed

Publication types

Substances