. 2024 Jan 8;18(1):wrae187.
doi: 10.1093/ismejo/wrae187.

Gut microbiota carbon and sulfur metabolisms support Salmonella infections

Affiliations

Gut microbiota carbon and sulfur metabolisms support Salmonella infections

Ikaia Leleiwi et al. ISME J. .

Abstract

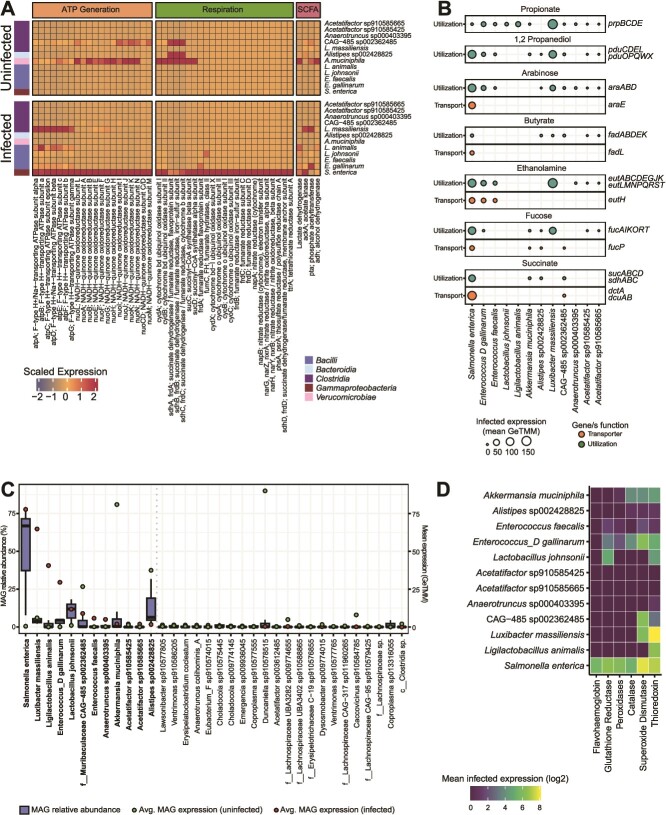
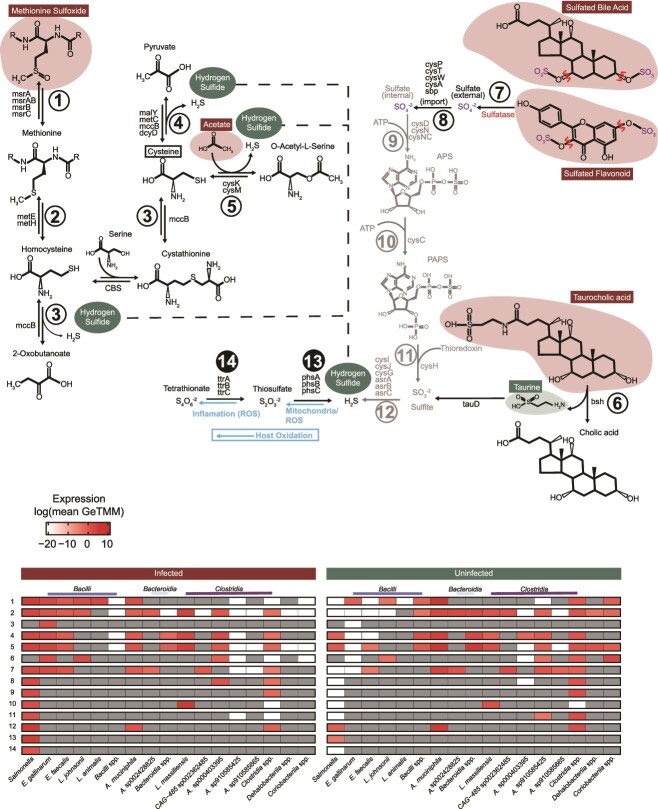
Salmonella enterica serovar Typhimurium is a pervasive enteric pathogen and ongoing global threat to public health. Ecological studies in the Salmonella impacted gut remain underrepresented in the literature, discounting microbiome mediated interactions that may inform Salmonella physiology during colonization and infection. To understand the microbial ecology of Salmonella remodeling of the gut microbiome, we performed multi-omics on fecal microbial communities from untreated and Salmonella-infected mice. Reconstructed genomes recruited metatranscriptomic and metabolomic data providing a strain-resolved view of the expressed metabolisms of the microbiome during Salmonella infection. These data informed possible Salmonella interactions with members of the gut microbiome that were previously uncharacterized. Salmonella-induced inflammation significantly reduced the diversity of genomes that recruited transcripts in the gut microbiome, yet increased transcript mapping was observed for seven members, among which Luxibacter and Ligilactobacillus transcript read recruitment was most prevalent. Metatranscriptomic insights from Salmonella and other persistent taxa in the inflamed microbiome further expounded the necessity for oxidative tolerance mechanisms to endure the host inflammatory responses to infection. In the inflamed gut lactate was a key metabolite, with microbiota production and consumption reported amongst members with detected transcript recruitment. We also showed that organic sulfur sources could be converted by gut microbiota to yield inorganic sulfur pools that become oxidized in the inflamed gut, resulting in thiosulfate and tetrathionate that support Salmonella respiration. This research advances physiological microbiome insights beyond prior amplicon-based approaches, with the transcriptionally active organismal and metabolic pathways outlined here offering intriguing intervention targets in the Salmonella-infected intestine.

Keywords: Microbiome; genome-resolved; lactate; lactic-acid bacteria; metatranscriptomics; murine.


Conflict of interest statement

The authors have no competing interests to report.

Figures

Figure 1
Figure 1
Salmonella infection enriches for distinct bacterial community membership. (A) experimental sampling scheme showing total fecal samples taken on each day for 16S rRNA gene amplicon sequencing (left), and multi-omics analysis (middle). Salmonella treatment start is on day 0 and specific sample totals by treatment are listed in the right figure panel. Mice with multi-omics data are designated with a “U” if they were in the uninfected group (n = 8) or with an “I” if they were in the Salmonella infected group (n = 11). Samples used to reconstruct genomes for the CBAJ-DB v1.2 were collected from either day 1, 5, 8, or 11 as shown by the top row of circles in the middle panel. Unique MAGs (n = 160) listed in the right panel are all medium or high quality (contamination <10% and completeness ≥50%). (B) stacked bars showing the ASV class distribution of mice that have metatranscriptomic and metabolomic data. Mouse U1 day 11 sample was omitted via ASV table filtering (see methods). Significant differences (Wilcoxon rank sum) between classes of either early timepoints (E; days −2, −1, and 0), late time points (L; days 10, 11, and 12), infected samples (I), or uninfected samples (U). Colored circles below the bars represent either metatranscriptomics or metabolomics was performed on that particular mouse and the circle color denotes the treatment (green for uninfected and red for infected). (C) linear discriminant analysis of 16S rRNA gene amplicon data from late timepoint samples (days 10–12) from the subset of mice with metatranscriptomic and metabolomic data. Points are sized by relative abundance of each genus within a treatment (infected or uninfected) and are colored by treatment where points aligning with x-axis value 0 are the relative abundance of each genus in the non-significant treatment. Genera classes are listed by color on the right of the plot.
Figure 2
Figure 2
Microbiota gene expression during infection reveals potential for substrate overlap with Salmonella. (A) Heatmap of genome transcript recruitment during infection and there significant differentially expression between treatments. Cell values are GeTMM scaled totals of all genes linked with a particular gene description (x-axis) averaged across samples within a treatment and expressed by an individual taxon (y-axis). Colored boxes on the left indicated gene class. (B) carbon utilization and transport expressed by prominent bacteria during Salmonella infection. (C) box plots (blue) showing the MAG relative abundance distribution (GeTMM normalized mapped reads) of the 35 bacteria with the highest average expression (total annotated genes) in Salmonella-infected mice. Red points indicate average MAG expression in the infected treatment and green points indicate average MAG expression in the uninfected treatment. Taxa are ranked left to right by most detected expression during infection. Bold taxa are those with ≥1.5 mean expression (GeTMM) in the infected treatment, a threshold marked by the dotted gray line. (D) average expression of oxidative stress response genes by prominent taxa during infection.
Figure 3
Figure 3
Co-expression patterns indicate lactate cross-feeding and competition during infection. Expression of individual lactate dehydrogenase genes by select taxa during Salmonella infection. Circle sizes indicate average log expression in infected samples recruited by individual genomes or averaged within higher taxonomic groups. Numbered sections in the Salmonella pie chart denote the proportion of total lactate dehydrogenase expression represented by each gene. NADH dehydrogenase gene content was examined for each MAG, a plus (+) indicates at least one Pfam annotated gene is present, a minus (−) indicates no genes were annotated “NADH dehydrogenase”. Positive (+) obligate fermenter designation was assigned if a MAG showed no expression of any respiratory genes as surveyed in Fig. 2. Negative (−) obligate fermenter designation was applied to all other MAGs in the figure and is supported by literature discussed in the text.
Figure 4
Figure 4
Uninfected differ from inflamed metabolomes in sulfonated bile acids and flavonoids. (A) principal component analysis (PCA) of metabolites from infected and uninfected mice colored by treatment (red = infected, green = uninfected). Arrows and bars are significant (ANOVA P < 0.05) compounds. Dark arrows are the top 10 compounds that explain the PCA ordination variance (Euclidian distance from tip to centroid). Bars are arranged by absolute value of compound loading for each component, and they are colored by compound group. (B) volcano plots of significant metabolites separated by compound group. Points are colored by treatment (red = infected, green = uninfected) and dark points indicate significant (ANOVA P < 0.05) compounds with at least 4x log2 fold change between treatments. Select compounds (most changed or system relevant) are labeled below the plot and sulfur containing compounds are denoted with an asterisk. (C) Heatmap showing the center scaled abundance of significantly different sulfur containing compounds in each treatment.
Figure 5
Figure 5
Community expression profiles implicate commensal membership supports Salmonella sulfur metabolism during infection. Pathways depicting amino acid (left) and sulfated bile/flavonoid compounds (right) as organic sulfur substrates used by the infected microbial community to produce hydrogen sulfide. Numbered pathway arrows correspond with numbered rows in the heatmaps. Dashed lines connect sections of the amino acid pathway to the hydrogen sulfide pool. Blue arrows show host oxidation of inorganic sulfur. Sulfate (purple) released by sulfatase activity (indicated in red) precedes sulfate reduction steps following ABC transporter-mediated translocation colored gray. Compounds outlined in red, and green are significantly more abundant in infected metabolomes or uninfected metabolomes respectively, and compounds outlined in black are not present in our metabolite data. The heatmap on the right indicates pathway expression in uninfected mice and the heatmap on the left indicates expression from infected mice. Cells are colored by average log expression and are dark grey if no expression was detected. Pathway steps denoted with black filled circles are specific to Salmonella in the community.

Update of

References

    1. Plumb ID, Brown AC, Stokes EK, et al. Increased Multidrug-Resistant Salmonella enterica I Serotype 4,[5],12:i:- Infections Associated with Pork, United States, 2009–2018—Volume 29, Number 2—February 2023—EID J—CDC. [cited 3 April 2023]; Available from:https://wwwnc.cdc.gov/eid/article/29/2/22-0950_article. - PMC - PubMed
    1. U.S. Department of Agriculture Food Safety and Inspection Service. Salmonella By the Numbers. [cited 3 April 2023]. Available from: http://www.fsis.usda.gov/inspection/inspection-programs/inspection-poult....
    1. World Health Organization. Salmonella (non-typhoidal). [cited 3 February 2021]. Available from:https://www.who.int/news-room/fact-sheets/detail/salmonella-(non-typhoidal).
    1. Vidal JL, Clavijo V, Castellanos LRet al. . Multidrug-resistant Salmonella spp. in fecal samples of pigs with suspected salmonellosis in Antioquia, Colombia, 2019–2021. Rev Panam Salud Publica 2023;47:e46. 10.26633/RPSP.2023.46 - DOI - PMC - PubMed
    1. U.S. Department of Health and Human Services Centers for Disease Control and Prevention . Antibiotic Resistance Threats in the United States, 2019. CDC (U.S.); 2019. [cited 7 November 2023]. Available from:https://stacks.cdc.gov/view/cdc/82532.

LinkOut - more resources