. 2024 Sep 26;13(19):1613.
doi: 10.3390/cells13191613.

Senescence Biomarkers CKAP4 and PTX3 Stratify Severe Kidney Disease Patients

Affiliations

Senescence Biomarkers CKAP4 and PTX3 Stratify Severe Kidney Disease Patients

Sean McCallion et al. Cells. .

Abstract

Introduction: Cellular senescence is the irreversible growth arrest subsequent to oncogenic mutations, DNA damage, or metabolic insult. Senescence is associated with ageing and chronic age associated diseases such as cardiovascular disease and diabetes. The involvement of cellular senescence in acute kidney injury (AKI) and chronic kidney disease (CKD) is not fully understood. However, recent studies suggest that such patients have a higher-than-normal level of cellular senescence and accelerated ageing.

Methods: This study aimed to discover key biomarkers of senescence in AKI and CKD patients compared to other chronic ageing diseases in controls using OLINK proteomics.

Results: We show that senescence proteins CKAP4 (p-value < 0.0001) and PTX3 (p-value < 0.0001) are upregulated in AKI and CKD patients compared with controls with chronic diseases, suggesting the proteins may play a role in overall kidney disease development.

Conclusions: CKAP4 was found to be differentially expressed in both AKI and CKD when compared to UHCs; hence, this biomarker could be a prognostic senescence biomarker of both AKI and CKD.

Keywords: acute kidney injury; biomarker; chronic kidney disease; machine learning; senescence.


Conflict of interest statement

The authors declare no conflicts of interest.

Figures

Figure 1
Figure 1
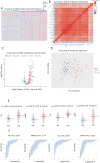
Senescence Proteins with Significant Differences in their Plasma Concentrations in AKI Patients vs. UHCs. (A). Heatmap of proteins that were significantly altered between AKI patients and UHCs using unsupervised clustering. Heatmap showing unsupervised clustering of the proteins that were significantly altered between AKI patients and UHCs. Clustering was conducted for gender, age, BMI, and cohort on the x-axis with protein clusters shown on the y-axis. Protein change is represented by coloured bars which use the UHC as the reference group. Red represents an upregulation in AKI patients and blue represents a downregulation in the AKI patients. Grey represents missing data. The darker the colour represents a greater change. Significance threshold was set at a log2FC of >0.25 & <−0.25, with a p-value < 0.01. (B). Correlation matrix of significantly altered protein between AKI patients and UHCs. A correlation matrix of the most significantly different proteins (n = 25) between AKI patients (n = 43) and UHCs (n = 100) was produced to highlight proteins that were strongly correlated. Colours on the graph represent the level of correlation, where red shows positive correlation and white shows no correlation. The darker the shade, the stronger the correlation, as can be seen in the colour shade bar below the correlation matrix. The protein quadrant reported in the analysis contains R2 values all greater than 0.8. (C). Volcano plot presenting differential expression analysis of altered proteins in AKI patients compared to UHCs. Volcano plot showing upregulated proteins are represented in red, and proteins that were downregulated are represented in blue, with green labelling indicating whether said protein is differentially expressed in senescence according to transcriptomic analysis of cell senescence. The x-axis on the volcano plot uses log2 (fold change) with the y-axis using −log10 (p-values), with a significance threshold being a log2FC of >0.5 & <−0.5, with a p-value < 0.05. (D). PCA analysis of AKI patients and UHCs. PCA was conducted on all proteomic signatures between AKI patients and UHCs to identify if there was clinical separation (Figure 2D). Each patient’s proteomic profile on the PCA is colour-coded to match their cohort criteria, red for AKI and blue for controls with chronic disease. Using PC1 and PC2 allowed for approximately 40% of variance to be explained and illustrates that there are two distinct groups formed between AKI patients and controls. (E). Violin plots of most significantly altered proteins between AKI patients and UHCs. Violin boxplots visualise individual proteomic differences between AKI patients and UHCs for the top four statistically significant proteins: CKAP4, PTX3, OPN, and IGFBP2 (p < 5.76 × 10⁻¹⁷). Protein expression was measured using NPX (Normalized Protein Expression) which is a log2 transformed metric quantified by OLINK proteomics. (F). Receiver operator curve analysis of the most significantly different proteins; TM, IL-2 and CKAP4, to identify AKI patients from UHC. ROC curves for each protein were generated from univariate SVM models to measure predictive capabilities of each protein. We used the AUC score as a metric to assess predictive accuracy: CKAP4 (AUC: 0.98), PTX3 (AUC: 0.90), IGFBP2 (AUC: 0.92), and OPN (AUC: 0.92).
Figure 2
Figure 2
Senescence Proteins with Significant Differences in their Plasma Concentrations in CKD Patients vs. UHCs. (A). Heatmap of proteins that were significantly altered between CKD patients and UHCs using unsupervised clustering. Heatmap showing unsupervised clustering of the proteins that were significantly altered between CKD patients and UHCs. Clustering was conducted for gender, age, BMI, and cohort on the x-axis with protein clusters shown on the y-axis. Protein change is represented by coloured bars which use the UHC as the reference group. Red represents an upregulation in CKD patients and blue represents a downregulation in the CKD patients. Grey represents missing data. The darker the colour represents a greater change. Significance threshold was set at a log2FC of >0.25 & <−0.25, with a p-value < 0.01. (B). Correlation matrix of significantly altered protein between CKD patients and UHCs. A correlation matrix of significantly different proteins (n = 162) between CKD patients (n = 155) and UHCs (n = 100) was produced to highlight proteins that were strongly correlated. Colours on the graph represent the level of correlation where blue represents a positive correlation and red represents a negative correlation. The darker the shade, the stronger the correlation, as can be seen in the colour shade bar below the correlation matrix. The protein quadrant reported in the analysis contains R2 values all greater than 0.7. (C). Volcano plot presenting differential expression analysis of altered proteins in CKD patients compared to UHCs. Volcano plot showing upregulated proteins represented in red and proteins that were downregulated are represented in blue, with green labelling indicating whether said protein is differentially expressed in senescence according to transcriptomic analysis of cell senescence. The x-axis on the volcano plot uses log2 (fold change) with the y-axis using −log10 (p-values), with a significance threshold being a log2FC of >0.5 & <−0.5, with a p-value < 0.05. (D). PCA analysis of CKD patients and UHCs. Principal component analysis was conducted on all proteomic signatures between CKD patients and UHCs to identify if there was clinical separation. Using PC1 and PC2 allowed for approximately 37% of variance to be explained and illustrates that there are two distinct groups formed between CKD patients and controls. (E). Violin plots of most significantly altered proteins between CKD patients and UHCs. Violin boxplots visualise individual proteomic differences between CKD patients and UHCs for the top four statistically significant proteins: TM, CKAP4, NT3, and MMP7 (p < 1.12 × 10⁻²⁰). Protein expression was measured using NPX (Normalized Protein Expression), which is a log2 transformed metric quantified by OLINK proteomics. (F). Receiver operator curve analysis of the most significantly different proteins; TM, IL-2, and CKAP4, to identify CKD patients from UHC. ROC curves for each protein were retrieved from univariate SVM models to measure predictive capabilities of each protein. We used the area under curve (AUC) as a metric to assess predictive accuracy with: TM (AUC: 0.84), MMP7 (AUC: 0.74), IL2 (AUC: 0.89), and CKAP4 (AUC: 0.83).
Figure 3
Figure 3
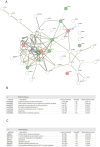
Pathway Analysis of Proteins with Significant Differences in their Plasma Concentrations in AKI Patients vs. UHCs. (A). Protein–Protein interaction network of significant proteins between AKI patients and UHCs. Protein–protein interaction networks generated using stringDB with the input being the corresponding gene symbol for each protein. The network comprises multiple nodes, each being a protein, which are interconnected to other proteins which visualise the interaction. Interactions have been found with literature research, scientific experiments, or data mining. Networks consisted of the top 50 proteins, with the top ten being labelled as green for senescence or red for non-senescence. (B). Enriched KEGG terms between AKI patients and UHCs. Biological enrichment statistics generated on stringDB, which provide the enriched KEGG terms based on specific proteins entered in the network. Count in network provides the number of genes present in the PPI map over the number of genes present in the signaling pathway. Strength provides a numerical value indicative of how strong the relationship between the proteins is, with the higher the number, the more impactful the relationship, and lastly, p-value of the network provides how statistically significant each KEGG pathway is enriched. (C). Enriched WikiPathway terms between AKI patients and UHCs. Biological enrichment statistics generated on stringDB, which provide the enriched WikiPathway terms based on specific proteins entered in the network. Count in network provides the number of genes present in the PPI map over the number of genes present in the signaling pathway. Strength provides a numerical value indicative of how strong the relationship between the proteins is, with the higher the number, the more impactful the relationship, and lastly, p-value of the network provides how statistically significant each WikiPathway pathway is enriched.
Figure 4
Figure 4
Pathway Analysis of Proteins with Significant Differences in their Plasma Concentrations in CKD Patients vs. UHCs. (A). Protein–Protein interaction network of significant proteins between CKD patients and UHCs. Protein–protein interaction networks generated using stringDB with the input being the corresponding gene symbol for each protein. The network comprises multiple nodes, each being a protein, which are interconnected to other proteins which visualise the interaction. Interactions have been found with literature research, scientific experiments, or data mining. Networks consisted of the top 50 proteins, with the top ten being labelled as green for senescence or red for non-senescence. (B). Enriched KEGG terms between CKD patients and UHCs. Biological enrichment statistics generated on stringDB, which provide the enriched KEGG terms based on specific proteins entered in the network. Count in network provides the number of genes present in the PPI map over the number of genes present in the signaling pathway. Strength provides a numerical value indicative of how strong the relationship between the proteins is, with the higher the number, the more impactful the relationship, and lastly, p-value of the network provides how statistically significant each KEGG pathway is enriched. (C). Enriched WikiPathway terms between CKD patients and UHCs. Biological enrichment statistics generated on stringDB, which provide the enriched WikiPathway terms based on specific proteins entered in the network. Count in network provides the number of genes present in the PPI map over the number of genes present in the signaling pathway. Strength provides a numerical value indicative of how strong the relationship between the proteins is, with the higher the number, the more impactful the relationship, and lastly, p-value of the network provides how statistically significant each WikiPathway pathway is enriched.

References

    1. Lankadeva Y.R., Kosaka J., Evans R.G., Bailey S.R., Bellomo R., May C.N. Intrarenal and urinary oxygenation during norepinephrine resuscitation in ovine septic acute kidney injury. Kidney Int. 2016;90:100–108. doi: 10.1016/j.kint.2016.02.017. - DOI - PubMed
    1. Levey A.S., Coresh J. Chronic kidney disease. Lancet. 2012;379:165–180. doi: 10.1016/S0140-6736(11)60178-5. - DOI - PubMed
    1. Luyckx V.A., Cherney D.Z.I., Bello A.K. Preventing CKD in Developed Countries. Kidney Int. Rep. 2020;5:263–277. doi: 10.1016/j.ekir.2019.12.003. - DOI - PMC - PubMed
    1. Sato Y., Takahashi M., Yanagita M. Pathophysiology of AKI to CKD progression. Semin. Nephrol. 2020;40:206–215. doi: 10.1016/j.semnephrol.2020.01.011. - DOI - PubMed
    1. Webster A.C., Nagler E.V., Morton R.L., Masson P. Chronic Kidney Disease. Lancet. 2017;389:1238–1252. doi: 10.1016/S0140-6736(16)32064-5. - DOI - PubMed

Publication types

LinkOut - more resources