. 2024 Sep 30;13(19):1633.
doi: 10.3390/cells13191633.

Novel Fluorescence-Based Methods to Determine Infarct and Scar Size in Murine Models of Reperfused Myocardial Infarction

Affiliations

Novel Fluorescence-Based Methods to Determine Infarct and Scar Size in Murine Models of Reperfused Myocardial Infarction

Ashley Duplessis et al. Cells. .

Abstract

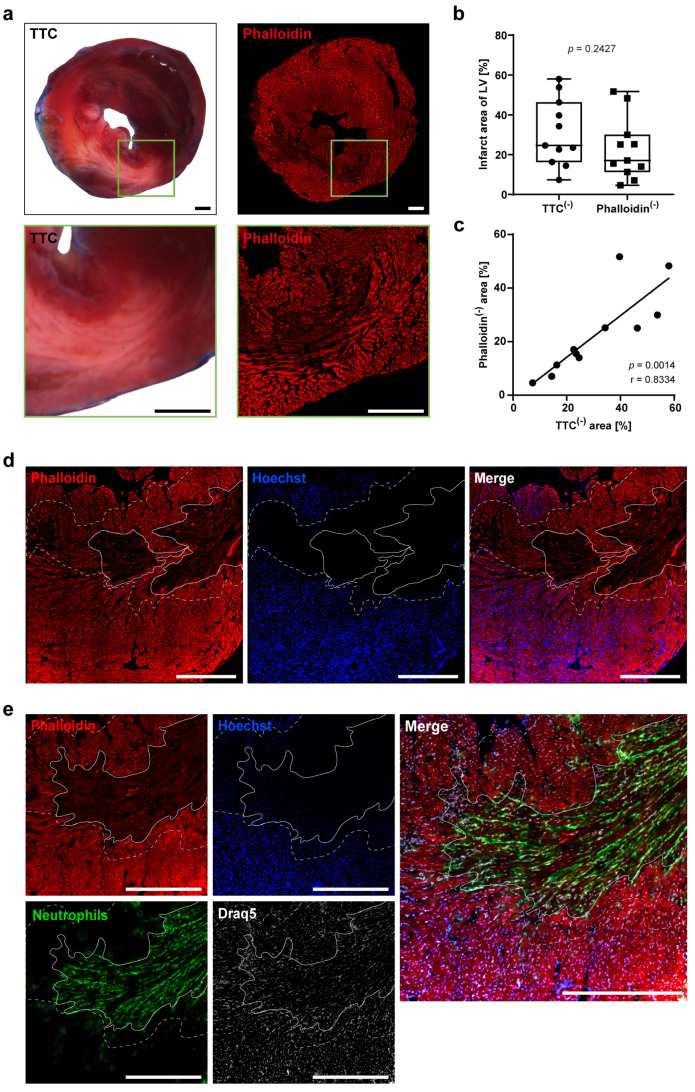
Determination of infarct and scar size following myocardial infarction (MI) is commonly used to evaluate the efficacy of potential cardioprotective treatments in animal models. However, histological methods to determine morphological features in the infarcted heart have barely improved since implementation while still consuming large parts of the tissue and offering little options for parallel analyses. We aim to develop a new fluorescence technology for determining infarct area and area at risk that is comparable to 2,3,5-triphenyltetrazolium chloride (TTC) staining but allows for multiple analyses on the same heart tissue. For early and late time points following MI, we compared classical histochemical approaches with fluorescence staining methods. Reperfused MI was induced in male mice, the hearts were extracted 24 h, 7-, 21-, or 28-days later and fluorescently stained by combining Hoechst and phalloidin. This approach allowed for clear visualization of the infarct area, the area at ischemic risk and the remote area not affected by MI. The combined fluorescence staining correlated with the classic TTC/Evans Blue staining 24 h after MI (r = 0.8334). In later phases (>7 d) post-MI, wheat germ agglutinin (WGA) is equally accurate as classical Sirius Red (r = 0.9752), Masson's (r = 0.9920) and Gomori's Trichrome (r = 0.8082) staining for determination of scar size. Additionally, feasibility to co-localize fluorescence-stained immune cells in specific regions of the infarcted myocardium was demonstrated with this protocol. In conclusion, this new procedure for determination of post-MI infarct size is not inferior to classical TTC staining, yet provides substantial benefits, including the option for unbiased software-assisted analysis while sparing ample residual tissue for additional analyses. Overall, this enhances the data quality and reduces the required animal numbers consistent with the 3R concept of animal experimentation.

Keywords: 3R; histology; infarct size; myocardial infarction; scar size.


Conflict of interest statement

The authors declare no conflicts of interest.

Figures

Figure 1
Figure 1
Workflows for infarct analysis procedures. (a) Workflow for TTC and Evans Blue staining procedure. After functional anesthesia, the heart is excised and fat and surrounding tissue are removed. The suture that was placed during the surgically induced MI is replaced with a silk suture to prevent loosening during the staining procedure. The heart is hung onto a cannula by the aorta and rinsed with NaCl before being stained with Evans Blue solution. Frozen tissue sections (approx. 1 mm) are cut from the apex to the base of the heart and stained with TTC solution. After staining, the sections are imaged by light microscopy and analyzed. (b) Workflow for phalloidin staining procedure. After functional anesthesia, the heart is excised and fat and surrounding tissue are removed. The heart is rinsed with ice-cold PBS and fixed 1 h in 4% PFA. The suture that was placed during the surgically induced MI is replaced with a silk suture to prevent loosening during the staining procedure. The heart is stained with Hoechst to identify the area at risk. Following a dehydration step in sucrose solution, tissue is embedded in Tissue-Tek® O.C.T.™ Compound and deep frozen at −80 °C. Cryo-sectioning is performed, and the tissue sections are stained with phalloidin. After staining, the sections are imaged by fluorescence microscopy and analyzed. Created in BioRender. Elster, C. BioRender.com/c54f420 (2023) and BioRender.com/m01f052 (2024).
Figure 2
Figure 2
Comparable infarct sizes determined by TTC- and phalloidin staining 24 h after experimental MI. (a) The same section of an infarcted heart 24 h after MI was stained with TTC (left) and with phalloidin (right). Absence of phalloidin staining indicated infarct area and corresponds to the white area in TTC staining. The enlarged image section is marked by a green field. (b) Boxplot displaying infarct size per left ventricle (LV) determined by TTC- and phalloidin staining (n = 11; unpaired t test, p = 0.2427). (c) Pearson correlation of infarct size between TTC and phalloidin staining (n = 11; p = 0.0014). (d) Staining of Hoechst and phalloidin shows the infarct (solid line, phalloidin(−); Hoechst(−)) and viable tissue within the area at risk (between closed and dotted line phalloidin(+);Hoechst(−)). Double positive signal reflects viable tissue outside the area at risk not affected by ischemia. (e) Co-staining of infarct area with immune cells. Neutrophils (Ly6G(+), green) within the infarct zone (phalloidin(−);Hoechst(−)). Nuclei were stained with Draq5™. Scale bar 500 µm.
Figure 3
Figure 3
WGA staining reliably determined scar size following MI. (a) Consecutive infarcted heart sections 21 d after MI were stained with WGA, Sirius Red, Masson’s Trichrome or Gomori’s Trichrome. WGA-positive area is identical to scar tissue detected in classical staining. (b) Statistical analysis showed no difference in scar size between the different methods of staining (n = 5 for each staining, one-way ANOVA with multiple comparisons, p = 0.9413). (c) WGA scar size shows a strong correlation with Sirius Red, Masson’s and Gomori’s Trichrome scar size respectively. (n = 5) (d) Immunofluorescent co-staining of leukocytes (CD45, red) within scar region (WGA positive, green) of infarcted heart (d28). Nuclei were stained with DAPI. Scale bar 500 µm. Scale bar close-up 50 µm.
Figure 4
Figure 4
WGA staining is more suitable than phalloidin for measuring scar size at late time points after MI. Mice underwent reperfused MI and were euthanized 7 or 28 days later. (a) Localization of phalloidin (red) and WGA (green) shows no complete overlap of WGA-positive and phalloidin-negative area on day 7 after MI. (b) At intermediate time points (day 7) after MI, the phalloidin-negative area (infarct area) is larger than the WGA-positive area (scar area). However, this difference is not significant, as determined by comparison of area under the curve (AUC) with an unpaired t-test (n = 4; p = 0.6418). (c) Pearson correlation of phalloidin-negative and WGA-positive signal in individual mice confirms a low overlap (n = 20; p = 0.9345). (d) Localization of WGA (green) and phalloidin (red) on day 28 after MI shows distinct overlap of WGA positive (scar) and phalloidin-negative (infarct) area, with scar tissue permeating deeper into the healthy tissue. (e) At late time points (day 28) after MI the WGA-positive area (scar area) is significantly larger than the phalloidin-negative area (infarct area). Significance was determined by calculating AUC and running an unpaired t-test (n = 6; p = 0.0214). (f) Pearson correlation of phalloidin-negative and WGA positive signal shows a strong overlap of signals (n = 19; p < 0.0001). Scale bar refers to 500 µm in all panels.

References

    1. Roth G.A., Mensah G.A., Johnson C.O., Addolorato G., Ammirati E., Baddour L.M., Barengo N.C., Beaton A.Z., Benjamin E.J., Benziger C.P., et al. Global Burden of Cardiovascular Diseases and Risk Factors, 1990–2019: Update From the GBD 2019 Study. J. Am. Coll. Cardiol. 2020;76:2982–3021. doi: 10.1016/j.jacc.2020.11.010. - DOI - PMC - PubMed
    1. Takagawa J., Zhang Y., Wong M.L., Sievers R.E., Kapasi N.K., Wang Y., Yeghiazarians Y., Lee R.J., Grossman W., Springer M.L. Myocardial infarct size measurement in the mouse chronic infarction model: Comparison of area- and length-based approaches. J. Appl. Physiol. 2007;102:2104–2111. doi: 10.1152/japplphysiol.00033.2007. - DOI - PMC - PubMed
    1. Michael L.H., Ballantyne C.M., Zachariah J.P., Gould K.E., Pocius J.S., Taffet G.E., Hartley C.J., Pham T.T., Daniel S.L., Funk E., et al. Myocardial infarction and remodeling in mice: Effect of reperfusion. Am. J. Physiol. 1999;277:H660–H668. doi: 10.1152/ajpheart.1999.277.2.H660. - DOI - PubMed
    1. Fishbein M.C., Meerbaum S., Rit J., Lando U., Kanmatsuse K., Mercier J.C., Corday E., Ganz W. Early phase acute myocardial infarct size quantification: Validation of the triphenyl tetrazolium chloride tissue enzyme staining technique. Am. Heart J. 1981;101:593–600. doi: 10.1016/0002-8703(81)90226-X. - DOI - PubMed
    1. Redfors B., Shao Y., Omerovic E. Myocardial infarct size and area at risk assessment in mice. Exp. Clin. Cardiol. 2012;17:268–272. - PMC - PubMed

Publication types