. 2024 Oct 4;13(19):1652.
doi: 10.3390/cells13191652.

The Neolignan Honokiol and Its Synthetic Derivative Honokiol Hexafluoro Reduce Neuroinflammation and Cellular Senescence in Microglia Cells

Affiliations

The Neolignan Honokiol and Its Synthetic Derivative Honokiol Hexafluoro Reduce Neuroinflammation and Cellular Senescence in Microglia Cells

Chiara Sasia et al. Cells. .

Abstract

Microglia-mediated neuroinflammation has been linked to neurodegenerative disorders. Inflammation and aging contribute to microglial senescence. Microglial senescence promotes the development of neurodegenerative disorders, including Alzheimer's disease (AD). In this study, we investigated the anti-neuroinflammatory and anti-senescence activity of Honokiol (HNK), a polyphenolic neolignane from Magnolia officinalis Rehder & E.H Wilson, in comparison with its synthetic analogue Honokiol Hexafluoro (CH). HNK reduced the pro-inflammatory cell morphology of LPS-stimulated BV2 microglia cells and increased the expression of the anti-inflammatory cytokine IL-10 with an efficacy comparable to CH. HNK and CH were also able to attenuate the alterations in cell morphology associated with cellular senescence in BV2 cells intermittently stimulated with LPS and significantly reduce the activity and expression of the senescence marker ß-galactosidase and the expression of p21 and pERK1/2. The treatments reduced the expression of senescence-associated secretory phenotype (SASP) factors IL-1ß and NF-kB, decreased ROS production, and abolished H2AX over phosphorylation (γ-H2AX) and acetylated H3 overexpression. Senescent microglia cells showed an increased expression of the Notch ligand Jagged1 that was reduced by HNK and CH with a comparable efficacy to the Notch inhibitor DAPT. Overall, our data illustrate a protective activity of HNK and CH on neuroinflammation and cellular senescence in microglia cells involving a Notch-signaling-mediated mechanism and suggesting a potential therapeutic contribution in aging-related neurodegenerative diseases.

Keywords: Claisened Hexafluoro; Honokiol; Notch signaling; cellular senescence; microglia; neuroinflammation.


Conflict of interest statement

The authors declare no conflicts of interest.

Figures

Figure 1
Figure 1
Effect of CH in an in vitro model of neuroinflammation. (A) Lack of effect of cell viability by CH (1–10 µM), HNK (1–10 µM), and the reference drug rosmarinic acid (RA; 1 µM) on BV2 cells using the SRB colorimetric assay. (B) Reversal by CH and HNK treatment (0.1–10 µM) of the reduction in cell viability induced by LPS 250 ng/mL. RA (1 µM) was used as reference drug. (C) Representative images of CTRL and LPS-stimulated BV2 cells (SRB assay), bar 30 μm. (D) Reduction in the number of BV2 cells in the pro-inflammatory state after LPS stimulation by CH and HNK (10 µM). (E) Representative images of CH- and HNK-treated LPS-stimulated BV2 cells. (F) CH and HNK (10 µM) reduced the increase in the cell surface induced by LPS stimulation, bar 20 μm. (G) Redistribution of BV2 cell subpopulation by cell surface area after 24 h LPS stimulation in the presence or absence of CH and HNK. Cells were classified as either small (<200 µm2), mid-sized (200–400 µm2), or large (>400 µm2). (H) Effect of CH and HNK on LPS-induced variation of the percentage of distribution of small, mid-sized, and big cells. (I) Reduction in protein expression of the anti-inflammatory cytokine IL10 by LPS and reversal by treatments with CH and HNK (10 µM). Three independent experiments were carried out to evaluate the effects of treatments. * p < 0.05, ** p < 0.01, *** p < 0.001, **** p < 0.0001 vs. LPS; °° p < 0.01, °°° p < 0.001, °°°° p < 0.0001 vs. CTRL.
Figure 2
Figure 2
Effect of CH and HNK on the cell morphology of senescent BV2 cells. (A) Schematic representation of the experimental protocol. (B) Reduction in the percentage of BV2 cells in the pro-inflammatory state by CH and HNK (0.1–10 µM). (C) Reduction in the senescent BV2 cell surface area by CH and HNK (0.1–10 µM). (D) Representative images of CH- and HNK-treated senescent cells, bar 30 μm. (E) Scatter plot of redistribution of the senescent BV2 cell subpopulation by cell surface area after LPS intermittent stimulation in the presence or absence of CH and HNK. Cells were classified as either small (<200 µm2), mid-sized (200–400 µm2), or large (>400 µm2). (F) Effect of CH (3 µM) and HNK (3 µM) on LPS-induced variation in the percentage of distribution of small, mid-sized, and big cells. Three independent experiments were carried out to evaluate the effects of treatments. One-way ANOVA: °°° p < 0.001, °°°° p < 0.0001 vs. CTRL; * p < 0.05, ** p < 0.01, *** p < 0.001, **** p < 0.0001 vs. LPS.
Figure 3
Figure 3
Effect of CH and HNK on cellular senescence markers. Intermittent stimulation with LPS at 500 ng/mL for 10 days increased both the protein expression (A) and activity (B) of ß-galactosidase in the cell lysate. Treatment with CH and HNK (0.1–10 µM) was effective in reducing both parameters. (C) Quantification analysis of ß-galactosidase staining after LPS stimulation and effect produced by CH and HNK (3 µM). RA (1 µM) was used as the reference drug. Representative images are reported at the bottom of the figure, bar 30 µm. One-way ANOVA: ° p < 0.05, °° p < 0.01, °°° p < 0.001, °°°° p < 0.0001 vs. CTRL; * p < 0.05, ** p < 0.01, *** p < 0.001, **** p < 0.0001 vs. LPS. Effect of LPS, CH, and HNK treatment on p21 (D) and p44/42 (E) expression level. Actin was used as the loading control. Three independent experiments were carried out to evaluate the effects of treatments. Representative blots are reported in the figure.
Figure 4
Figure 4
Anti-SASP activity of CH and HNK. (AB) IL6 and IL1β mRNA levels in BV2 cells treated with LPS in the presence or absence of CH and HNK. Data are represented as fold change normalized to the mean expression of control (n = 3). One−way ANOVA: ° p < 0.05 vs. CTRL; * p < 0.05 vs. LPS. (C) CH and HNK (0.1–10 µM) restored the levels of cytosolic NF−kBp65 that were drastically reduced in senescent cells. °° p < 0.01 vs. CTRL; ** p < 0.01 vs. LPS. (D) The CH and HNK reduction of IKBα increased the expression induced by LP stimulation. Actin was used as the loading control. Western blot and the relative quantification are shown. (E) Effect of LPS, CH, and HNK treatment on total ROS production. The measurement was performed by incubating cells with an H2DCF-DA probe. Data were normalized on protein total content (n = 3). One-way ANOVA: °°° p < 0.001 vs. CTRL; *** p < 0.001 vs. LPS. (F) H2AX phosphorylation levels in BV2 cells stimulated with LPS in the presence or absence of CH and HNK. Actin and H2AX were used as the loading control (n = 3). Western blot and the γH2AX/H2AX ratio quantification are shown: ° p < 0.05,°° p< 0.01, °°° p < 0.001, °°°° p < 0.0001 vs. CTRL; ** p < 0.01 vs. LPS. (G) Reduction by CH and HNK (0.1–10 µM) of AcH3 increased the expression induced by intermittent LPS stimulation. (H) Representative images of CH- and HNK-treated LPS-stimulated cells stained with DAPI (nuclei) and AcH3, bar 20 µm. (I) The CH and HNK (3 µM) reduction of LPS-induced AcH3 increased expression and representative blot. * p < 0.5, ** p < 0.01, **** p < 0.0001.
Figure 5
Figure 5
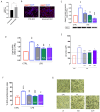
Effect of CH and HNK on Jagged-1 expression in BV2 senescent cells. Increase in Jagged-1 protein expression (A) and immunostaining (B) in LPS-stimulated senescent BV2 cells compared to unstimulated CTRL cells, bar 20 µm. (C) Reduction by CH and HNK (3 µM) of Jagged-1 increased expression in senescent BV2 cells. DAPT was used as a reference drug. (D) Attenuation of the ß-galactosidase (ß-gal) activity by CH, HNK, and DAPT. Reduction by CH and HNK of the cell surface area (E) and number of BV2 cells in the pro-inflammatory state (H). (G) Representative images of CH- and HNK-treated LPS-stimulated cells, bar 30 μm. * p < 0.05, ** p < 0.01, *** p < 0.001, **** p < 0.0001 vs. LPS; °° p < 0.01, °°° p < 0.001, °°°° p < 0.0001 vs. CTRL (one-way ANOVA).

References

    1. López-Otín C., Blasco M.A., Partridge L., Serrano M., Kroemer G. Hallmarks of Aging: An Expanding Universe. Cell. 2023;186:243–278. doi: 10.1016/j.cell.2022.11.001. - DOI - PubMed
    1. Zhang L., Pitcher L.E., Yousefzadeh M.J., Niedernhofer L.J., Robbins P.D., Zhu Y. Cellular Senescence: A Key Therapeutic Target in Aging and Diseases. J. Clin. Investig. 2022;132:e158450. doi: 10.1172/JCI158450. - DOI - PMC - PubMed
    1. Holloway K., Neherin K., Dam K.U., Zhang H. Cellular Senescence and Neurodegeneration. Hum. Genet. 2023;142:1247–1262. doi: 10.1007/s00439-023-02565-x. - DOI - PubMed
    1. Sahu M.R., Rani L., Subba R., Mondal A.C. Cellular Senescence in the Aging Brain: A Promising Target for Neurodegenerative Diseases. Mech. Ageing Dev. 2022;204:111675. doi: 10.1016/j.mad.2022.111675. - DOI - PubMed
    1. Hickman S., Izzy S., Sen P., Morsett L., El Khoury J. Microglia in Neurodegeneration. Nat. Neurosci. 2018;21:1359–1369. doi: 10.1038/s41593-018-0242-x. - DOI - PMC - PubMed

Publication types

MeSH terms

LinkOut - more resources