. 2024 Oct 9;13(19):1667.
doi: 10.3390/cells13191667.

Employing Multi-Omics Analyses to Understand Changes during Kidney Development in Perinatal Interleukin-6 Animal Model

Affiliations

Employing Multi-Omics Analyses to Understand Changes during Kidney Development in Perinatal Interleukin-6 Animal Model

Ganesh Panzade et al. Cells. .

Abstract

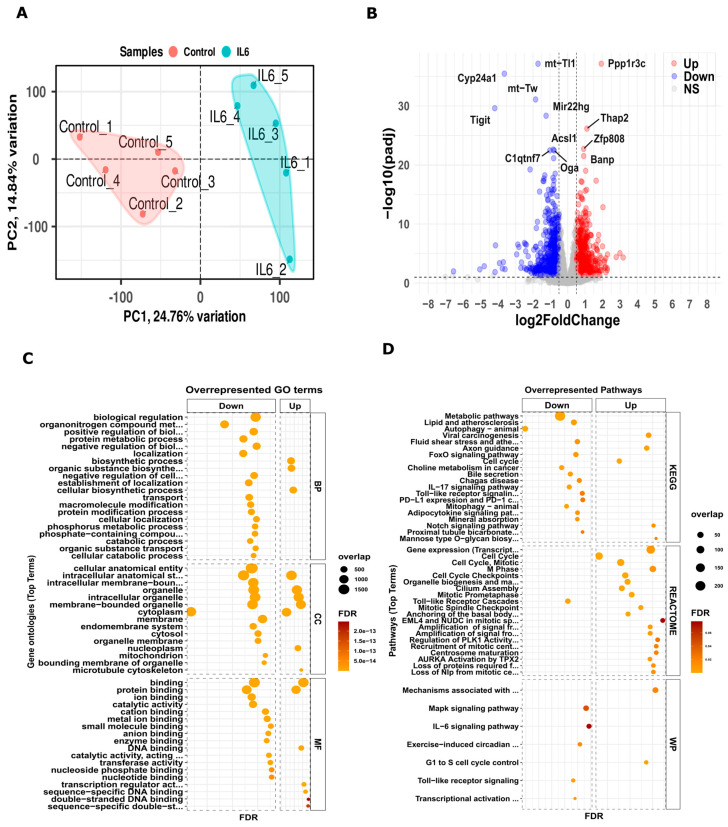
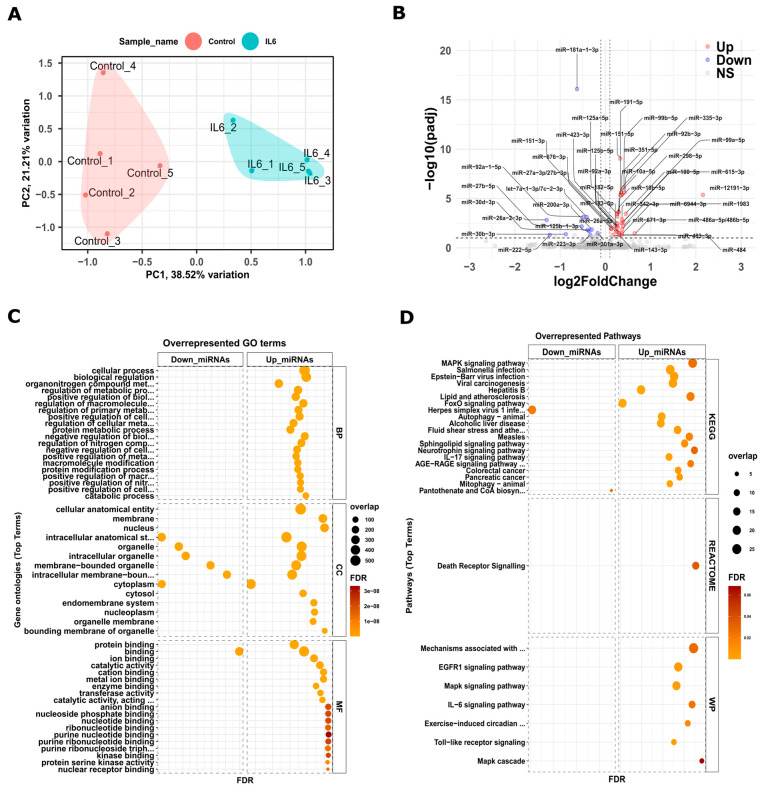
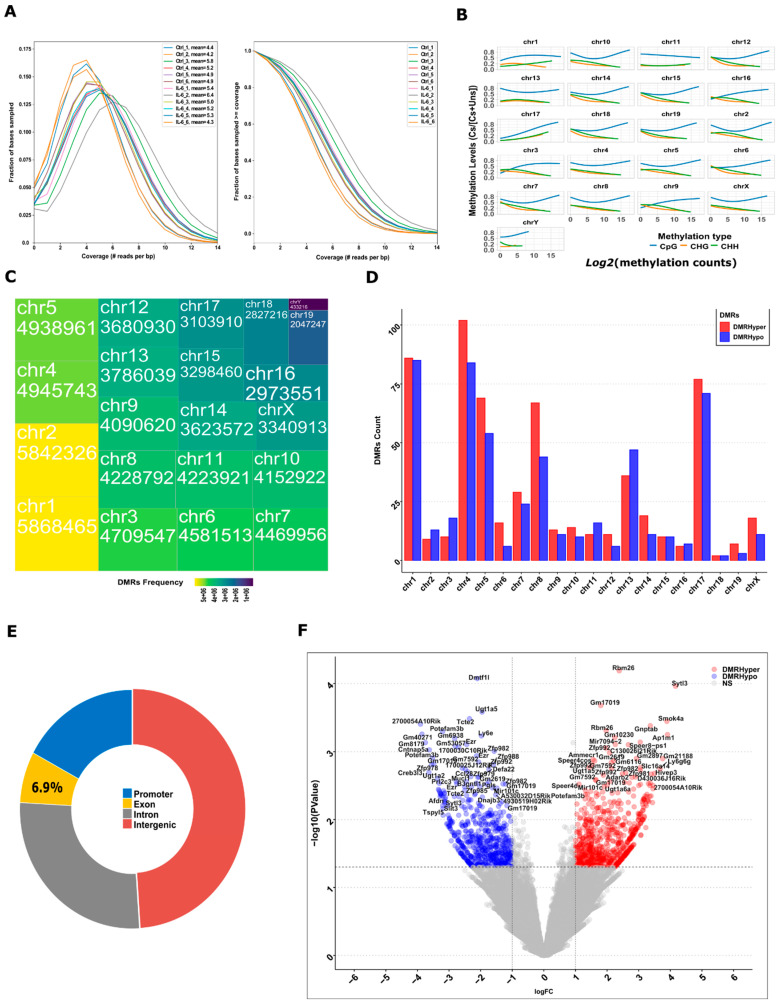
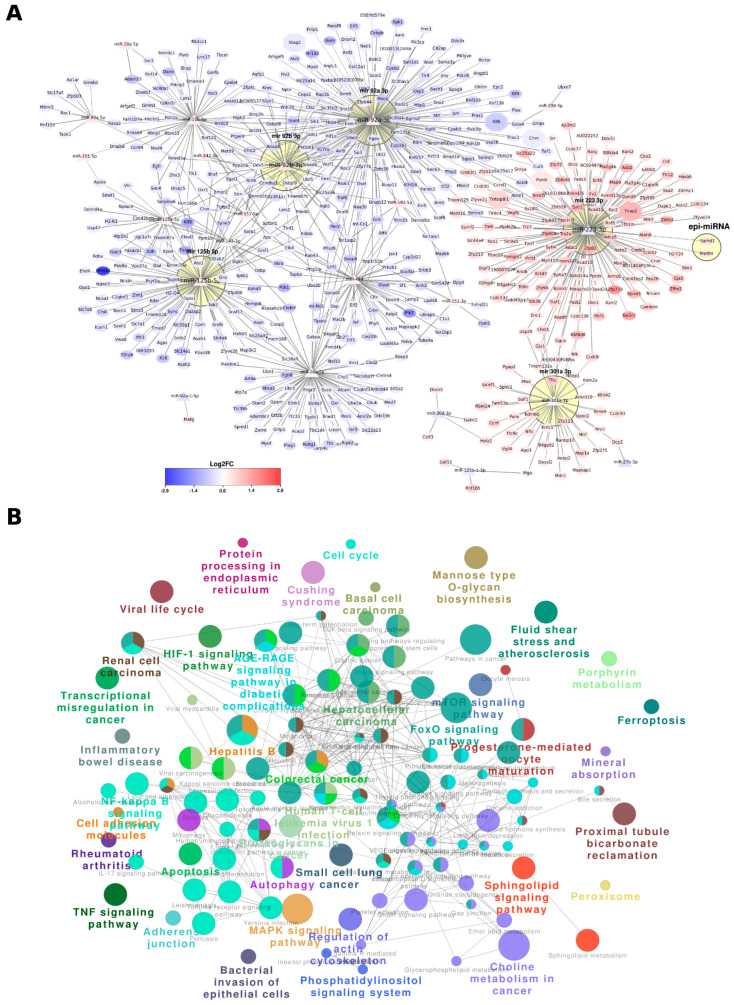
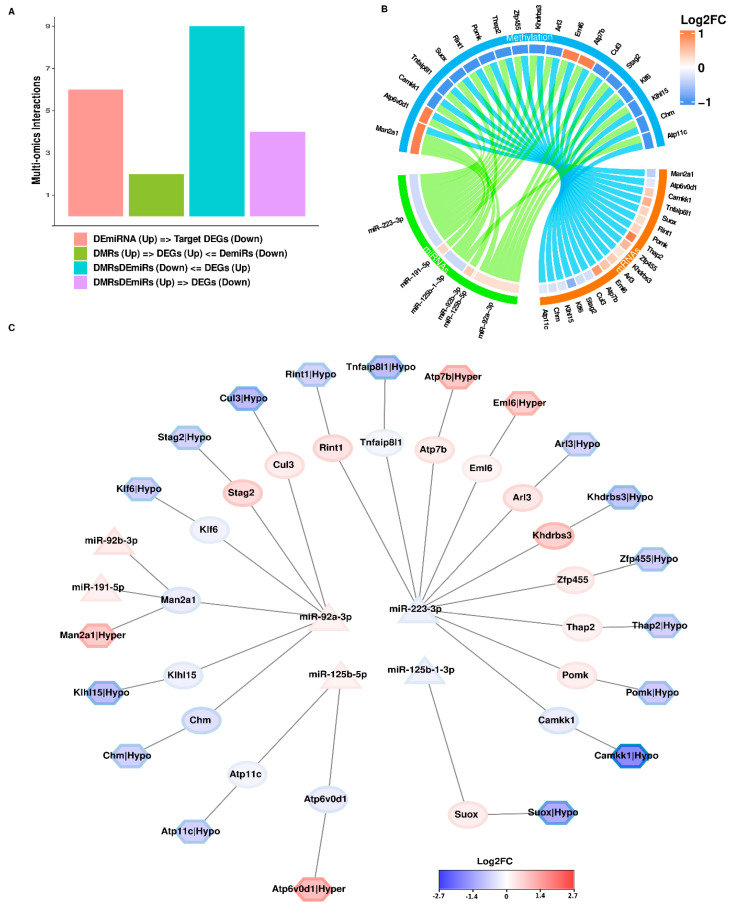
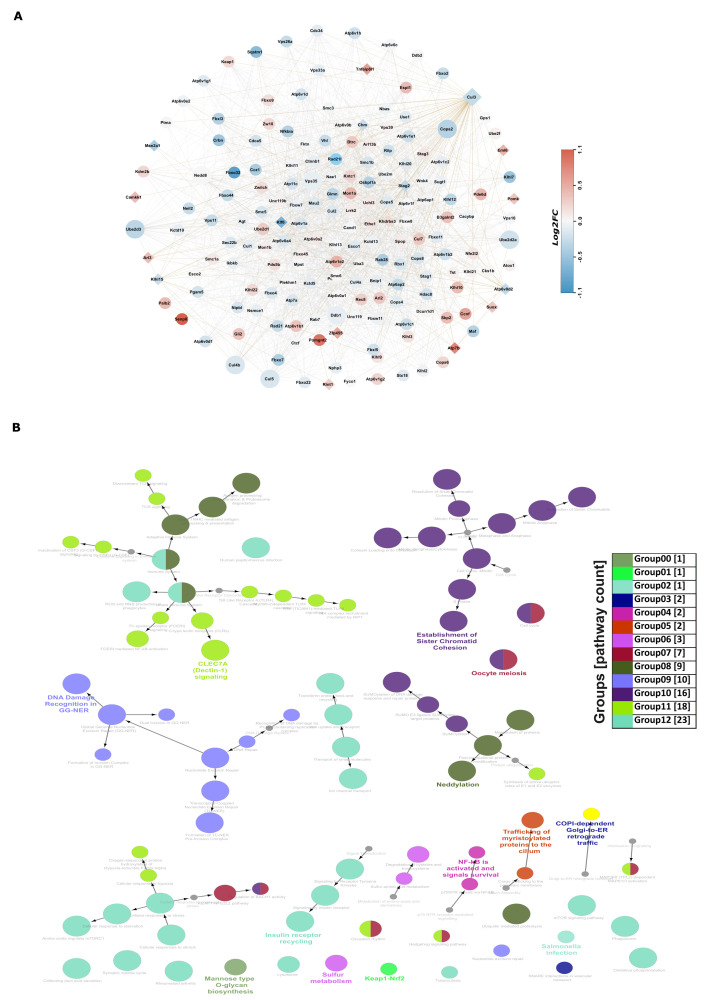
Chronic kidney disease (CKD) is a leading cause of morbidity and mortality globally. Maternal obesity during pregnancy is linked to systemic inflammation and elevated levels of the pro-inflammatory cytokine interleukin-6 (IL-6). In our previous work, we demonstrated that increased maternal IL-6 during gestation impacts intrauterine development in mice. We hypothesized that IL-6-induced inflammation alters gene expression in the developing fetus. To test this, pregnant mice were administered IL-6 or saline during mid-gestation. Newborn mouse kidneys were analyzed using mRNA-seq, miRNA-seq and whole-genome bisulfite-seq (WGBS). A multi-omics approach was employed to quantify mRNA gene expression, miRNA expression and DNA methylation, using advanced bioinformatics and data integration techniques. Our analysis identified 19 key genes present in multiple omics datasets, regulated by epigenetics and miRNAs. We constructed a regulatory network for these genes, revealing disruptions in pathways such as Mannose type O-glycan biosynthesis, the cell cycle, apoptosis and FoxO signaling. Notably, the Atp7b gene was regulated by DNA methylation and miR-223 targeting, whereas the Man2a1 gene was controlled by DNA methylation affecting energy metabolism. These findings suggest that these genes may play a role in fetal programming, potentially leading to CKD later in life due to gestational inflammation.

Keywords: chronic kidney disease (CKD); co-expression; epigenetics; interleukin-6 (IL-6); miRNA regulation; multi-omics.


Conflict of interest statement

The authors have declared no conflicts of interest.

Figures

Figure 1
Figure 1
Differentially expressed genes in the transcriptome of kidneys from neonatal pups exposed to IL-6 during development. (A) PCA between control and IL-6 samples with the first principal component (PC1) on the x-axis and the second (PC2) on the y-axis. (B) Volcano plot with log2FC on the x-axis and p-value on the y-axis. The red and blue colors denote the altered genes with a one-fold change cutoff of differentially expressed genes. Additionally, (C) shows a gene enrichment plot highlighting significantly overrepresented GO terms with an FDR of ≤0.05, while (D) focuses on enriched pathways from KEGG, Reactome, and Wiki pathways.
Figure 2
Figure 2
Differentially expressed miRNAs in kidneys from neonatal pups exposed to IL-6 during development. (A) PCA between control and IL-6 samples with the first principal component (PC1) on the x-axis, whereas the second (PC2) y-axis from miRNAs log-transformed counts. (B) Volcano plot with log2FC on the x-axis and p-value on the y-axis. The red and blue colors denote the altered genes with a one-fold change cutoff of differentially expressed miRNAs (DEmiRs). The upregulated miRNAs are denoted with red dots and downregulated with blue dots. The gray dots are not significant. Additionally, (C) shows a gene enrichment plot highlighting overrepresented GO terms with an FDR of ≤0.05 for downregulated and upregulated miRNAs, while (D) focuses on enriched pathways from KEGG, Reactome and Wiki pathways.
Figure 3
Figure 3
Genome-wide methylation analysis of kidneys from neonatal pups exposed to IL-6 during development. (A) Genome-wide coverage of methylated reads per sampled bases. (B) Global- and chromosome-wise count of methylated bases in the genome based on the methylation CpG, CHG, and CHH levels ranges between 0.0 and 1.0 and methylation counts. Chromosome-wide coverage of CpG, CHG and CHH methylation. (C) Distribution of methylated bases count across the chromosomes in genome. (D) Distribution of DMRs based on their methylated categories across the individual mouse chromosome. Distribution of DMRs based on their methylated categories across the chromosome. (E) Classification of DMRs based on their chromosomal locations as intergenic and intragenic. Gene enrichment plot for differential methylated genes of promoter and gene body regions. (F) Volcano plot of differentially methylated bases in IL-6. The red and blue dots are for hypermethylated and hypomethylated bases, respectively based on 2-fold change and p-value < 0.05.
Figure 4
Figure 4
miRNA regulatory network: (A) a regulatory network of miRNAs was constructed based on multi-omics analysis with target genes, using anti-correlation. Triangle-shaped nodes represent miRNAs, hexagonal shapes represent genes that overlap with a set of 19 genes, and circles represent other target genes. The miRNA clusters were annotated with yellow circles, and the color scale was based on Log2FC values from differential expressions. (B) A miRNA-regulated functional network was created from ClueGo analysis for KEGG and Reactome pathways, with a statistical significance of p-value < 0.05. Each cluster within the network was filled with multiple specific colors representing the biological function, with shared functionality represented by multiple colors for the node.
Figure 5
Figure 5
Integration of omics data. Comparative analysis of IL-6 treatment effects from three sets of sequencing data. (A) A summary of multi-omics datasets together with differential methylated/expressed interactions between genes and their associated methylation level and miRNAs. The x-axis denotes types of regulatory interactions, and the y-axis is a calculated percentage of contributing interactions in the total dataset. (B) A circular plot for the multi-omics differential methylated expressed genes and miRNAs with log2FC value. (C) A regulatory network was constructed of regulatory interactions after the integration of their differential status. The hexagonal shape of nodes denotes the differentially methylated genes (promoter-based), rectangular shape for DEGs, and triangular shape for DemiRs.
Figure 6
Figure 6
Functional protein–protein network of 19 genes from multi-omics. (A) A PPI network was constructed up to 2 layers for the 19 genes, with diamond-shaped nodes denoting the genes that are part of the multi-omics set and circle nodes for PPIs connected to them. The red and blue color scale was based on the differential expression of genes from RNA-seq, while the size of the nodes was based on the number of out-connections. (B) A directional functional enrichment network was created for the PPI network using KEGG and Reactome pathways from ClueGO. Shared nodes were divided into half circles, colored, and arrows were used to denote the directions of the function. The size of nodes for a particular function was based on the number of involved genes.
Figure 7
Figure 7
Immunofluorescence microscopy of fetal mouse kidney at birth from pups born to mothers exposed to IL-6, n = 5 or saline (control, n = 5). Immunofluorescence staining for staining results for Man2a1 (Mannosidase 2 alpha 1), Klhl15 (Kelch-like 15), Khdrbs3 (KH domain containing RNA binding signal transduction associated 3), Atp11c (ATPase class VI type 11C), and ADP-ribosylation factor-like 3 (Arl3) are shown in the following panel. Glomeruli are stained for podocalyxin (green fluorescence), while Man2a1, Klhl15, Khdrbs3, Atp11c, and Arl3 are stained with red fluorescence. The podocalyxin staining for Man2a1 was not performed because both the primary antibodies were from goat. All confocal images were taken at fixed acquisition settings. Boxplots show fluorescence intensity analysis with median and box representing interquartile range (25th to 75th percentile), and 95% of data were within limits of whiskers. Wilcoxon–Mann–Whitney tests were conducted to assess differences between the two groups.

Similar articles

References

    1. Iseki K., Ikemiya Y., Kinjo K., Inoue T., Iseki C., Takishita S. Body Mass Index and the Risk of Development of End-Stage Renal Disease in a Screened Cohort. Kidney Int. 2004;65:1870–1876. doi: 10.1111/j.1523-1755.2004.00582.x. - DOI - PubMed
    1. Hall J.E., Crook E.D., Jones D.W., Wofford M.R., Dubbert P.M. Mechanisms of Obesity-Associated Cardiovascular and Renal Disease. Am. J. Med. Sci. 2002;324:127–133. doi: 10.1097/00000441-200209000-00003. - DOI - PubMed
    1. Lee Y.Q., Lumbers E.R., Oldmeadow C., Collins C.E., Johnson V., Keogh L., Sutherland K., Gordon A., Smith R., Rae K.M., et al. The Relationship between Maternal Adiposity during Pregnancy and Fetal Kidney Development and Kidney Function in Infants: The Gomeroi Gaaynggal Study. Physiol. Rep. 2019;7:e14227. doi: 10.14814/phy2.14227. - DOI - PMC - PubMed
    1. Macumber I., Schwartz S., Leca N. Maternal Obesity Is Associated with Congenital Anomalies of the Kidney and Urinary Tract in Offspring. Pediatr. Nephrol. 2017;32:635–642. doi: 10.1007/s00467-016-3543-x. - DOI - PubMed
    1. Honein M.A., Moore C.A., Watkins M.L. Subfertility and Prepregnancy Overweight/Obesity: Possible Interaction between These Risk Factors in the Etiology of Congenital Renal Anomalies. Birth Defects Res. A Clin. Mol. Teratol. 2003;67:572–577. doi: 10.1002/bdra.10077. - DOI - PubMed

Publication types

LinkOut - more resources