Multicenter Study
. 2024 Oct;313(1):e240137.
doi: 10.1148/radiol.240137.

Prediction of Ischemic Stroke Functional Outcomes from Acute-Phase Noncontrast CT and Clinical Information

Affiliations
Multicenter Study

Prediction of Ischemic Stroke Functional Outcomes from Acute-Phase Noncontrast CT and Clinical Information

Yongkai Liu et al. Radiology. 2024 Oct.

Abstract

Background Clinical outcome prediction based on acute-phase ischemic stroke data is valuable for planning health care resources, designing clinical trials, and setting patient expectations. Existing methods require individualized features and often involve manually engineered, time-consuming postprocessing activities. Purpose To predict the 90-day modified Rankin Scale (mRS) score with a deep learning (DL) model fusing noncontrast-enhanced CT (NCCT) and clinical information from the acute phase of stroke. Materials and Methods This retrospective study included data from six patient datasets from four multicenter trials and two registries. The DL-based imaging and clinical model was trained by using NCCT data obtained 1-7 days after baseline imaging and clinical data (age; sex; baseline and 24-hour National Institutes of Health Stroke Scale scores; and history of hypertension, diabetes, and atrial fibrillation). This model was compared with models based on either NCCT or clinical information alone. Model-specific mRS score prediction accuracy, mRS score accuracy within 1 point of the actual mRS score, mean absolute error (MAE), and performance in identifying unfavorable outcomes (mRS score, >2) were evaluated. Results A total of 1335 patients (median age, 71 years; IQR, 60-80 years; 674 female patients) were included for model development and testing through sixfold cross validation, with distributions of 979, 133, and 223 patients across training, validation, and test sets in each of the six cross-validation folds, respectively. The fused model achieved an MAE of 0.94 (95% CI: 0.89, 0.98) for predicting the specific mRS score, outperforming the imaging-only (MAE, 1.10; 95% CI: 1.05, 1.16; P < .001) and the clinical information-only (MAE, 1.00; 95% CI: 0.94, 1.05; P = .04) models. The fused model achieved an area under the receiver operating characteristic curve (AUC) of 0.91 (95% CI: 0.89, 0.92) for predicting unfavorable outcomes, outperforming the clinical information-only model (AUC, 0.88; 95% CI: 0.87, 0.90; P < .001) and the imaging-only model (AUC, 0.85; 95% CI: 0.84, 0.87; P < .001). Conclusion A fused DL-based NCCT and clinical model outperformed an imaging-only model and a clinical-information-only model in predicting 90-day mRS scores. © RSNA, 2024 Supplemental material is available for this article. See also the editorial by Lee in this issue.


Conflict of interest statement

Disclosures of conflicts of interest: Y.L. No relevant relationships. Y. Yu No relevant relationships. J.O. No relevant relationships. B.J. No relevant relationships. S.O. No relevant relationships. J.W. No relevant relationships. S.L.L. No relevant relationships. Y. Yang No relevant relationships. G.Y. No relevant relationships. P.M. Research grants to author’s institution from the Swiss National Science Foundation and the Swiss Heart Foundation. D.S.L. Consulting fees from Cerenovus, Genentech, Medtronic, Stryker, Rapid Medical. M.L. No relevant relationships. M.E.M. No relevant relationships. J.J.H. Consulting fees from Medtronic, MicroVention, Balt, iSchemaView; advisory board member, Medtronic, Balt, iSchemaView; education chair, Society of Neurointerventional Surgery. M.W. Participation on a DataSafety Monitoring Board or Advisory Board from Icometrix, Subtle Medical, Magnetic Insight. G.A. Consulting fees from iSchemaView, Genentech; equity in iSchemaView. G.Z. Royalties from Cambridge University Press; travel support and honoraria for lectures from Biogen, Bracco; various patents; board member for ISMRM, executive committee member for ASFNR; equity in Subtle Medical.

Figures

None
Graphical abstract
Flowchart shows training, validation, and testing inclusion and
exclusion for study patients. Sixfold cross-validation was implemented to
evaluate the generalizability and performance of the predictive model. Each
set (sets 1–6) served as an independent test set, and the remaining
five folds were combined to form the development set. The development set
was then further randomly split into training (979 of 1335; 73.3%) for
initial model training and validation subsets (133 of 1335; 10.0%) for model
fine-tuning. CRISP = CT Perfusion to Predict Response to Recanalization in
Ischemic Stroke Project, DEFUSE2 = Diffusion and Perfusion Imaging
Evaluation for Understanding Stroke Evolution 2 Study, DEFUSE3 =
Endovascular Therapy Following Imaging Evaluation for Ischemic Stroke 3,
iCAS = Imaging Collaterals in Acute Stroke, LUH = Lausanne University
Hospital, mRS = modified Rankin Scale, NCCT = noncontrast-enhanced CT, SUH =
Stanford University Hospital.
Figure 1:
Flowchart shows training, validation, and testing inclusion and exclusion for study patients. Sixfold cross-validation was implemented to evaluate the generalizability and performance of the predictive model. Each set (sets 1–6) served as an independent test set, and the remaining five folds were combined to form the development set. The development set was then further randomly split into training (979 of 1335; 73.3%) for initial model training and validation subsets (133 of 1335; 10.0%) for model fine-tuning. CRISP = CT Perfusion to Predict Response to Recanalization in Ischemic Stroke Project, DEFUSE2 = Diffusion and Perfusion Imaging Evaluation for Understanding Stroke Evolution 2 Study, DEFUSE3 = Endovascular Therapy Following Imaging Evaluation for Ischemic Stroke 3, iCAS = Imaging Collaterals in Acute Stroke, LUH = Lausanne University Hospital, mRS = modified Rankin Scale, NCCT = noncontrast-enhanced CT, SUH = Stanford University Hospital.
The architecture of the fused model includes a three-dimensional
ResNet-based deep learning (DL) noncontrast-enhanced CT (NCCT; NCCT_DL)
model for imaging-based predictions as well as a nonlinear support vector
regression to integrate clinical variables. The fused model accepts both the
DL NCCT predictions and the clinical variables listed as inputs. The fused
model produces a continuous prediction of 90-day modified Rankin Scale (mRS)
scores. A support vector regression using only clinical variables is defined
as the clinical model, whereas a support vector regression that incorporates
both clinical variables and DL NCCT predictions is defined as the fused
model. NIHSS = National Institutes of Health Stroke Scale.
Figure 2:
The architecture of the fused model includes a three-dimensional ResNet-based deep learning (DL) noncontrast-enhanced CT (NCCT; NCCT_DL) model for imaging-based predictions as well as a nonlinear support vector regression to integrate clinical variables. The fused model accepts both the DL NCCT predictions and the clinical variables listed as inputs. The fused model produces a continuous prediction of 90-day modified Rankin Scale (mRS) scores. A support vector regression using only clinical variables is defined as the clinical model, whereas a support vector regression that incorporates both clinical variables and DL NCCT predictions is defined as the fused model. NIHSS = National Institutes of Health Stroke Scale.
Axial noncontrast-enhanced CT (NCCT) images (left side of each panel)
and corresponding saliency activation maps (right side of each panel)
generated by deep learning–based imaging models in four patients with
diverse clinical scenarios. Activations are color-coded: green shows higher
attention levels. Although the model predictions are continuous, they have
been rounded to the nearest integer for ease of comparison with the actual
modified Rankin Scale (mRS) scores. (A) Images in a 51-year-old female
patient with a history of atrial fibrillation and a 90-day mRS score
(patient A). Both the clinical and imaging models accurately predicted the
score of 2, with increased attention focused on the lesion area. (B) Images
in a 69-year-old female patient with atrial fibrillation and hypertension
and a 90-day mRS score of 5 (patient B). The clinical and imaging models
produced differing and incorrect estimates (6 and 4, respectively), whereas
the fused model accurately predicted a score of 5. (C) Images in a
66-year-old male patient with no history of hypertension, atrial
fibrillation, or diabetes mellitus, with a 90-day mRS score of 6 (deceased;
patient C). The clinical model underestimated the score as 4, whereas the
imaging and fused models predicted a score of 5, which was closer to the
actual 90-day mRS score. (D) Images in a 55-year-old female patient with no
history of hypertension, atrial fibrillation, or diabetes mellitus, with a
90-day mRS score of 2 (patient D). The clinical model underestimated her
score as 1, whereas both the imaging and fused models accurately predicted a
score of 2, which matched her 90-day mRS score. AF = atrial fibrillation, BL
= baseline, DM = diabetes mellitus, HTN = hypertension, NIHSS = National
Institutes of Health Stroke Scale score, 24-hour NIHSS = baseline-adjusted
24-hour NIHSS score.
Figure 3:
Axial noncontrast-enhanced CT (NCCT) images (left side of each panel) and corresponding saliency activation maps (right side of each panel) generated by deep learning–based imaging models in four patients with diverse clinical scenarios. Activations are color-coded: green shows higher attention levels. Although the model predictions are continuous, they have been rounded to the nearest integer for ease of comparison with the actual modified Rankin Scale (mRS) scores. (A) Images in a 51-year-old female patient with a history of atrial fibrillation and a 90-day mRS score (patient A). Both the clinical and imaging models accurately predicted the score of 2, with increased attention focused on the lesion area. (B) Images in a 69-year-old female patient with atrial fibrillation and hypertension and a 90-day mRS score of 5 (patient B). The clinical and imaging models produced differing and incorrect estimates (6 and 4, respectively), whereas the fused model accurately predicted a score of 5. (C) Images in a 66-year-old male patient with no history of hypertension, atrial fibrillation, or diabetes mellitus, with a 90-day mRS score of 6 (deceased; patient C). The clinical model underestimated the score as 4, whereas the imaging and fused models predicted a score of 5, which was closer to the actual 90-day mRS score. (D) Images in a 55-year-old female patient with no history of hypertension, atrial fibrillation, or diabetes mellitus, with a 90-day mRS score of 2 (patient D). The clinical model underestimated her score as 1, whereas both the imaging and fused models accurately predicted a score of 2, which matched her 90-day mRS score. AF = atrial fibrillation, BL = baseline, DM = diabetes mellitus, HTN = hypertension, NIHSS = National Institutes of Health Stroke Scale score, 24-hour NIHSS = baseline-adjusted 24-hour NIHSS score.
Receiver operating characteristic (ROC) curve comparisons among the
clinical, imaging, and fused models. AUC = area under the receiver operating
characteristic curve, BA24-NIHSS = baseline-adjusted 24-hour National
Institutes of Health Stroke Scale score.
Figure 4:
Receiver operating characteristic (ROC) curve comparisons among the clinical, imaging, and fused models. AUC = area under the receiver operating characteristic curve, BA24-NIHSS = baseline-adjusted 24-hour National Institutes of Health Stroke Scale score.
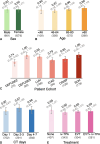
Bar graphs show subanalyses of the performance of the fused model
according to (A) sex, (B) age (in years), (C) patient cohort, (D) period
when CT was performed (ie, number of days between stroke and undergoing CT),
and (E) treatment regimen using the mean absolute error (MAE) metric. Data
are MAEs; data in parentheses are 95% CIs. CRISP = CT Perfusion to Predict
Response to Recanalization in Ischemic Stroke Project, DEFUSE2 = Diffusion
and Perfusion Imaging Evaluation for Understanding Stroke Evolution 2 Study,
DEFUSE3 = Endovascular Therapy Following Imaging Evaluation for Ischemic
Stroke 3, EVT = endovascular thrombectomy, iCAS = Imaging Collaterals in
Acute Stroke, iv-tPA = intravenous tissue plasminogen activator, LUH =
Lausanne University Hospital, SUH = Stanford University Hospital.
Figure 5:
Bar graphs show subanalyses of the performance of the fused model according to (A) sex, (B) age (in years), (C) patient cohort, (D) period when CT was performed (ie, number of days between stroke and undergoing CT), and (E) treatment regimen using the mean absolute error (MAE) metric. Data are MAEs; data in parentheses are 95% CIs. CRISP = CT Perfusion to Predict Response to Recanalization in Ischemic Stroke Project, DEFUSE2 = Diffusion and Perfusion Imaging Evaluation for Understanding Stroke Evolution 2 Study, DEFUSE3 = Endovascular Therapy Following Imaging Evaluation for Ischemic Stroke 3, EVT = endovascular thrombectomy, iCAS = Imaging Collaterals in Acute Stroke, iv-tPA = intravenous tissue plasminogen activator, LUH = Lausanne University Hospital, SUH = Stanford University Hospital.
Graph shows permutation feature importance in 90-day modified Rankin
Scale score prediction. The 24-hour (hr) National Institutes of Health
Stroke Scale (NIHSS) score and noncontrast-enhanced CT–based deep
learning (NCCT_DL) predictions are identified as dominant features, whereas
other clinical variables, such as diabetes mellitus (DM), atrial
fibrillation (AF), and hypertension (HTN), have a lower impact. Circles
represent the mean feature importance values and error bars indicate the 95%
CIs. BL = baseline.
Figure 6:
Graph shows permutation feature importance in 90-day modified Rankin Scale score prediction. The 24-hour (hr) National Institutes of Health Stroke Scale (NIHSS) score and noncontrast-enhanced CT–based deep learning (NCCT_DL) predictions are identified as dominant features, whereas other clinical variables, such as diabetes mellitus (DM), atrial fibrillation (AF), and hypertension (HTN), have a lower impact. Circles represent the mean feature importance values and error bars indicate the 95% CIs. BL = baseline.

References

    1. Benjamin EJ , Blaha MJ , Chiuve SE , et al . Heart Disease and Stroke Statistics-2017 Update: A Report From the American Heart Association . Circulation 2017. ; 135 ( 10 ): e146 – e603 . [Published corrections appear in Circulation 2017;135(10):e646 and Circulation 2017;136(10):e196.] - PMC - PubMed
    1. Nichols-Larsen DS , Clark PC , Zeringue A , Greenspan A , Blanton S . Factors influencing stroke survivors’ quality of life during subacute recovery . Stroke 2005. ; 36 ( 7 ): 1480 – 1484 . - PubMed
    1. Bernhardt J , Hayward KS , Kwakkel G , et al . Agreed definitions and a shared vision for new standards in stroke recovery research: The Stroke Recovery and Rehabilitation Roundtable taskforce . Int J Stroke 2017. ; 12 ( 5 ): 444 – 450 . - PubMed
    1. Langhorne P , Bernhardt J , Kwakkel G . Stroke rehabilitation . Lancet 2011. ; 377 ( 9778 ): 1693 – 1702 . - PubMed
    1. Xie Y , Jiang B , Gong E , et al . JOURNAL CLUB: Use of Gradient Boosting Machine Learning to Predict Patient Outcome in Acute Ischemic Stroke on the Basis of Imaging, Demographic, and Clinical Information . AJR Am J Roentgenol 2019. ; 212 ( 1 ): 44 – 51 . - PubMed

Publication types

LinkOut - more resources