. 2025 Feb 3;13(2):229-244.
doi: 10.1158/2326-6066.CIR-24-0416.

T Cells Instruct Immune Checkpoint Inhibitor Therapy Resistance in Tumors Responsive to IL1 and TNFα Inflammation

Affiliations

T Cells Instruct Immune Checkpoint Inhibitor Therapy Resistance in Tumors Responsive to IL1 and TNFα Inflammation

Nam Woo Cho et al. Cancer Immunol Res. .

Abstract

Resistance to immune checkpoint inhibitors (ICI) is common, even in tumors with T-cell infiltration. We thus investigated consequences of ICI-induced T-cell infiltration in the microenvironment of resistant tumors. T cells and neutrophil numbers increased in ICI-resistant tumors following treatment, in contrast to ICI-responsive tumors. Resistant tumors were distinguished by high expression of IL1 receptor 1, enabling a synergistic response to IL1 and TNFα to induce G-CSF, CXCL1, and CXCL2 via NF-κB signaling, supporting immunosuppressive neutrophil accumulation in tumor. Perturbation of this inflammatory resistance circuit sensitized tumors to ICIs. Paradoxically, T cells drove this resistance circuit via TNFα both in vitro and in vivo. Evidence of this inflammatory resistance circuit and its impact also translated to human cancers. These data support a mechanism of ICI resistance, wherein treatment-induced T-cell activity can drive resistance in tumors responsive to IL1 and TNFα, with important therapeutic implications.


Figures

Figure 1:
Figure 1:. T cell-infiltrated tumors demonstrate variable responses to ICIs.
A, Outline for generation of MSI-H syngeneic tumors. B, Western blot of whole cell lysates. Representative of 3 independent experiments. C, Targeted microsatellite PCR assay comparing amplicon size at microsatellite loci for MSI-H vs. MSS cell line. Representative of two independent experiments. D, Whole exome sequencing quantification of single nucleotide polymorphisms (SNPs) and insertion-deletion mutations (indels) for indicated MSI-H cell lines compared to MSS lines. E, MuPeXI neoepitope affinity scores for indicated cell lines and HLA class. D statistic and p values calculated using a two-sided Kolmogorov-Smirnov test. F and G, Mean volumes and area under curves (AUC) for B16F10 subcutaneous tumors treated with or without anti-PD1 and anti-CTLA4 antibodies (ICIs) at indicated timepoints (white arrowhead). Black arrowhead denotes timepoint for sample collection for CyTOF analysis. n=15–18 mice per condition from two independent experiments. Two-tailed adjusted p value by Mann-Whitney tests. H and I, Analysis as in (F) and (G) for subcutaneous LLC tumors. n=7–8 mice per condition from one experiment. Two-tailed adjusted p values by Welch’s t tests. J, Immune subsets defined by manual gating of CyTOF data from B16F10 subcutaneous or LLC MFP tumors harvested at day 13 post implantation. Conv=conventional; Mac=macrophages; Mo=monocytes. Bar height for each population represents mean of biological replicates (n=5–15 mice) from three independent experiments. K, Quantification of CD8+ T cells (top panel) and CD4+ Tconv (bottom panel) from (J). Two-tailed adjusted p value by Mann- Whitney tests.
Figure. 2:
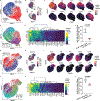
Figure. 2:. Distinct effector protein expression in T cells in ICI-responsive vs. ICI-resistant tumors.
A, Differential abundance (DA) analysis of 10,000 CD44+ CD8+ T cells from ICI-treated B16F10 MSI-H and LLC MSI-H tumors harvested at day 13. CyTOF data acquired with n=5 mice each from one representative experiment of three independent in vivo tumor growth experiments. B, Density plots for cells in each tumor type from (A). C, Feature plots for selected markers colored by asinh transformed staining intensity. D, Clustering of DA cells from (A). E, Heatmap of median marker intensities for cells in each DA cluster. nDA, non-DA cells. Colors indicate clusters more abundant in B16F10 (blue) or LLC (red) tumors. F, Manually gated CD8+ T cell subset in B16F10 and LLC tumors. P value by one-tailed Mann-Whitney test. G, DA analysis as in (A) for CD44+ CD4+ Tconv cells. H, Density plots for cells in each tumor type. I, Feature plots for selected markers colored by asinh transformed staining intensity. J, Clustering of DA cells from (G). K, Heatmap of median marker intensities for cells in each DA cluster. Colors indicate clusters more abundant in B16F10 (blue) or LLC (red) tumors. L, Manually gated CD4+ Tconv cell subset in B16F10 and LLC tumors. P value by one-tailed Mann-Whitney test.
Figure 3:
Figure 3:. IL-1 and TNFα synergistically drive immunosuppressive neutrophil inflammation from IL1R1- expressing tumor cells.
A, Neutrophil quantification in B16F10 and LLC tumors at indicated timepoints and treatment conditions (n=5–10 mice) from two independent experiments. P values by one-tailed Welch’s t test. B, Pairwise Spearman correlations between unsupervised immune cell clusters across tumor, blood, tumor- draining lymph node, and spleen from CyTOF analysis of one representative experiment. Connecting lines indicate pairs of correlated clusters of which at least one cluster is a neutrophil, indicating positive (red) or negative (blue) correlations with r >0.7 or r <−0.7. Samples harvested at day 13 from n=20 mice for B16F10 and at day 20 from n=10 mice for LLC. C, brdU median fluorescence intensity (MFI) and % positive splenic OT-I T cells cultured with SIINFEKL peptide and/or sorted neutrophils from day 20 LLC MSI-H tumors, from n=3 mice per condition in one experiment. Adjusted p values by Welch’s t tests. D, Left panel, principal component (PC) analysis of cytokines in day 20 tumor lysates by multiplexed bead assay in one representative experiment, n=5 per condition. 95% confidence ellipse is shown. Right panel, loadings plot of contribution by the top 12 cytokines. E, Quantification of indicated cytokines in day 20 tumor lysates by multiplexed bead assay in 5 independent experiments. Two-tailed p values by Mann-Whitney test. F, RT-qPCR of cytokine transcripts from sorted cells from day 20 LLC MSI-H ICI-treated tumors, with expression normalized to control treated tumors. Mean of n=3–6 biological replicates from two independent experiments. G, ELISA of G-CSF in cell culture supernatant of indicated cell lines treated with or without indicated cytokines for 24h in three biological replicates. One representative experiment of five independent experiments. H, IκBα MFI in indicated cell lines with or without TNFα and IL-1α from three biological replicates. One representative experiment of two independent experiments. P value by two-tailed t test. I, ELISA of G-CSF and CXCL1 in cell culture supernatant of indicated cell lines following indicated treatment conditions from three biological replicates. One representative experiment of two independent experiments. P value by two-tailed t test. J, Representative histogram of IL1R1 fluorescence staining intensity for indicated cell lines compared to fluorescence-minus-one controls. K, % IL1R1+ cells in indicated cell lines from one representative experiment with four biological replicates. Two independent experiments were performed. P value by two-tailed t test.
Figure 4:
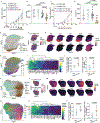
Figure 4:. IL1R1 perturbation limits immunosuppressive inflammation to sensitize resistant tumors to ICIs.
A and B, Mean volumes and AUC for LLC MSI-H tumors treated with or without ICIs and IL1R1-neutralizing antibodies at the indicated timepoints (arrowheads). n=11–17 mice per condition from three independent experiments. Two-tailed adjusted p value by Mann-Whitney test. C and D, Mean volumes and AUCs for LLC MSI-H tumors with or without tumor Il1r1 knock out (Il1r1-KO) treated with or without ICIs. n=12–13 mice per condition from two independent experiments. Two-tailed adjusted p value by Mann-Whitney test. E, Differential abundance (DA) analysis of 26,400 CD44+ CD8+ T cells from ICI-treated LLC MSI-H tumors +/− aIL1R1 treatment (n=4 mice each from one representative experiment analyzed by CyTOF) harvested at day 13. Colored dots indicate thresholded top DA cells increased in the indicated condition. F, Cell density plots for each condition. G, Feature plots for selected markers colored by asinh transformed staining intensity. H, Clustering of DA cells from (E). I, Heatmap of median marker intensities for cells in each DA cluster. nDA, non-DA cells. Colored dots indicate clusters enriched in the aIL1R1 condition (brown) vs. control (teal). J, Manually gated CD8+ T cell subset in each condition, quantified as % of parent (left panel) and of singlets in tumor (right panel). P value by one-tailed t test. K, DA analysis as in (E) for CD44+ CD4+ Tconv cells. L, Density plots for cells in each condition. M, Feature plots for selected markers colored by asinh transformed staining intensity. N, Clustering of DA cells from (K). O, Heatmap of median marker intensities for cells in each DA cluster. nDA, non-DA cells. Colored dots indicate clusters enriched in the aIL1R1 condition (brown) vs. control (teal). P, Manually gated CD4+ Tconv cell subset in each condition, quantified as % of parent (left panel) and of singlets in tumor (right panel). P value by one-tailed t test.
Figure 5:
Figure 5:. T cells drive the inflammatory ICI resistance circuit via TNFα.
A, G-CSF concentration in day 20 tumor lysates with n=4–5 mice per condition from one experiment. P value by two-tailed Welch’s t test. B, Quantification as in (A) for CXCL1. C, Quantification of neutrophils in day 20 tumors in two independent experiments, n=12–13 mice per condition. P value by two-tailed Welch’s t test. D, Schematic for T cell-tumor coculture. E, G-CSF concentration in supernatant of 24h culture containing indicated sorted cell types from day 20 LLC MSI-H tumors, with or without TNFα neutralizing antibody, from one representative experiment with n=3 mice. Two independent experiments were performed. Adjusted p values by two-tailed Welch’s t test. F, Quantification of TNFα+ CD4+ or CD8+ T cells in tumor or spleen of day 20 LLC MSI-H tumor bearing mice treated with indicated antibodies, n=4–5 mice from one representative experiment. Three independent experiments were performed. P value by two-tailed t test. G, Ki-67 and GrB fluorescence intensity in TNFα or TNFα+ CD8+ T cells. H, % of TNFα and TNFα+ CD8+ T cells in high expression gates for each marker. P value by two-tailed t tests. n=5 mice from one representative experiment. Two independent experiments were performed. I and J, Mean volumes and AUC for LLC MSI-H tumors treated with IgG or ICIs in wild-type C57BL/6J or Tnf-null mice. Adjusted p values by Mann-Whitney test. n=5–12 from two independent experiments. K and L, Mean volumes and AUC for LLC MSI-H tumors treated with IgG or ICIs, implanted in Cd4-cre(WT) Tnf(fl/fl or fl/+) control mice or Cd4-cre(+/−) Tnf(fl/fl) mice. Adjusted p values by Mann-Whitney test. n=10–14 mice from two independent experiments.
Figure 6:
Figure 6:. T cell, tumor, and neutrophil inflammation circuit in human cancer.
A, ELISA of G-CSF in supernatant of breast cancer organoid culture following indicated treatments for 24h, from one representative experiment with n=3 biological replicates. Two independent experiments were performed. P value by two-tailed t test. B, Analysis as in (A) for CXCL1. Adjusted p values by t tests. C, IL1R1 RT-qPCR for breast organoids from two independent experiments. P value by one-tailed Mann-Whitney test. D, BIOKEY study schematic (EGAS00001004809) analyzed in (E-J). E, UMAP of 24,349 CD8+ T cells color coded by CD8+ T cell phenotype. F, Cell density plots of GZMB, TNF, and GZMK expressing cells. G-I, % cells in indicated cluster out of singlet cells in tumor for pre vs. on-treatment samples for each patient. P value by two-tailed Wilcoxon matched-pairs signed rank test. J, Quantification of on-treatment NF-κB scores in tumor cells for each patient, stratified by IL1R1 expression (≥1% (high) or <1% (low) of tumor cells). K, Schema and plots of neutrophil/lymphocyte ratios in peripheral blood of patients with MSI-H tumors treated with ICI therapy, stratified by pregressor vs. non-progresor. P value by two-tailed Wilcoxon matched-pairs signed rank test. L, Kaplan-Meier curves from the OAK trial (NCT02008227), stratified by CD8A and inflammation gene score (“inflam”). P values by log-rank test. M, Mechanistic model.

References

    1. Le DT, Uram JN, Wang H, Bartlett BR, Kemberling H, Eyring AD, et al. PD-1 Blockade in Tumors with Mismatch-Repair Deficiency. New England Journal of Medicine [Internet]. 2015;372:2509–20. Available from: http://www.nejm.org/doi/10.1056/NEJMoa1500596 - DOI - PMC - PubMed
    1. Petrelli F, Ghidini M, Ghidini A, Tomasello G. Outcomes Following Immune Checkpoint Inhibitor Treatment of Patients With Microsatellite Instability-High Cancers: A Systematic Review and Meta- analysis. JAMA Oncol [Internet]. American Medical Association; 2020. [cited 2022 Mar 31];6:1068–71. Available from: https://jamanetwork.com/journals/jamaoncology/fullarticle/2765752 - PMC - PubMed
    1. Li F, Li C, Cai X, Xie Z, Zhou L, Cheng B, et al. The association between CD8+ tumor-infiltrating lymphocytes and the clinical outcome of cancer immunotherapy: A systematic review and meta-analysis. EClinicalMedicine [Internet]. Elsevier Ltd; 2021. [cited 2022 Jun 26];41:101134. Available from: http://www.thelancet.com/article/S2589537021004144/fulltext - PMC - PubMed
    1. Kim TM, Laird PW, Park PJ. The landscape of microsatellite instability in colorectal and endometrial cancer genomes. Cell. Elsevier B.V; 2013;155:858. - PMC - PubMed
    1. Le DT, Uram JN, Wang H, Bartlett BR, Kemberling H, Eyring AD, et al. PD-1 Blockade in Tumors with Mismatch-Repair Deficiency. New England Journal of Medicine. Massachusetts Medical Society; 2015;372:2509–20. - PMC - PubMed

MeSH terms

Substances