. 2025 Jan;68(1):152-165.
doi: 10.1007/s00125-024-06286-2. Epub 2024 Oct 15.

Beta cell-specific PAK1 enrichment ameliorates diet-induced glucose intolerance in mice by promoting insulin biogenesis and minimising beta cell apoptosis

Affiliations

Beta cell-specific PAK1 enrichment ameliorates diet-induced glucose intolerance in mice by promoting insulin biogenesis and minimising beta cell apoptosis

Miwon Ahn et al. Diabetologia. 2025 Jan.

Abstract

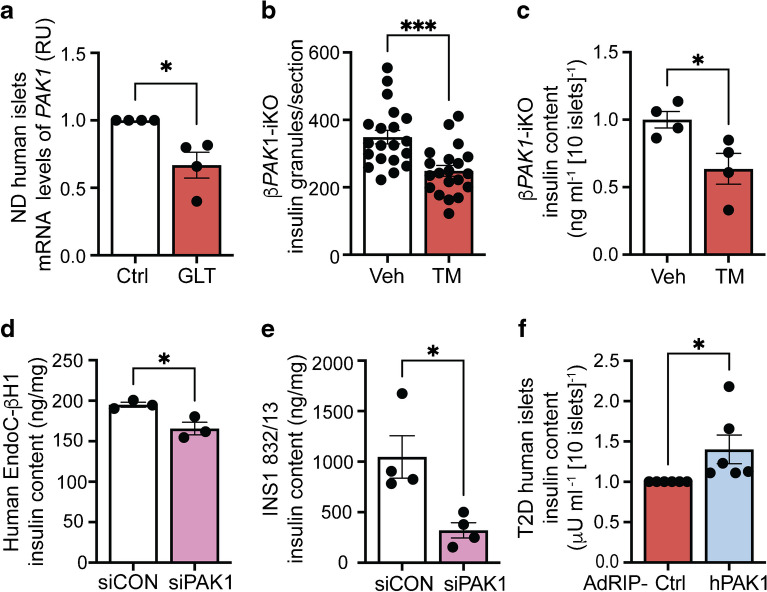
Aims/hypothesis: p21 (CDC42/RAC1) activated kinase 1 (PAK1) is depleted in type 2 diabetic human islets compared with non-diabetic human islets, and acute PAK1 restoration in the islets can restore insulin secretory function ex vivo. We hypothesised that beta cell-specific PAK1 enrichment in vivo can mitigate high-fat-diet (HFD)-induced glucose intolerance by increasing the functional beta cell mass.

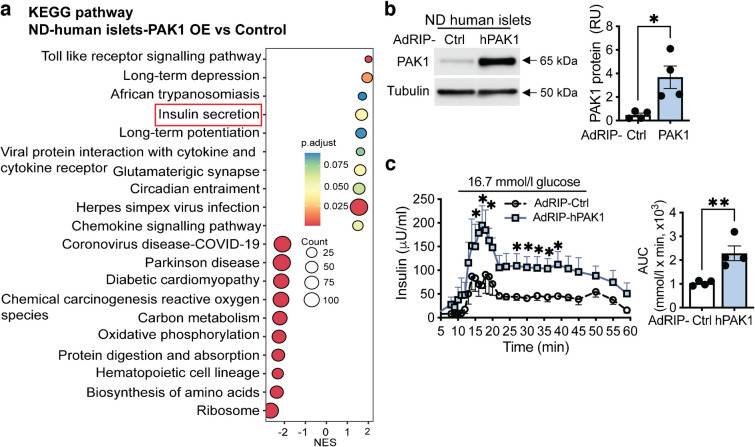
Methods: Human islets expressing exogenous PAK1 specifically in beta cells were used for bulk RNA-seq. Human EndoC-βH1 cells overexpressing myc-tagged PAK1 were used for chromatin immunoprecipitation (ChIP) and ChIP-sequencing (ChIP-seq). Novel doxycycline-inducible beta cell-specific PAK1-expressing (iβPAK1-Tg) mice were fed a 45% HFD pre-induction for 3 weeks and for a further 3 weeks with or without doxycycline induction. These HFD-fed mice were evaluated for GTT, ITT, 6 h fasting plasma insulin and blood glucose, body composition, islet insulin content and apoptosis.

Results: Beta cell-specific PAK1 enrichment in type 2 diabetes human islets resulted in decreased beta cell apoptosis and increased insulin content. RNA-seq showed an upregulation of INS gene transcription by PAK1. Using clonal human beta cells, we found that PAK1 protein was localised in the cytoplasm and the nucleus. ChIP studies revealed that nuclear PAK1 enhanced pancreatic and duodenal homeobox1 (PDX1) and neuronal differentiation 1 (NEUROD1) binding to the INS promoter in a glucose-responsive manner. Importantly, the iβPAK1-Tg mice, when challenged with HFD and doxycycline induction displayed enhanced glucose tolerance, increased islet insulin content and reduced beta cell apoptosis when compared with iβPAK1-Tg mice without doxycycline induction.

Conclusions/interpretation: PAK1 plays an unforeseen and beneficial role in beta cells by promoting insulin biogenesis via enhancing the expression of PDX1, NEUROD1 and INS, along with anti-apoptotic effects, that culminate in increased insulin content and beta cell mass in vivo and ameliorate diet-induced glucose intolerance.

Data availability: The raw and processed RNA-seq data and ChIP-seq data, which has been made publicly available at Gene Expression Omnibus (GEO) at https://www.ncbi.nlm.nih.gov/geo/ , can be accessed in GSE239382.

Keywords: Beta cell; Diet-induced obesity; Human islets; Insulin biogenesis; Insulin gene promoter; NEUROD1; PAK1; PDX1; Type 2 diabetes.


Conflict of interest statement

Acknowledgements: We are grateful to C. V. E. Wright (Department of Cell and Developmental Biology, Vanderbilt University, TN, USA) for providing the PDX1 antibody. We thank the Indiana University School of Medicine Transgenic Mouse core for generating one founder line of TRE-hPAK1 transgenic mice, and the City of Hope Transgenic Mouse Core (Duarte, CA, USA) for generating two additional founder lines. Human islets were provided by the City of Hope Islet Core and by the Integrated Islet Distribution Program (IIDP). Research reported in this publication included work performed in the City of Hope the Electron Microscopy Core, the Integrated Genomics Core, the Comprehensive Metabolic Phenotyping Core, and the Pathology Core supported by the National Cancer Institute of the National Institutes of Health under grant no. P30CA033572. We thank C. S. Jayasena (City of Hope, Duarte, CA, USA) for providing critical feedback and editing the manuscript. Data availability: The raw and processed RNA-seq data and ChIP-seq data, which has been made publicly available at Gene Expression Omnibus (GEO) at https://www.ncbi.nlm.nih.gov/geo/ , can be accessed in GSE239382. Funding: Open access funding provided by SCELC, Statewide California Electronic Library Consortium. This work was supported by the National Institutes of Health grants to DCT (DK067912, DK112917 and DK102233) and SD (R01DK120523). The study funders were not involved in the design of the study; the collection, analysis, and interpretation of data; writing the report; and did not impose any restrictions regarding the publication of the report. Authors’ relationships and activities: The authors declare that there are no relationships or activities that might bias, or be perceived to bias, their work. Contribution statement: The study was conceptualised by DCT and MA. The funding was acquired by DCT. Experiments were performed by EMM, MA, PAG and SD. Bioinformatics analysis was performed by SB. Resources were provided by RS. The project was supervised by DCT. The original draft of this manuscript was written by DCT and MA. DCT, MA, EMM, PAG, RS, SB and SD were involved in the data analysis, discussion and editing of the manuscript. All authors approved the final version of the manuscript. DCT is the guarantor of this work and takes full responsibility for the manuscript.

Figures

Fig. 1
Fig. 1
PAK1 depletion is correlated with reduced insulin granule numbers and insulin content. (a) Quantification of PAK1 mRNA in ND human islets (n=4 donors) exposed to GLT stress for 48 h. (b, c) Quantification of insulin granule numbers (b) and insulin content (c) in tamoxifen-treated βPAK1-iKO mouse islets vs vehicle-treated Ctrl mice. Insulin granules were counted in a blinded manner using transmission electron microscopy of isolated islets from βPAK1-iKO and Ctrl mice. Total 20 sections, n=3 (b) or n=4 (c) mice/treatment group. (d, e) Quantification of insulin content in PAK1-depleted clonal human EndoC-βH1 (d) and rat INS1 832/13 cell lines (e); n=3 (d) or n=4 (e) independent experiments. (f) Quantification of insulin content in type 2 diabetic human islets following adenovirus-mediated restoration of beta cell-specific PAK1 (n=6 donors/vector). All data are shown as the mean ± SEM and presented in a bar graph. *p<0.05, ***p<0.001 (unpaired two-tailed Student’s t test). AdRIP-Ctrl, Ctrl empty vector; AdRIP-hPAK1, human PAK1 vector; RU, relative units; siCON, Ctrl siRNA; siPAK1, PAK1 siRNA; T2D, type 2 diabetes; TM, tamoxifen; Veh, vehicle
Fig. 2
Fig. 2
Beta cell-specific PAK1 enrichment impacts INS, PDX1 and NEUROD1 mRNA levels, and NEUROD1 protein levels in type 2 diabetic human islets. Type 2 diabetic human islets were transduced with human PAK1 (AdRIP-hPAK1) or empty control vector (AdRIP-Ctrl). (a) Bulk RNA-seq data from transduced type 2 diabetic islets were used to generate an IPA network (n=3 donors/vector). (bf) qPCR analysis of PAK1 (b), INS (c), PDX1 (d), NEUROD1 (e) and MAFA (f) mRNA levels in transduced type 2 diabetic islets (n=6 donors/vector). (gi) Protein levels of PAK1 (g), NEUROD1 (h) and PDX1 (i) were determined by immunoblot (n=6 donors/vector). All data are shown as mean ± SEM and presented in a bar graph. *p<0.05, **p<0.01 (unpaired two-tailed Student’s t test). RU, relative units
Fig. 3
Fig. 3
Beta cell-specific overexpression of PAK1 enhances insulin secretion in ND human islets. ND human islets were adenovirally transduced with AdRIP-Ctrl or AdRIP-hPAK1 to yield beta cell-specific PAK1 overexpression. (a) Bulk RNA-seq data from transduced ND human islets were analysed by the KEGG pathway (n=4 donors). (b) PAK1 protein levels were determined by immunoblot and quantified. All data are shown as mean ± SEM. The quantification data are presented as a bar graph. *p<0.05 (unpaired two-tailed Student’s t test). (c) Human islets were perifused with 2.8 mmol/l (0–10 min and 46–60 min) and 16.7 mmol/l (11–45 min) glucose; insulin content and AUC are shown. Curves represent the mean average ± SEM of four independent sets of human donor islets performed in paired experiments and the AUC data are presented as a bar graph, *p<0.05 (two-way ANOVA, Tukey test), **p<0.01 (unpaired two-tailed Student’s t test)
Fig. 4
Fig. 4
PAK1 enrichment in human clonal beta cells impacts PDX1 and NEUROD1 occupancy at the INS promoter under high-glucose conditions. (a) Representative immunoblots of nuclear and non-nuclear fractions (n=3 independent experiments) from myc-hPAK1 transfected human EndoC-βH1 cells. (b) Distribution of myc-hPAK1 binding sites in human EndoC-βH1 cells relative to genomic landmarks. (c) PAK1 bound INS, PDX1 and NEUROD1 in the enhancer region. (d, e) Quantification of PDX1 (d) and NEUROD1 (e) occupancy at the INS promoter in indicated EndoC-βH1 cells under basal (2.8 mmol/l) or high (16.7 mmol/l) glucose conditions (n=3 independent experiments). Data show means ± SEM and presented in a bar graph. *p<0.05, **p<0.01, ***p<0.001 (one-way ANOVA, Tukey test). CDS, coding sequence; TSS, transcription start site; UTR, untranslated region
Fig. 5
Fig. 5
Beta cell-specific PAK1 enrichment ameliorates glucose intolerance in HFD-fed PAK1-expressing transgenic mice. (a) Schematic of beta cell-specific Dox-inducible PAK1-expressing mice used. (b) Schematic of the HFD study design. (c, d) GTT analyses at pre-treatment (c) and post-treatment (+Dox) (d). (e) Body composition analysis post-treatment. (f) AUC analyses from GTT data from (c, d). (g) Differential AUC from post-treatment GTT AUC-pre-treatment GTT AUC per mouse. (h) ITT over 90 min. (ch) Ctrl: dTg + HFD, n=8; iβPAK1-Tg: HFD + Dox, n=11; Ctrl: sTg + Chow + Dox, n=7. (i) Static-culture insulin secretion assays in which islets were incubated in 2.8 mmol/l glucose or 16.7 mmol/l glucose. Data are shown as stimulation index: 16.7 mmol/l glucose-stimulated/2.8 mmol/l glucose-stimulated insulin. (j) Quantification of islet insulin content. (i, j) Ctrl: dTg + HFD, n=5; iβPAK1-Tg: HFD + Dox, n=5; Ctrl: Chow + Dox, n=7. (k, l) Total insulin+ beta cells (k) and total islet number (l) (quantified across >9 pancreas sections per group, n=3/group). Data are expressed as means ± SEM except for box and whisker plots (g, j, k), which show median and minimum to maximum, and all show data points. Statistics: two-way ANOVA Tukey test (c, d, f); one-way ANOVA Tukey test (e, i, l); one-way ANOVA Fisher’s LSD test (j, k); unpaired two-tailed Student’s t test (g). In (c, d) Ctrl: dTg + HFD vs Ctrl: sTg + Chow (without Dox in c, with Dox in d); *iβPAK1-Tg: HFD vs Ctrl: sTg + Chow (without Dox in c, with Dox in d); §Ctrl: dTg + HFD vs iβPAK1-Tg: HFD + Dox. In (eg, ik) *as indicated. Single symbols ,*,§p<0.05; double symbols ‡‡,**p<0.01; triple symbols ‡‡‡,***p<0.001. w/o, weeks old
Fig. 6
Fig. 6
Beta cell-specific PAK1 restoration impacts beta cell apoptosis in transgenic mouse and type 2 diabetic human islets. (a) Representative TUNEL immunofluorescence image from indicated mouse islets. Yellow arrow indicates double positive beta cells for TUNEL (red) and insulin (green) (n=3 mice). Scale bar, 50 μm. (b) Quantification of TUNEL+ beta cells in indicated mouse islets (n=3 mice). (c) Representative immunoblot of CC-3 and PAK1 post-Dox treatment in indicated mouse islets (Ctrl: sTg + Chow + Dox, n=3; Ctrl: dTg+ HFD, n=7; iβPAK1-Tg: HFD + Dox, n=7). The bar graph displays the quantification of CC-3 immunoblot relative to tubulin in relative units (RU). (d) Representative immunoblot of PAK1-enriched type 2 diabetic human islets for BCL2 (n=6 donors), CC-3 and PAK1 (n=10 donors). Data in (bd) are shown as mean ± SEM and presented as a bar graph. *p<0.05 (unpaired two-tailed Student’s t test)

References

    1. International Diabetes Federation (2021) IDF Diabetes Atlas, 10th edition. available from www.diabetesatlas.org. Accessed 24, April. 2023
    1. CDC (2022) Centres for Disease Control and Prevention. National Diabetes Statistics Report website. https://www.cdc.gov/diabetes/satistics-report/index.html. Accessed 12 December. 2022
    1. Butler AE, Janson J, Bonner-Weir S, Ritzel R, Rizza RA, Butler PC (2003) Beta-cell deficit and increased beta-cell apoptosis in humans with type 2 diabetes. Diabetes 52(1):102–110. 10.2337/diabetes.52.1.102 - PubMed
    1. Talchai C, Xuan S, Lin HV, Sussel L, Accili D (2012) Pancreatic beta cell dedifferentiation as a mechanism of diabetic beta cell failure. Cell 150(6):1223–1234. 10.1016/j.cell.2012.07.029 - PMC - PubMed
    1. Cinti F, Bouchi R, Kim-Muller JY et al (2016) Evidence of β-cell dedifferentiation in human type 2 diabetes. J Clin Endocrinol Metab 101(3):1044–1054. 10.1210/jc.2015-2860 - PMC - PubMed