. 2024 Oct 4;41(10):msae206.
doi: 10.1093/molbev/msae206.

Toxin-Antitoxin Systems Reflect Community Interactions Through Horizontal Gene Transfer

Affiliations

Toxin-Antitoxin Systems Reflect Community Interactions Through Horizontal Gene Transfer

Jonathan H Bethke et al. Mol Biol Evol. .

Abstract

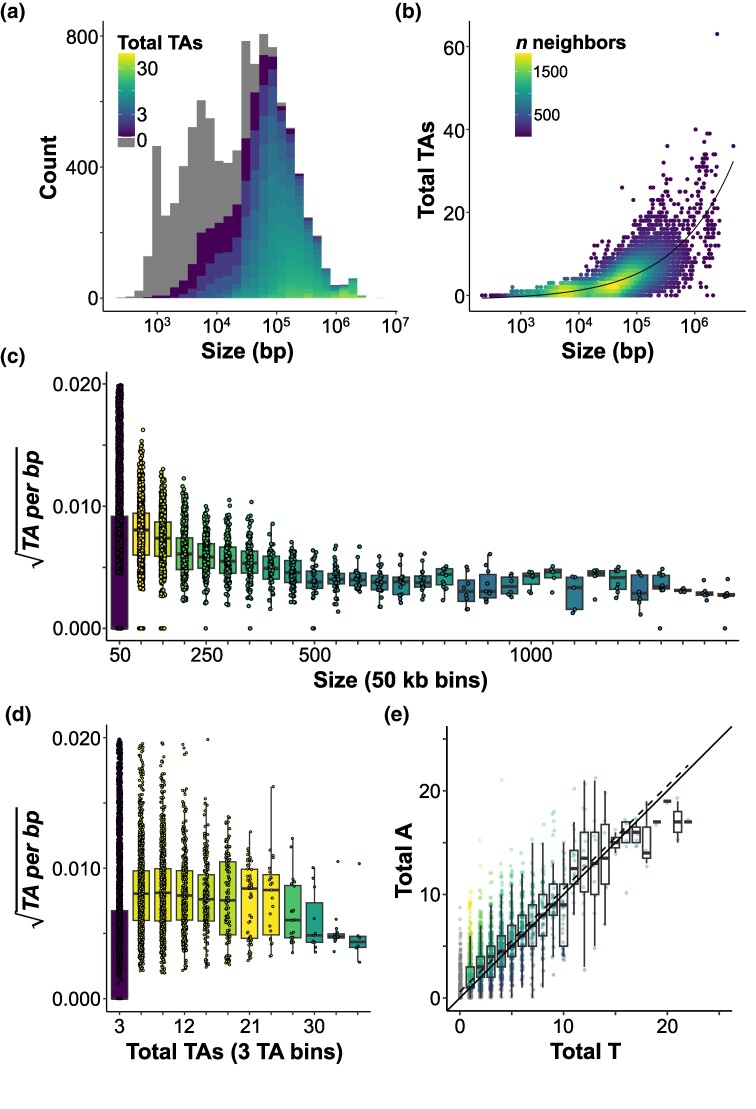
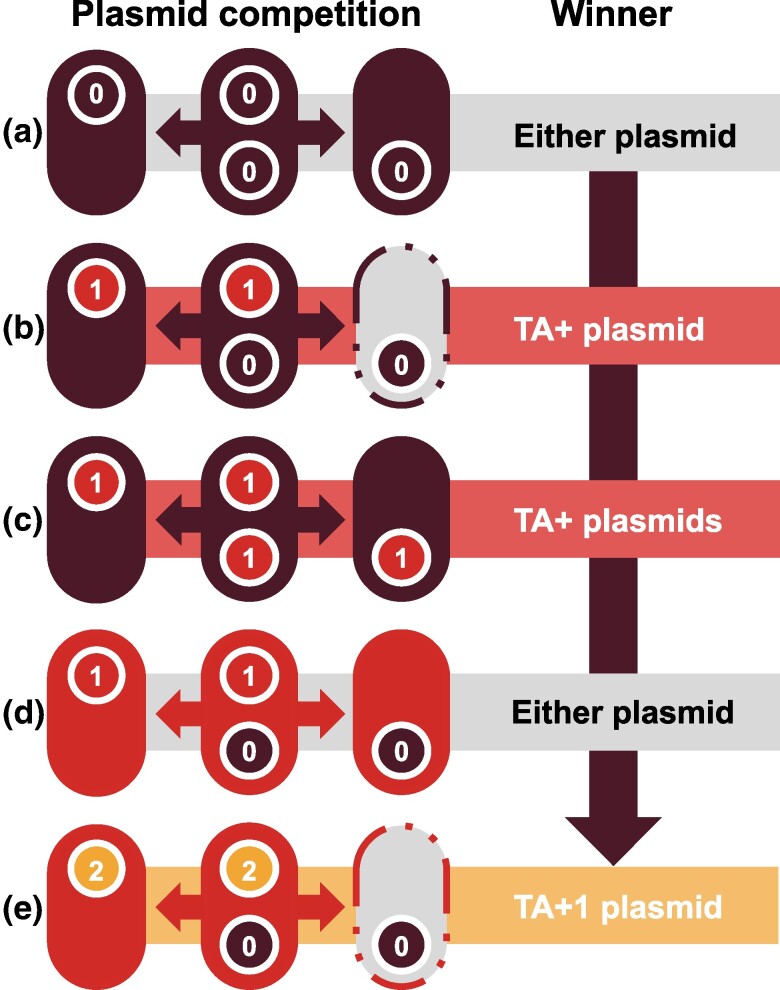
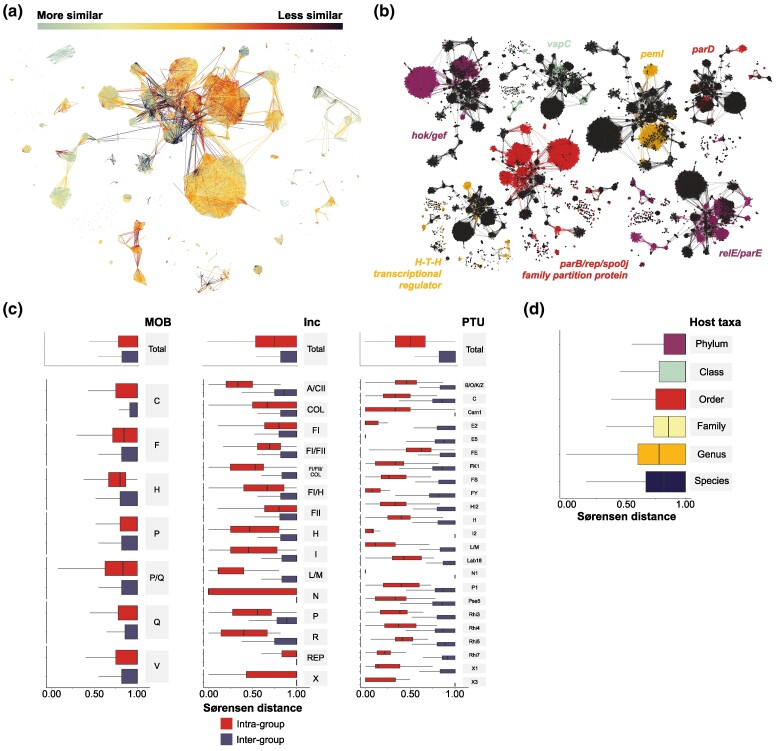
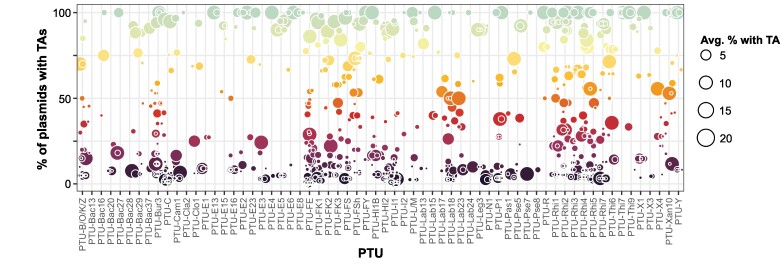
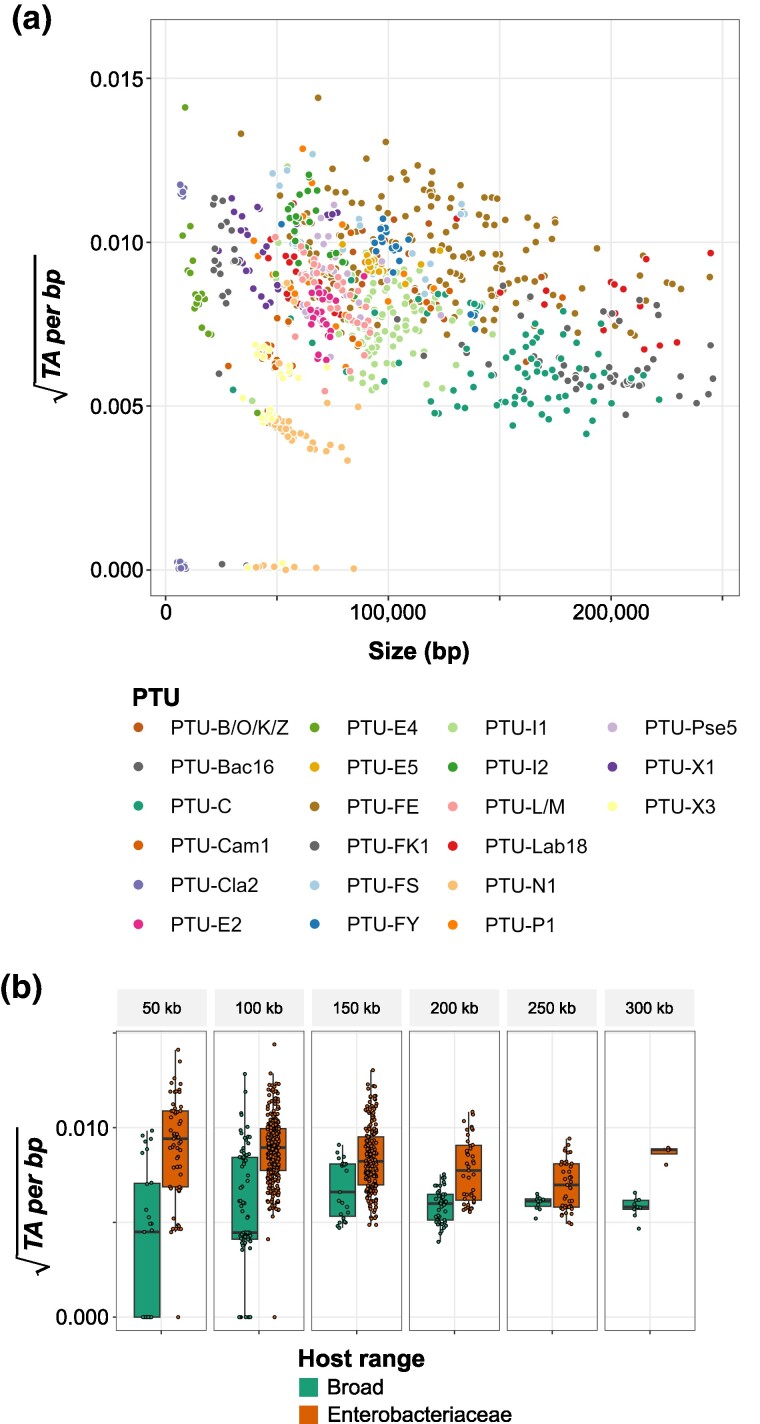
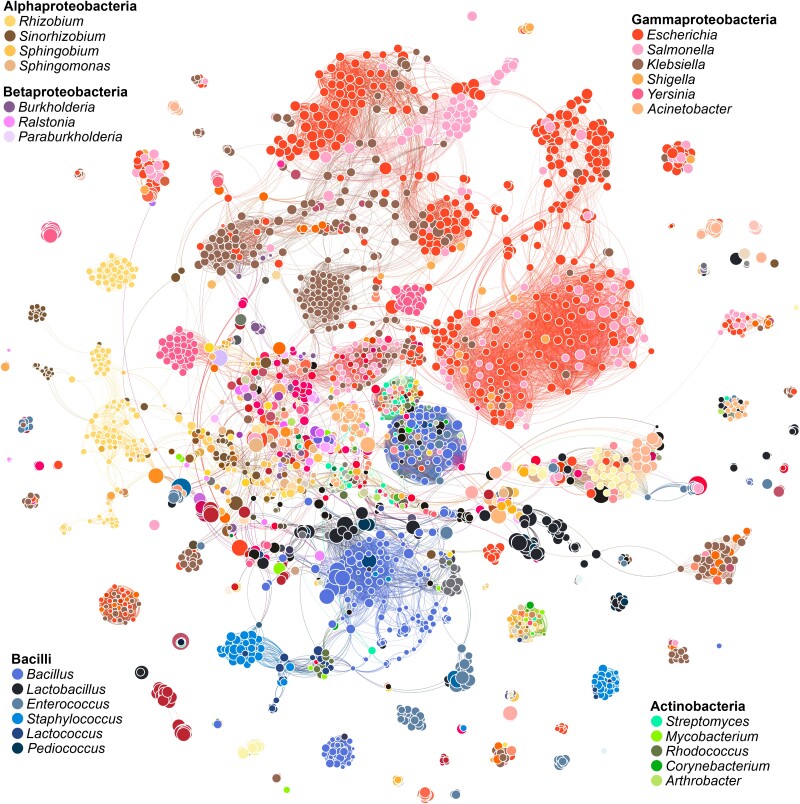
Bacterial evolution through horizontal gene transfer (HGT) reflects their community interactions. In this way, HGT networks do well at mapping community interactions, but offer little toward controlling them-an important step in the translation of synthetic strains into natural contexts. Toxin-antitoxin (TA) systems serve as ubiquitous and diverse agents of selection; however, their utility is limited by their erratic distribution in hosts. Here we examine the heterogeneous distribution of TAs as a consequence of their mobility. By systematically mapping TA systems across a 10,000 plasmid network, we find HGT communities have unique and predictable TA signatures. We propose these TA signatures arise from plasmid competition and have further potential to signal the degree to which plasmids, hosts, and phage interact. To emphasize these relationships, we construct an HGT network based solely on TA similarity, framing specific selection markers in the broader context of bacterial communities. This work both clarifies the evolution of TA systems and unlocks a common framework for manipulating community interactions through TA compatibility.

Keywords: community; horizontal gene transfer; network; plasmid; toxin–antitoxin system.


Conflict of interest statement

Conflict of Interest The authors declare no competing financial interests.

Figures

Fig. 1.
Fig. 1.
The distribution of toxins and antitoxins across plasmids. a) Histogram of plasmids with or without TAs by plasmid size. Bars are colored by total TAs. Toxins and antitoxins are considered separately such that 1 T and 1 A equals a TA value of 2. b) Total toxin and antitoxins by plasmid size. Plasmid data points are colored by their density. c) TA frequency boxplots across plasmid size ranges. Boxes are colored by median TA frequency and indicate 25, 50, and 75th percentiles. Whiskers extend to the maximum and minimum values within 1.5 times the interquartile region. d) TA frequency by total TAs. Boxes are colored by median TA frequency. e) Ratio of antitoxins to toxins per plasmid. Plasmid data points above the 1:1 parity line (solid) indicate more antitoxins than toxins and vice versa, colored according to A:T ratio value. Dashed line shows linear correlation.
Fig. 2.
Fig. 2.
Selection dynamics of TA systems. Each panel represents a plasmid competition scenario in which two plasmids (inner circles) cannot stably coexist within the same host cell. Numbers and colors reflect the number and type of TA systems in either plasmids or host chromosomes. The scenarios progress in a logical, but not necessary order. a) No TA systems are present, allowing either plasmid to win post-segregation. b) A plasmid acquires a TA system (TA+) and competes against a TA− plasmid, resulting in the TA+ plasmid winning or the TA− plasmid losing due to post-segregation toxin activity. c) Both plasmids acquire the same TA system, allowing either plasmid to win as long as they maintain it. d) Chromosomal integration of the TA system grants the host immunity against post-segregation killing by plasmids. Host immunity removes the competitive advantage of TA+ plasmids, allowing either plasmid to win while facilitating TA mutation, loss, or gain. e) Acquiring one novel TA more than the host and competitor combined (i.e. TA+1) restores the competitive TA advantage.
Fig. 3.
Fig. 3.
The distribution of toxins and antitoxins across a plasmid HGT network. a) The HGT network constructed by Redondo-Salvo et al with edges colored by TA similarity between plasmids. Each node represents a plasmid, and edges connect plasmids with ≥70% nucleotide identity over ≥50% of the smaller plasmid. b) Individual toxin and antitoxin distributions across the plasmid HGT network. Network colors indicate the presence of specific toxins or antitoxins. c) Boxplot distributions of TA similarities between every plasmid node, grouped by plasmid MOB type, Incompatibility group, or PTU. TA similarities are categorized as intra or inter, depending on whether the two plasmids are of the same group or not, respectively. Boxplots indicate 25, 50, and 75th percentiles with whiskers extending to the maximum and minimum values within 1.5 times the interquartile region. d) Boxplot distribution of TA similarities between plasmids from the same host taxonomic group.
Fig. 4.
Fig. 4.
Toxin and antitoxin prevalence by plasmid community. Percent of TA-carrying plasmids with specific TAs per PTU. Plasmids are grouped by PTU and points are sized by the average percent of TA-carrying plasmids with the specified TA across all PTUs. To reduce clutter, only PTUs with ≥10 plasmids and TAs with >0% prevalence are shown. Colors reflect the Y-axis prevalence percentage within PTUs.
Fig. 5.
Fig. 5.
Plasmid TA frequencies at community scales. a) TA frequencies by plasmid size across PTU communities. Each point represents one plasmid in a PTU community containing ≥20 plasmids. Points are colored by PTU. b) TA frequencies by plasmid size and host range. Each point represents one plasmid, colored by predicted host range based on Inc groups. Inc groups B/O/K/Z, F, H, I, and X are primarily found among Enterobacteriaceae and A/CII, L/M, N, and P groups have a broader host range. Binning is in 50 kb increments for relative plasmid size comparisons. Boxplots indicate 25, 50, and 75th percentiles, with whiskers extending to the maximum and minimum values within 1.5 times the interquartile region. Only plasmids between 7.5 and 300 kb are shown for clarity.
Fig. 6.
Fig. 6.
Plasmid TA network by bacterial host taxa. Nodes represent plasmids and edges indicate Sørensen distances ≤0.30. Colors represent plasmid host classes and shades represent genera within those classes. Node sizes correspond to TA frequency and edge thickness increases with TA similarity. Degree range is set to ≥4 for clarity and plasmids are required to have ≥3 TAs or be ≥30 kb to limit plasmid size effects on edge connections. The network graphic was generated using Gephi and the ForceAtlas 2 algorithm.

Similar articles

Cited by

References

    1. Acman M, van Dorp L, Santini JM, Balloux F. Large-scale network analysis captures biological features of bacterial plasmids. Nat Commun. 2020:11(1):2452. 10.1038/s41467-020-16282-w. - DOI - PMC - PubMed
    1. Akarsu H, Bordes P, Mansour M, Bigot DJ, Genevaux P, Falquet L. Tasmania: a bacterial toxin-antitoxin systems database. PLoS Comput Biol. 2019:15(4):e1006946. 10.1371/journal.pcbi.1006946. - DOI - PMC - PubMed
    1. Bastian M, Heymann S, Jacomy M. 2009. Gephi: an open source software for exploring and manipulating networks. Proceedings of the international AAAI Conference on Web and Social Media; May 17-20; San Jose, California, USA. p. 3.
    1. Bethke JH, Ma HR, Tsoi R, Cheng L, Xiao M, You L. Vertical and horizontal gene transfer tradeoffs direct plasmid fitness. Mol Syst Biol. 2023:19(2):e11300. 10.15252/msb.202211300. - DOI - PMC - PubMed
    1. Boss L, Kedzierska B. Bacterial toxin-antitoxin systems' cross-interactions-implications for practical use in medicine and biotechnology. Toxins (Basel). 2023:15(6):380. 10.3390/toxins15060380. - DOI - PMC - PubMed

MeSH terms

LinkOut - more resources