. 2024 Dec;119(6):957-971.
doi: 10.1007/s00395-024-01085-7. Epub 2024 Oct 15.

Oxidative stress initiates hemodynamic change in CKD-induced heart disease

Affiliations

Oxidative stress initiates hemodynamic change in CKD-induced heart disease

Payel Sen et al. Basic Res Cardiol. 2024 Dec.

Abstract

Chronic kidney disease (CKD) predisposes to cardiac remodeling and coronary microvascular dysfunction. Studies in swine identified changes in microvascular structure and function, as well as changes in mitochondrial structure and oxidative stress. However, CKD was combined with metabolic derangement, thereby obscuring the contribution of CKD alone. Therefore, we studied the impact of CKD on the heart and combined proteome studies with measurement of cardiac function and perfusion to identify processes involved in cardiac remodeling in CKD. CKD was induced in swine at 10-12 weeks of age while sham-operated swine served as controls. 5-6 months later, left ventricular (LV) function and coronary flow reserve were measured. LC-MS-MS-based proteomic analysis of LV tissue was performed. LV myocardium and kidneys were histologically examined for interstitial fibrosis and oxidative stress. Renal embolization resulted in mild chronic kidney injury (increased fibrosis and urinary NGAL). PV loops showed LV dilation and increased wall stress, while preload recruitable stroke work was impaired in CKD. Quantitative proteomic analysis of LV myocardium and STRING pre-ranked functional analysis showed enrichments in pathways related to contractile function, reactive oxygen species, and extracellular matrix (ECM) remodeling, which were confirmed histologically and associated with impaired total anti-oxidant capacity. H2O2 exposure of myocardial slices from CKD, but not normal swine, impaired contractile function. Furthermore, in CKD, mitochondrial proteins were downregulated suggesting mitochondrial dysfunction which was associated with higher basal coronary blood flow. Thus, mild CKD induces alterations in mitochondrial proteins along with contractile proteins, oxidative stress and ECM remodeling, that were associated with changes in cardiac function and perfusion.

Keywords: Cardiac remodeling; Chronic kidney disease; Coronary flow reserve; Oxidative stress; Proteomics.


Conflict of interest statement

Declarations. Conflict of interest: The authors declare that the research was conducted in the absence of any commercial or financial relationships that could be construed as a potential conflict of interest.

Figures

Fig. 1
Fig. 1
Induction of CKD through renal artery embolization. a Angiogram of swine kidney, taken before and after embolization with microspheres into the renal artery, using contrast at 10–12 weeks of age. b Representative renal artery flow using ultrasound before and after embolization at 10–12 weeks of age. c, d Representative images of Picro-sirius red (PR) staining in the kidneys from Con and CKD swine under bright field and polarizing light microscopy respectively post embolization at 8–9 months of age. The blue bubbles in the field indicate microspheres. Original magnification, × 200 e Quantification of the percentage of area positive for PR staining under polarizing light microscopy. f Quantification of urinary NGAL 5–6 months post embolization. N = 8 in Con, N = 7 in CKD. Values are mean + / − SEM. p value by Student’s t-test
Fig. 2
Fig. 2
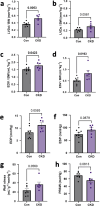
Hemodynamic assessment of the heart post CKD. a, b LV diastolic diameter (LVDd) and LV systolic diameter (LVDs) respectively, corrected for body weight measured via echocardiography. N = 7 animals in Con, N = 6 in CKD (c,d) End-diastolic (EDV) and systolic volume (ESV) corrected for body weight (e, f) end-diastolic (EDP) and end-systolic pressures (ESP) measured through PV loop. N = 9 animals in Con, N = 6 in CKD. g, h Systolic wall stress calculated by end-systolic PV loop measurements and post-mortem LV weight and Preload recruitable stroke work (PRSW). N = 8 animals in Con, N = 6 in CKD. Values are mean + / − SEM. p value by Student’s t-test
Fig. 3
Fig. 3
Proteomic analysis of LV endocardial tissue post CKD. a Quantitative proteome changes are represented via volcano plots in CKD vs Con animals. Color-filled circles (blue- upregulated, red downregulated, see also color-coding bar) indicate differentially abundant proteins (Benjamini– Hochberg-corrected p value < 0.05 and Fold change > 1.3). b Pre-ranked proteins according to the fold changes using differentially abundant proteins (p value < 0.05) are used to generate a Protein–Protein Interaction network using STRING software. String_kmeans _clustering presented three main clusters. The green-filled circles represent contractile proteins, yellow- mitochondrial, Red- Blood microparticles and ECM proteins. c Over-representation analysis using WebGestalt with gene sets according to Kyoto Encyclopedia of Genes and Genomes (KEGG) and gene ontology (GO) biological process databases. Benjamini–Hochberg method was used for multiple testing adjustment. Size of the bubble indicates the corresponding number of differentially abundant proteins (referred to as genes mapped in the figure) and color represents the significance of enrichment. n = 5 for Con and n = 4 for CKD pigs
Fig. 4
Fig. 4
Coronary flow and endothelial function in LV tissue post CKD. a Coronary blood flow during baseline, b during maximal vasodilation due to adenosine (i.c.) and c ratio of maximal flow to baseline flow (Coronary flow reserve) in Con and CKD groups N = 8 animals in Con, N = 6 in CKD. (d) Cardiac efficiency N = 8 animals in WT, N = 7 in CKD (eg) Quantitative RT-PCR of eNOS, representative blot and quantification of eNOS protein respectively in the LV endocardial tissue in Con and CKD groups. hj Quantitative RT-PCR of VEGF, representative blot and quantification of VEGF protein respectively in the LV endocardial tissue in Con and CKD groups. N = 7 animals in WT, N = 6 in CKD. Values are mean + / − SEM, p-value by Student’s t-test
Fig. 5
Fig. 5
Oxidative stress in LV tissue post CKD. a Representative images of immunofluorescence staining for 8-Hydroxy-2'-Deoxyguanosine (8HDG) in whole tissue in LV paraffin-embedded tissue in Con and CKD groups and b Quantification of number of nuclei positive for staining of 8HDG. Original magnification, × 400. c Representative images of immunofluorescence staining for 8HDG in CD31 stained vessel in LV paraffin-embedded tissue in Con and CKD groups and d Quantification of number of nuclei positive for staining of 8-HDG in CD31 stained vessels. Original magnification, × 400 N = 8 in Con, N = 7 in CKD Scale bar: 50 μm (25 μm for cropped image) eg Quantitative RT-PCR of NNT, SOD2, GPX3, in the LV endocardial tissue in Con and CKD groups. h Quantification of Trolox for antioxidative capacity in the LV tissue homogenate i) Quantification of secreted 8HDG in the urine at sacrifice. N = 7 in Con, N = 6 in CKD. Values are mean + / − SEM. p-value by Student’s t-test
Fig. 6
Fig. 6
Ex vivo culture of swine Living myocardial slices (LMS). a Image of LMS in a biomimetic cultivation chamber (BMCC). b LMS from Con and CKD treated with H2O2 at 24 h intervals. N = 3 in Con and N = 6 in CKD group ** p < 0.01, ***p < 0.001 2- way ANOVA, c LMS from CKD treated with Vehicle (Veh), H2O2, and Tempol at 24 h interval. **p < 0.01 for H2O2 vs Tempol, #p < 0.05 for Tempol vs Veh. 2-way ANOVA. N = 3 in Veh; N = 4 in TEMPOL and N = 6 in H2O2 group (ce) Quantitative RT-PCR of NNT, GPX3 and SOD2 mRNA in LMS from Con and CKD swine. N = 3 slices in each group. Values are mean + / − SEM. p-value by Student’s t-test
Fig. 7
Fig. 7
Remodeling in LV tissue post CKD. (a) Representative images of picrosirius red (PR) of the heart under bright field and (b) polarizing light respectively and (c) quantification of the area positive for PR staining under polarizing light (d–e) Quantitative RT-PCR of COl1 and MMP2 mRNA in the LV endocardial tissue in Con and CKD groups. N = 7 animals in Con, N = 6 in CKD. (g) Representative images of Gömöri staining under bright light microscopy for Con and CKD and (h) quantification of the cardiomyocyte area. Original magnification, × 200. Values are mean + / − SEM. p value by Student’s t-test
Fig. 8
Fig. 8
Early molecular and functional changes Post CKD in the heart

References

    1. Ali MAM, Cho WJ, Hudson B, Kassiri Z, Granzier H, Schulz R (2010) Titin is a target of matrix metalloproteinase-2: implications in myocardial ischemia/reperfusion injury. Circulation 122:2039–2047. 10.1161/CIRCULATIONAHA.109.930222 - PMC - PubMed
    1. Ammar C, Gruber M, Csaba G, Zimmer R (2019) MS-EmpiRe utilizes peptide-level noise distributions for ultra-sensitive detection of differentially expressed proteins. Mol Cell Proteom: MCP 18:1880–1892. 10.1074/mcp.RA119.001509 - PMC - PubMed
    1. Avner BS, Hinken AC, Yuan C, Solaro RJ (2010) H2O2 alters rat cardiac sarcomere function and protein phosphorylation through redox signaling. Am J Physiol - Heart Circ Physiol 299:723–730. 10.1152/ajpheart.00050.2010 - PMC - PubMed
    1. Breitkreuz M, Hamdani N (2015) A change of heart: oxidative stress in governing muscle function? Biophys Rev 7:321–341. 10.1007/s12551-015-0175-5 - PMC - PubMed
    1. Canton M, Neverova I, Menabò R, Van Eyk J, Di Lisa F (2004) Evidence of myofibrillar protein oxidation induced by postischemic reperfusion in isolated rat hearts. Am J Physiol Heart Circ Physiol 286:H870–H877. 10.1152/ajpheart.00714.2003 - PubMed

Publication types