Review
. 2024 Nov 21;45(44):4684-4699.
doi: 10.1093/eurheartj/ehae647.

The win ratio in cardiology trials: lessons learnt, new developments, and wise future use

Affiliations
Review

The win ratio in cardiology trials: lessons learnt, new developments, and wise future use

Stuart J Pocock et al. Eur Heart J. .

Abstract

The win ratio method for analysing a composite clinical hierarchy of outcomes is growing in popularity especially in cardiovascular trials. This article gives a perspective on its use so far and the issues derived from that experience. Specifically, it focuses on the limitations of a conventional composite outcome; how does the win ratio work, what does it mean, and how to display its findings; guidance on choosing an appropriate clinical hierarchy of outcomes including clinical events, quantitative outcomes, and other options; the additional value of the win difference as a measure of absolute benefit: extension to stratified win ratio, subgroup analysis, matched win ratio, and covariate adjustment; determining trial size for a win ratio outcome; specific insights such as adaptive designs, use of repeat events, and use of margins and time averages for quantitative outcomes; a critique of potential misuses; availability of statistical software; and a statistical appendix on the methodological details. Throughout, each principle is illustrated by examples from specific cardiology trials. The article concludes with a set of recommendations for future use of the win ratio.

Keywords: Clinical trial; Hierarchical composite outcome; Presentation and interpretation; Statistical methods; Systematic review; Win ratio.


Figures

Graphical Abstract
Graphical Abstract
The graphical abstract figure explains the win ratio method, its advantages over conventional time-to-first event analysis of composite outcomes, and provides recommendations for future use of the win ratio in the design, analysis, and reporting of clinical trials. CI, confidence interval.
Figure 1
Figure 1
Four examples of hierarchical composite outcomes reflecting clinical priorities that have been used by randomized trials using the win ratio. (A) has two levels: time to death followed by time to first hospitalization; In (B), which also has two levels, time to first hospitalization has been replaced with number of hospitalizations. (C) has four levels; time to death, followed by time to stroke; then time to myocardial infarction; and finally time to coronary revascularization. (D) has three levels where the first two are time to events and the third level is a quantitative outcome, e.g. change from baseline in a 6-min walk test distance
Figure 2
Figure 2
A schema showing nine patient pair (A, B) scenarios illustrating all the options that can arise for the simplest win ratio of the composite hierarchy of time to death and time to hospitalization. In the first set of three scenarios, A wins on the first level of the hierarchy, time to death, since B dies earlier and within the shared follow-up time. In the second set of three scenarios, A wins on the second level of the hierarchy, time to hospitalization. Note that although in the second of this set of scenarios A dies whereas B does not, the death occurs outside the shared follow-up time and is therefore ignored for this patient pair comparison. In the final set of scenarios, neither patient wins on either death or hospitalization and therefore they are tied
Figure 3
Figure 3
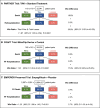
Three examples ((A) PARTNER, (B) COAPT, and (C) EMPEROR-Preserved) of a two-level hierarchy win ratio analysis for a hierarchical composite of time to death and then time to a non-fatal event, hospitalization. Each panel shows the number of patients in each treatment group and the total number of patient pair comparisons. The green and red boxes show the percentage of all patient pair comparisons that were wins or losses, respectively, for the active arm. The blue boxes show the percentage of ties. The right-hand column gives win differences both overall and for each component. TAVI, transcatheter aortic valve implantation; CI, confidence interval
Figure 4
Figure 4
Examples of three trials (A) EMPULSE,, (B) TRILUMINATE, and (C) ATTRibute-CM that extended the win ratio to include quantitative outcomes. Each panel shows the number of patients in each treatment group and the number of patient pair comparisons. The green and red boxes show the percentage of all patient pair comparisons that were wins or losses, respectively, for the active arm. The blue boxes show the percentage of ties. The right-hand column gives win differences both overall and for each component. HF, heart failure; KCCQ-TSS, Kansas City Cardiomyopathy Questionnaire-Total Symptom Score; CI, confidence interval; TEER, transcatheter edge-to-edge repair; TV, tricuspid valve
Figure 5
Figure 5
Two alternative ways of plotting win ratio findings from the DAPA-MI trial. (A), from the trial publication, shows the cumulative results over the hierarchy, but does not explicitly show the percentage of ties. (B), adopting the style most commonly used, shows the percentage of wins, losses, and ties at each level of the hierarchy. The right column helps clarify what is happening by showing the win difference at each level. DAPA, dapagliflozin; CI, confidence interval; NYHA, New York Heart Association
Figure 6
Figure 6
An example of a post hoc win ratio analysis of 24-h ambulatory systolic blood pressure and medication burden in the SPYRAL HTN-ON MED trial. The primary endpoint, mean change in ambulatory systolic blood pressure over 6 months, did not reach statistical significance. Increases in medication intensity among sham controls were substantial, diluting a true effect. Hence, this post hoc win ratio analysis has hierarchy (i) change in ambulatory systolic blood pressure at 6 months, with a margin of 5 mmHg, and (ii) change in medication burden at 6 months, with no margin. SBP, systolic blood pressure; CI, confidence interval; hr, hour
Figure 7
Figure 7
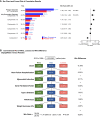
The stratified win ratio in the EMPULSE trial,: combining win ratio estimates for the two strata into an overall estimate. (A) shows details of the win ratio analysis for each stratum (de novo and decompensated chronic patients) with stratum-specific win ratios and an overall stratified win ratio. (B) shows the stratum-specific win ratios with 95% confidence intervals and an interaction P-value, plus the overall stratified win ratio with 95% confidence interval. Empa, empagliflozin; HF, heart failure; KCCQ-TSS, Kansas City Cardiomyopathy Questionnaire-Total Symptom Score; CI, confidence interval

References

    1. Pocock SJ, Ariti CA, Collier TJ, Wang D. The win ratio: a new approach to the analysis of composite endpoints in clinical trials based on clinical priorities. Eur Heart J 2012;33:176–82. 10.1093/eurheartj/ehr352 - DOI - PubMed
    1. Gregson J, Stone GW, Bhatt DL, Packer M, Anker SD, Zeller C, et al. Recurrent events in cardiovascular trials: JACC state-of-the-art review. J Am Coll Cardiol 2023;82:1445–63. 10.1016/j.jacc.2023.07.024 - DOI - PubMed
    1. Ferreira JP, Jhund PS, Duarte K, Claggett BL, Solomon SD, Pocock S, et al. Use of the win ratio in cardiovascular trials. JACC Heart Fail 2020;8:441–50. 10.1016/j.jchf.2020.02.010 - DOI - PubMed
    1. Redfors B, Gregson J, Crowley A, McAndrew T, Ben-Yehuda O, Stone GW, et al. The win ratio approach for composite endpoints: practical guidance based on previous experience. Eur Heart J 2020;41:4391–9. 10.1093/eurheartj/ehaa665 - DOI - PubMed
    1. van Dijk PC, Jager KJ, Zwinderman AH, Zoccali C, Dekker FW. The analysis of survival data in nephrology: basic concepts and methods of Cox regression. Kidney Int 2008;74:705–9. 10.1038/ki.2008.294 - DOI - PubMed