. 2024 Nov 22;9(22):e181686.
doi: 10.1172/jci.insight.181686.

Loss of PADI2 and PADI4 ameliorates sepsis-induced acute lung injury by suppressing NLRP3+ macrophages

Affiliations

Loss of PADI2 and PADI4 ameliorates sepsis-induced acute lung injury by suppressing NLRP3+ macrophages

Xin Yu et al. JCI Insight. .

Abstract

Sepsis-induced acute lung injury (ALI) is prevalent in patients with sepsis and has a high mortality rate. Peptidyl arginine deiminase 2 (PADI2) and PADI4 play crucial roles in mediating the host's immune response in sepsis, but their specific functions remain unclear. Our study shows that Padi2-/- Padi4-/- double KO (DKO) improved survival, reduced lung injury, and decreased bacterial load in Pseudomonas aeruginosa (PA) pneumonia-induced sepsis mice. Using single-cell RNA-Seq (scRNA-Seq), we found that the deletion of Padi2 and Padi4 reduced the Nlrp3+ proinflammatory macrophages and fostered Chil3+ myeloid cell differentiation into antiinflammatory macrophages. Additionally, we observed the regulatory role of the NLRP3/Ym1 axis upon DKO, confirmed by Chil3 knockdown and Nlrp3-KO experiments. Thus, eliminating Padi2 and Padi4 enhanced the polarization of Ym1+ M2 macrophages by suppressing NLRP3, aiding in inflammation resolution and lung tissue repair. This study unveils the PADIs/NLRP3/Ym1 pathway as a potential target in treatment of sepsis-induced ALI.

Keywords: Bacterial infections; Immunology; Inflammation; Macrophages; Surgery.


Conflict of interest statement

Conflict of interest: The authors have declared that no conflict of interests exists.

Figures

Figure 1
Figure 1. Protective effect of Padi2 and Padi4 deficiency against acute lung injury in a PA pneumonia–induced sepsis mouse model.
(A) Kaplan-Meier survival rate of WT and DKO mice following intranasal inoculation with Pseudomonas aeruginosa (PA) at a dose of 2.5 × 10⁶ CFU per mouse. Survival was monitored for a period of 10 days after inoculation (n = 10 mice/group). Values are expressed as a survival percentage. (B) Histopathological examination of lung injury. The left panel presents H&E-stained lung tissue sections from WT and DKO mice 24 hours after PA inoculation (n = 4–5 mice/group). The right panel shows quantified acute lung injury (ALI) scores. Scale bars: 100 μm. (C) Bacterial loads measured in the blood and BALF of WT and DKO mice 24 hours after PA inoculation (n = 5 mice/group). Data from A were analyzed using log rank tests. Data from B and C were analyzed using unpaired Student’s t tests. Results are presented as means ± SEM. *P < 0.05; ***P <.001.
Figure 2
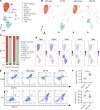
Figure 2. Identification of distinct immune cell subpopulations in BALF via scRNA-Seq in PA pneumonia–induced sepsis model.
(A) Nonlinear dimensionality reduction Uniform Manifold Approximation and Projection (UMAP) analysis of 22,917 BALF cells from WT and DKO mice reveals 10 distinct clusters following unsupervised clustering. Each dot represents an individual cell, with coloring indicating cluster assignment. BALF cells from 3 mice were mixed as 1 sample for each group, including WT-sham, WT-PA, DKO-sham, and DKO-PA groups. (B) Experimental group–based UMAP visualization of WT-sham, WT-PA, DKO-sham, and DKO-PA. This visualization highlights the distinct immune landscapes present in the 2 mouse models, both with and without PA infection (n = 3 mice/group). (C) Distribution of cell subtype proportions among all cell populations in each experimental group (n = 3 mice/group). (D) UMAP gene expression patterns for key immune markers — Adgre1 (F4/80) and Itgax (CD11c) for resident macrophages and Ly6c2 (Ly6C), Ly6g (Ly6G), and Itgam (CD11b) for recruited myeloid cells. Regions with purple shading denote higher expression levels of these markers. (E) scRNA-Seq results validated by flow cytometry. The upper panel focuses on resident macrophages, identified by F4/80+CD11c+, and the lower panel on recruited myeloid cells, identified by Gr1+CD11b+ (Gr1 including 2 isoforms of Ly6C and Ly6G). (F) Cell population difference between the WT-PA and DKO-PA by flow cytometry (n = 3–6 mice/group). Results are representative of 3 independent experiments. Data were analyzed using unpaired Student’s t tests and are presented as mean ± SEM. *P < 0.05.
Figure 3
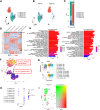
Figure 3. Discovery of a unique proinflammatory macrophage population (C12) reduced by Padi2 and Padi4 deficiency.
(A) UMAP analysis of 7 distinct subclusters (C1, C3, C4, C7, C10, C12, and C14) of macrophages and DCs from WT and DKO mice across sham and PA conditions, with each cluster color-coded for identification (n = 3 mice/group). (B) Experimental group based UMAP visualization of macrophages and DCs from WT Sham, WT PA, DKO Sham, and DKO PA groups (n = 3 mice/group). (C) Distribution of cell subtype proportions among macrophage/DC populations in each experimental group (n = 3 mice/group). (D) Enrichment analysis of representative Gene Ontology (GO) biological pathways for C12 alveolar macrophages (AMs). (E) Expression profiles of proinflammatory genes (Ccl4, Il1b, Tnf, Il1a, Il6, Nlrp3, and Cxcl1) across macrophage/DC clusters, illustrated by violin plots. (F) Comparative expression of proinflammatory genes (Tnf, Il1a, Il6, Ccl4, Il1b, Nlrp3, and Cxcl1) in macrophages/DCs from WT and DKO mice under sham and PA groups, illustrated by violin plots (n = 3 mice/group).
Figure 4
Figure 4. Padi2 and Padi4 deficiency favors the differentiation of Chil3+ myeloid cells toward macrophages.
(A) UMAP analysis of 5 subclusters (C0, C2, C5, C6, C13) of 10,364 myeloid cells from WT and DKO mice in PA-induced sepsis model, with each cluster color-coded for identification (n = 3 mice/group). (B) Experimental group–based UMAP visualization of myeloid cells from WT PA and DKO PA groups (n = 3 mice/group). (C) Distribution of cell subtype proportions among myeloid cell populations in WT PA and DKO PA groups (n = 3 mice/group). (D) Heatmap representation of gene expression within the myeloid cell compartment from WT and DKO mice in PA-induced sepsis condition, annotated by cluster types. (E) Enrichment analysis of representative GO biological pathways for C2 and C13 myeloid cells. (F) Developmental trajectory and pseudotime reconstruction of all myeloid-derived cells, including macrophages, myeloid cells, and DCs, as inferred by Monocle 3, provide insights into cell differentiation pathways. (G) Pseudotime plot illustrating the expression of Chil3 and Mrc1 genes across all myeloid-derived cell populations, mapping changes in gene expression over pseudotime. (H) Coexpression patterns of Nlrp3 and Chil3 genes across distinct cell cluster populations, illustrated in a dot plot for a comparative overview. (I) Expression visualization of Nlrp3 and Chil3 genes across all cluster populations. Heatmap represents the relative gene expression levels.
Figure 5
Figure 5. Resolution of inflammation prompted by Chil3+ myeloid cells through differentiation into M2 macrophages.
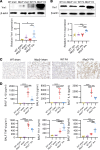
(A) Violin plots depicting the expression levels of Chil3 and Mrc1 genes across myeloid cell clusters in the WT PA and DKO PA groups (n = 3 mice/group). (B) qPCR analysis of Chil3 and Mrc1 gene expression in BALF cell lysates from WT and DKO mice 24 hours after PA inoculation (n = 5–8 mice/group). (C) Western blot analysis for Ym1 and CD206 proteins in BALF cell lysates from WT and DKO mice 24 hours after PA inoculation (n = 5–6 mice/group). Relative protein expression levels are shown on the right panel. (D) IHC staining for Ym1 in lung tissues of WT and DKO mice within the PA-induced sepsis group. A zoomed-in view reveals Ym1hi myeloid cell from DKO mice (n = 3 mice/group). Scale bars: 50 μm (upper panels); 25 μm (lower panels). (E) ELISA results showing concentrations of M1-related markers (TNF-α, KC, IL-6, and MIP-1β) in the BALF and serum of WT and DKO mice 24 hours after PA inoculation (n = 5 mice/group). (F) ELISA results showing concentrations of M2-related markers (Ym1 and TGF-β) in the BALF and serum of WT and DKO mice 24 hours after PA inoculation (n = 5–7/group). Results in BF were representative of at least 3 independent experiments. Data for all bar charts were analyzed using unpaired Student’s t tests or 1-way ANOVA. Data are presented as means ± SEM. *P < 0.05; **P < 0.01; ***P < 0.001; ****P < 0.0001.
Figure 6
Figure 6. Regulation of the NLRP3/Ym1 pathway by DKO of Padi2 and Padi4 genes.
(A) qPCR analysis of Nlrp3 gene expression in BALF cell lysates from WT and DKO mice across sham and 24 hours after PA inoculation (n = 3 mice/group). (B) Western blot analysis demonstrating NLRP3, ASC, and Caspase-1 proteins expression levels in BALF cells from WT and DKO mice, both under sham conditions and 24 hours after PA inoculation (n = 5 mice/group). (C) ELISA results displaying concentrations of NLRP3 inflammasome–related cytokines (IL-1β and IL-18) in the BALF and serum of WT and DKO mice across sham and 24 hours after PA inoculation (n = 5 mice/group). (D) Western blot analysis showing the expression of Ym1, iNOS, NLRP3, ASC, and Caspase-1 proteins in bone marrow–derived macrophages (BMDMs) from WT and DKO mice, under both control conditions and after LPS treatment (250 ng/mL, 24 hours, n = 3–5/group). (E) ELISA results showing concentrations of IL-1β and TNF-α in cell culture supernatants of negative control siRNA (siNC) or Chil3-knockdown siRNA (siChil3) transfected WT BMDMs and DKO BMDMs after 24 hours of LPS treatment (n = 4/group). (F) Immunofluorescence analysis of NLRP3 expression in BMDMs from WT and DKO mice treated with LPS (250 ng/mL, 24 hours) compared with control (n = 5/group), with cells stained for NLRP3 (in red) and nuclei counterstained with DAPI (in blue). Results are representative of 3 independent experiments. Data for all bar charts were analyzed using 1-way ANOVA and are presented as means ± SEM. *P < 0.05; **P < 0.01; ***P < 0.001; ****P < 0.0001. Scale bars: 25 μm.
Figure 7
Figure 7. Validation of the NLRP3/Ym1 axis in Nlrp3-KO mice.
(A) Western blot analysis comparing the expression of NLRP3 and Ym1 proteins in BALF cell lysates from WT and Nlrp3–/– mice, both under sham conditions and 24 hours after PA inoculation (n = 5–6 mice/group). (B) Western blot analysis comparing the expression of NLRP3 and Ym1 proteins in BMDMs from WT and Nlrp3–/– mice, following treatment with PA bacteria (MOI, 100; 1 hour) versus control (n = 5/group). (C) IHC staining depicting Ym1 expression and localization in lung tissue from WT and Nlrp3–/– mice (n = 3 mice/group). (D) ELISA results showing levels of NLRP3 inflammasome–related cytokines (IL-1β and IL-18), M1-related cytokines (TNF-α and IL-6), and M2-related cytokines (Ym1 and TGF-β) in BALF from WT and Nlrp3–/– mice, across sham conditions and 24 hours after PA inoculation (n = 5 mice/group). Results are representative of 3 independent experiments. Data for all bar charts were analyzed using 1-way ANOVA and are presented as means ± SEM. *P < 0.05; **P < 0.01; ***P < 0.001; ****P < 0.0001. Scale bars: 50 μm.

References

    1. Singer M, et al. The Third International Consensus definitions for sepsis and septic shock (Sepsis-3) JAMA. 2016;315(8):801–810. doi: 10.1001/jama.2016.0287. - DOI - PMC - PubMed
    1. Fleischmann-Struzek C, et al. Incidence and mortality of hospital- and ICU-treated sepsis: results from an updated and expanded systematic review and meta-analysis. Intensive Care Med. 2020;46(8):1552–1562. doi: 10.1007/s00134-020-06151-x. - DOI - PMC - PubMed
    1. Kumar V, Chhibber S. Acute lung inflammation in Klebsiella pneumoniae B5055-induced pneumonia and sepsis in BALB/c mice: a comparative study. Inflammation. 2011;34(5):452–462. doi: 10.1007/s10753-010-9253-9. - DOI - PubMed
    1. Martin G, et al. The international PROGRESS registry of patients with severe sepsis: drotrecogin alfa (activated) use and patient outcomes. Crit Care. 2009;13(3):R103. doi: 10.1186/cc7936. - DOI - PMC - PubMed
    1. Zakhour J, et al. Antimicrobial Treatment of Pseudomonas aeruginosa Severe Sepsis. Antibiotics (Basel) 2022;11(10):1432. doi: 10.3390/antibiotics11101432. - DOI - PMC - PubMed

MeSH terms

Substances