. 2024 Oct 15;134(23):e169722.
doi: 10.1172/JCI169722.

Adipocyte lipin 1 expression associates with human metabolic health and regulates systemic metabolism in mice

Affiliations

Adipocyte lipin 1 expression associates with human metabolic health and regulates systemic metabolism in mice

Andrew LaPoint et al. J Clin Invest. .

Abstract

Dysfunctional adipose tissue is believed to promote the development of hepatic steatosis and systemic insulin resistance, but many of the mechanisms involved are still unclear. Lipin 1 catalyzes the conversion of phosphatidic acid to diacylglycerol, the penultimate step of triglyceride synthesis, which is essential for lipid storage. Herein we found that adipose tissue LPIN1 expression is decreased in people with obesity compared with lean subjects, and low LPIN1 expression correlated with multi-tissue insulin resistance and increased rates of hepatic de novo lipogenesis. Comprehensive metabolic and multiomic phenotyping demonstrated that adipocyte-specific Lpin1-/- mice had a metabolically unhealthy phenotype, including liver and skeletal muscle insulin resistance, hepatic steatosis, increased hepatic de novo lipogenesis, and transcriptomic signatures of metabolically associated steatohepatitis that was exacerbated by high-fat diets. We conclude that adipocyte lipin 1-mediated lipid storage is vital for preserving adipose tissue and systemic metabolic health, and its loss predisposes mice to metabolically associated steatohepatitis.

Keywords: Diabetes; Hepatology; Insulin signaling; Metabolism; Obesity.


Conflict of interest statement

Conflict of interest: BNF is a shareholder in and a member of the Scientific Advisory Board for Cirius Therapeutics. JRB is a member of the Scientific Advisory Board of LUCA Science Inc.; receives research support from LUCA Science and Edgewise Therapeutics; is a consultant for Columbus Instruments Inc.; has consulted for DeciBio within the past 12 months; receives royalties from Springer Nature Group; is an inventor on technology licensed to Columbus Instruments Inc. with royalty rights; and is an inventor on pending patent applications related to the treatment of metabolic and allergic diseases (63/625,555 and US20210128689A1). SK serves on Scientific Advisory Boards for Merck, Abbvie, and Boehringer Ingelheim.

Figures

Figure 1
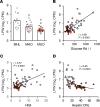
Figure 1. Abdominal adipose tissue LPIN1 gene expression is decreased in people with metabolically unhealthy obesity and LPIN1 expression correlates with metabolic health.
(A) Gene expression of LPIN1 from subcutaneous abdominal adipose tissue (SAAT) determined by RNA sequencing in metabolically healthy lean (MHL; n = 14), metabolically healthy obese (MHO; n = 22), and metabolically unhealthy obese (MUO; n = 25) groups. Data are expressed as means ± SEM. One-way ANOVA was used to compare LPIN1 expression among MHL, MHO, and MUO groups with Fisher’s least significant difference post hoc procedure used to identify significant mean differences. #P < 0.05 vs. MHL and †P < 0.05 vs. MUO. (BD) Relationship between SAAT LPIN1 expression and skeletal muscle insulin sensitivity (glucose rate of disappearance relative to plasma insulin concentration during the hyperinsulinemic-euglycemic clamp procedure [glucose Rd/I]), hepatic insulin sensitivity index (HISI), and contribution from hepatic de novo lipogenesis (DNL) to plasma triglyceride-palmitate. Logarithmic regression analysis was used to determine the line best fit to the data.
Figure 2
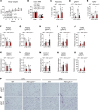
Figure 2. Adipocyte-specific Lpin1-knockout mice have reduced adiposity and signs of adipose tissue dysfunction.
Eight-week-old male adipocyte-specific Lpin1-knockout mice (Adn-Lpin1–/–) and their wild-type littermate controls (WT) were fed either a 10% low-fat diet (LFD) or a 60% high-fat diet (HFD) for 5 weeks. Mice were fasted for 4 hours before sacrifice and tissue collection. (A) Body weights of mice during diet feeding. (B) Body composition was measured in fed mice after 5 weeks of diet via EchoMRI. (C) Adiposity was calculated as percentage fat mass/total body weight. (D and E) Tissue weight of gonadal white adipose tissue (gWAT) and inguinal white adipose tissue (iWAT) expressed as percentage body weight. (FO) gWAT and iWAT gene expression was determined by quantitative PCR and is expressed as relative abundance. Pparg1, peroxisome proliferator–activated receptor γ-1; Adipoq, adiponectin; Col1a1, collagen type I α1 chain; Tgfb1, transforming growth factor-β1; Cd68, cluster of differentiation 68. (P and Q) Representative images at ×10 original magnification of gWAT and iWAT that were fixed in formalin before paraffin embedding, sectioning, and staining with H&E. Data are expressed as means ± SEM, and significance was determined by 2-way ANOVA with post hoc Tukey’s multiple-comparison tests. #P < 0.05 for WT vs. Adn-Lpin1–/– and †P < 0.05 for LFD vs. HFD (n = 5–9).
Figure 3
Figure 3. Adn-Lpin1–/– mice have similar metabolic energetics to WT mice.
Eight-week old male mice were fed an LFD (n = 5–8) or HFD (n = 7–10) for 5 weeks before indirect calorimetry analysis. Mice were acclimated for 5 days before metabolic measurements. (A) Body weight changes over 8 days of indirect calorimetry housing. (B) Energy intake averaged over 8 days calculated as kcal/g/24 h. (CH) All data were calculated as the 24-hour average over the last 3 days of indirect calorimetry housing. (CE) Total energy expenditure (EE), resting EE, and non-resting EE were calculated as the 24-hour average for the last 3 days. (F) Respiratory quotient (RQ) (VCO2/VO2). (G and H) Activity was calculated as average beam breaks (X, Y, and Z). All data are expressed as means ± SEM, and significance was determined by 2-way ANOVA with post hoc Tukey’s multiple-comparisons tests. †P < 0.05 for LFD vs. HFD (n = 5–10).
Figure 4
Figure 4. Adn-Lpin1–/– mice exhibit systemic insulin resistance on HFD.
Eight-week-old male Adn-Lpin1–/– and WT control mice were fed a 60% HFD for 5 weeks. Five days before clamp, mice were catheterized and allowed to recover. Mice were fasted 5 hours before the clamp procedures as described in detail in Methods. (A) Blood glucose was monitored before and during the clamp and shows that both groups reached and sustained similar steady-state glucose concentrations during the clamp procedure. (B) Exogenous glucose infusion rates (GIR) were measured during the clamp procedure. (C) Endogenous glucose production (rate of appearance [Ra]) was determined from steady-state equations. (D) Whole-body glucose flux (disposal [Rd]) was determined from steady-state equations. (E) High tissue-specific glucose uptake (Rg). (F) Low tissue-specific glucose uptake (Rg). (G) Plasma insulin was measured by radioimmunoassay at –10 minutes for fasting, and 90 and 120 minutes were averaged for clamp values. (H) Ra was plotted against plasma insulin concentrations before and during the clamp. (I) Rd was plotted against plasma insulin concentrations before and during the clamp. (J) Plasma concentrations of non-esterified free fatty acids (NEFA) measured at fasting and clamp and represented as percent suppression from fasting. (K) Plasma concentrations of glycerol measured at fasting and during the clamp and represented as percent suppression from fasting. Data are expressed as means ± SEM, and significance was determined by Student’s t test (A, B, E, F, H, I, J inset, and K inset) or 2-way ANOVA with post hoc Tukey’s multiple-comparison tests where appropriate (C, D, G, J, and K). #P < 0.05 for WT vs. Adn-Lpin1–/– and †P < 0.05 for LFD vs. HFD (n = 5–6).
Figure 5
Figure 5. Loss of adipocyte Lpin1 leads to severe hepatic lipid accumulation.
Eight-week-old male Adn-Lpin1–/– and WT control mice were fed either a 10% LFD or a 60% HFD for 5 weeks. Mice were fasted for 4 hours before sacrifice and tissue collection. (A) Liver weight expressed as percentage of body weight. Data are expressed as means ± SEM, and significance was determined by 2-way ANOVA with post hoc Tukey’s multiple-comparison tests. #P < 0.05 for WT vs. Adn-Lpin1–/– (n = 7–9). (B) Representative images at ×4 and ×20 original magnification of liver tissue that was fixed in formalin before paraffin embedding, sectioning, and staining with H&E. (C and D) Liver (C) and gastrocnemius (Gastroc) (D) diacylglycerol (DAG) and triglyceride (TAG) were extracted, and the relative abundance of each species was determined by liquid chromatography–tandem mass spectrometry (LC-MS/MS) against an internal standard. Data are expressed as mean fold change from the control LFD-fed mice (n = 7–9). (E) Total palmitate was analyzed by LC-MS for isotope mass abundance, and MIDA was used to calculate palmitate fractional synthesis rate (percent newly synthesized). Data are expressed as means ± SEM, and significance was determined by Student’s t test. #P < 0.05 for WT vs. Adn-Lpin1–/– (n = 5–8).
Figure 6
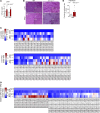
Figure 6. Bulk RNA sequencing analysis reveals significant changes in genetic pathways related to transition from early-stage fatty liver to MASH.
Eight-week-old male Adn-Lpin1–/– and WT control mice were fed either a 10% LFD or a 60% HFD for 5 weeks. Mice were fasted for 4 hours before sacrifice, liver collection, RNA isolation, and bulk RNA sequencing. (A and B) Volcano plots of merged differential expression data were graphed as log2 fold change versus –log10 unadjusted P value. The color of the data points corresponds to the module eigengenes into which each gene clusters based on hierarchical clustering. (C) Select gene modules and the number of genes in each module from weighted gene coexpression network analysis (WGCNA). (D) Select signification modules and their correlation to phenotypic traits from the mice used to generate the WGCNA data. Pearson’s correlation coefficient was used to determine association with the WGCNA modules and trait data. *P < 0.05 (n = 6).
Figure 7
Figure 7. WGCNA analysis reveals significant correlations between modules and hepatic lipid species.
Eight-week-old male Adn-Lpin1–/– and WT control mice were fed either a 10% LFD or a 60% HFD for 5 weeks. Mice were fasted for 4 hours before sacrifice, liver collection, RNA isolation, and bulk RNA sequencing. (A and B) Select signification modules and their correlation to DAG (A) and TAG (B) species from the lipidomics analysis. Pearson’s correlation coefficient was used to determine association with the WGCNA modules and trait data (n = 6).
Figure 8
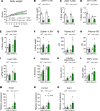
Figure 8. Loss of adipocyte Lpin1 predisposes mice toward MASH.
Eight-week-old male mice were fed a diet high in fructose (17 kcal %), fat (mostly palm oil, 40 kcal %), and cholesterol (2%) (HFHF-C) or a matched sucrose, high-sugar (dextrose), low-fat (10 kcal % fat) control diet (HSLF) for 16 weeks. Mice were fasted for 4 hours before sacrifice and tissue collection. (A) Weekly body weights. (BF) Individual tissue weights expressed as percentage total body weight. (G and H) Plasma alanine transferase (ALT) and aspartate aminotransferase (AST) were measured using liquid kinetic assays. (I) Liver lipids were extracted and quantified using a colorimetric enzymatic assay. (JL) H&E-stained liver sections were scored by an independent clinical pathologist. NAFL, nonalcoholic fatty liver. (MO) Gene expression was determined by quantitative PCR and is expressed as relative abundance. Timp1, tissue inhibitor of metalloproteinase 1; Col1a1, collagen type I α1 chain; Spp1, secreted phosphoprotein 1. Data are expressed as means ± SEM, and significance was determined by 2-way ANOVA and post hoc Tukey’s or Šidák’s multiple-comparison tests. #P < 0.05 for WT vs. Adn-Lpin1–/– and †P < 0.05 for HSLF vs. HFHF-C diet (n = 7–9).

Update of

References

    1. Koh HCE, et al. Heterogeneity in insulin-stimulated glucose uptake among different muscle groups in healthy lean people and people with obesity. Diabetologia. 2021;64(5):1158–1168. doi: 10.1007/s00125-021-05383-w. - DOI - PMC - PubMed
    1. Matsuda M, DeFronzo RA. Insulin sensitivity indices obtained from oral glucose tolerance testing: comparison with the euglycemic insulin clamp. Diabetes Care. 1999;22(9):1462–1470. doi: 10.2337/diacare.22.9.1462. - DOI - PubMed
    1. Korenblat KM, et al. Liver, muscle, and adipose tissue insulin action is directly related to intrahepatic triglyceride content in obese subjects. Gastroenterology. 2008;134(5):1369–1375. doi: 10.1053/j.gastro.2008.01.075. - DOI - PMC - PubMed
    1. Mitra MS, et al. Mice with an adipocyte-specific lipin 1 separation-of-function allele reveal unexpected roles for phosphatidic acid in metabolic regulation. Proc Natl Acad Sci U S A. 2013;110(2):642–647. doi: 10.1073/pnas.1213493110. - DOI - PMC - PubMed
    1. Nadra K, et al. Cell autonomous lipin 1 function is essential for development and maintenance of white and brown adipose tissue. Mol Cell Biol. 2012;32(23):4794–4810. doi: 10.1128/MCB.00512-12. - DOI - PMC - PubMed

MeSH terms