. 2024 Oct 15;134(23):e175305.
doi: 10.1172/JCI175305.

The Nr4a family regulates intrahepatic Treg proliferation and liver fibrosis in MASLD models

Affiliations

The Nr4a family regulates intrahepatic Treg proliferation and liver fibrosis in MASLD models

Daisuke Aki et al. J Clin Invest. .

Abstract

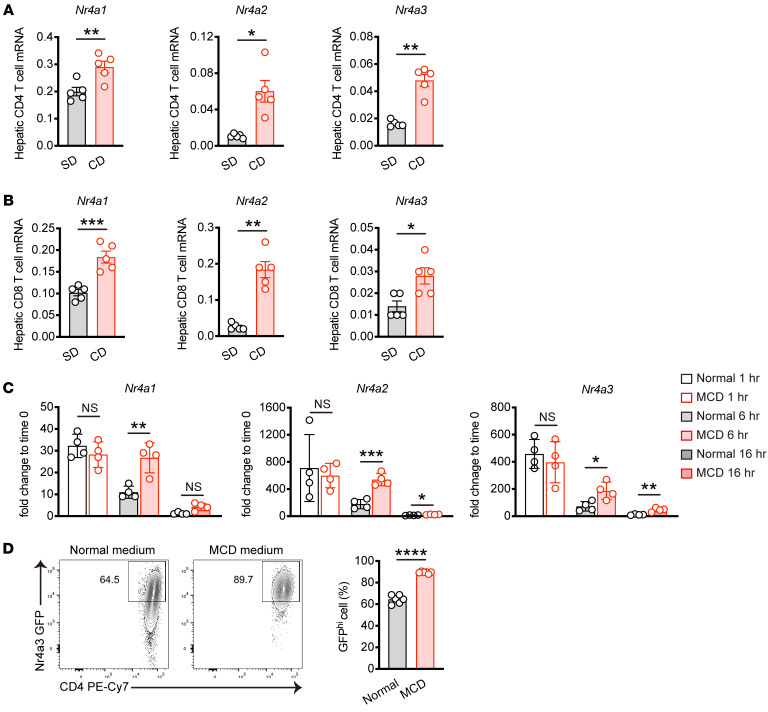
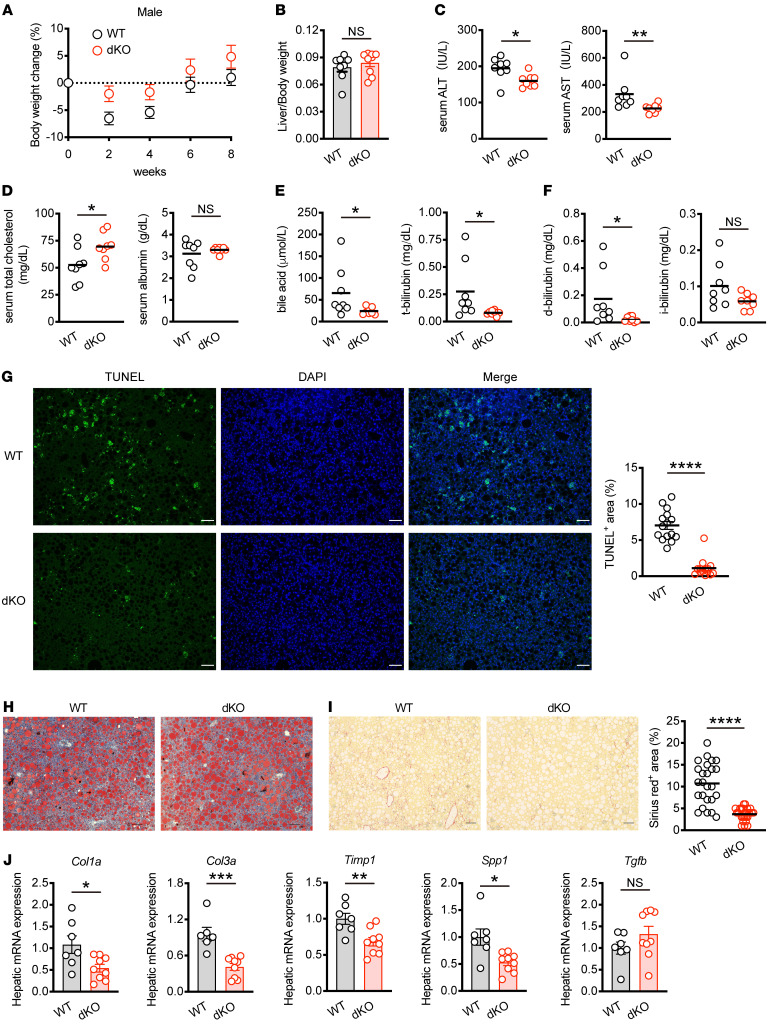
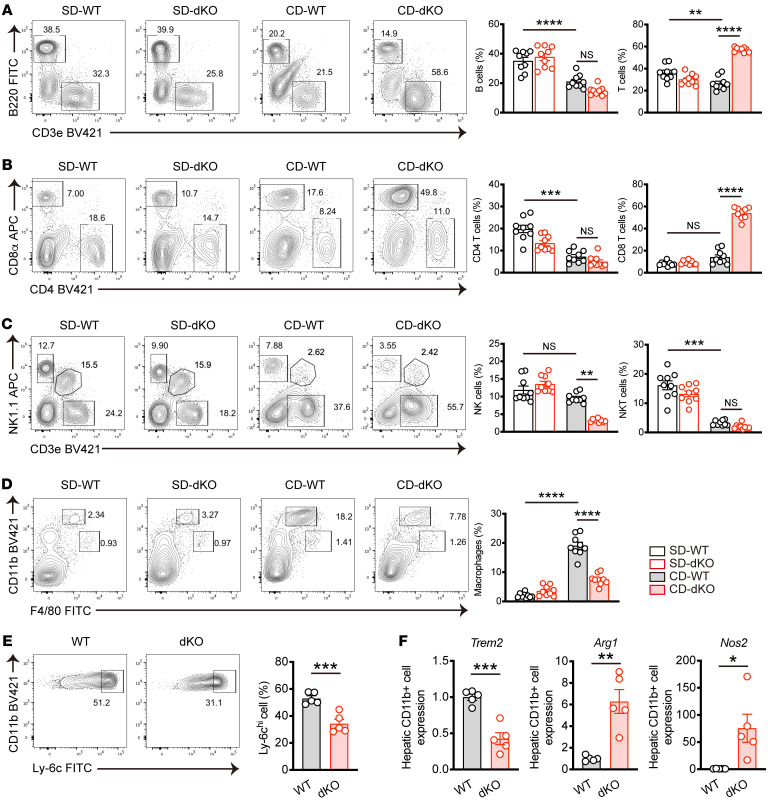
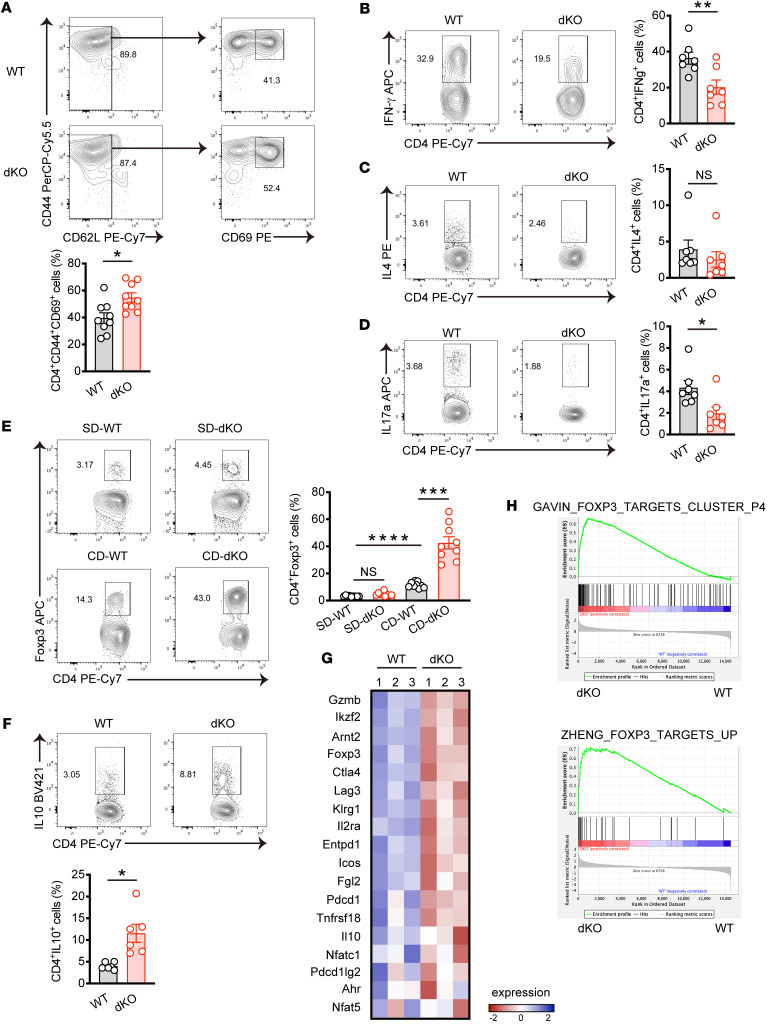
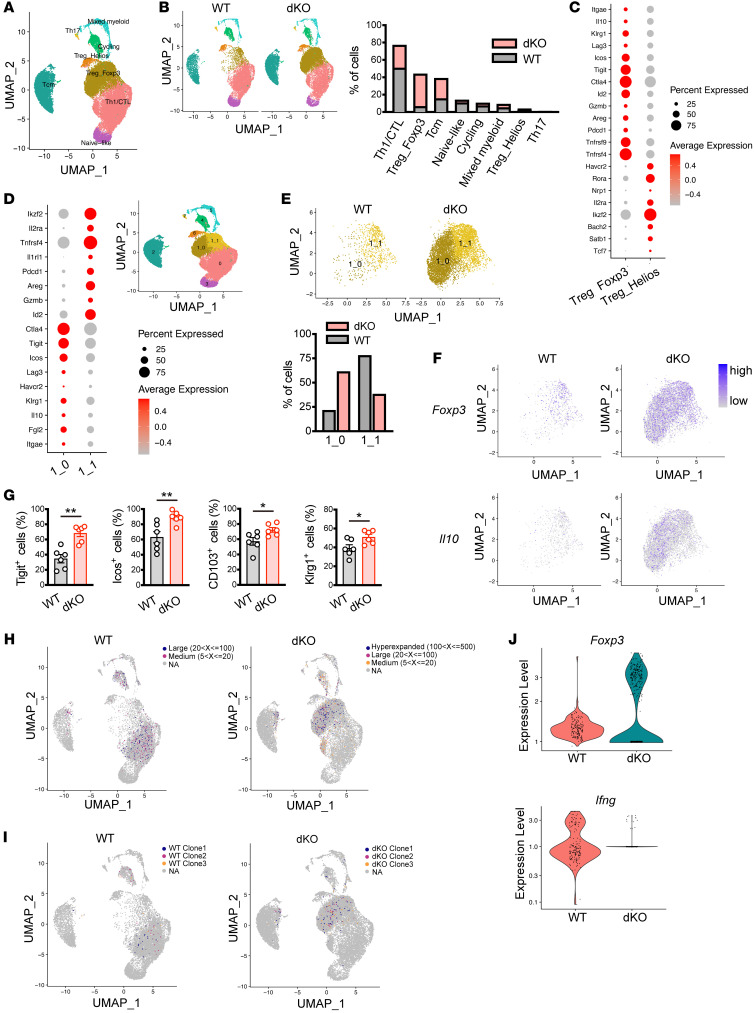
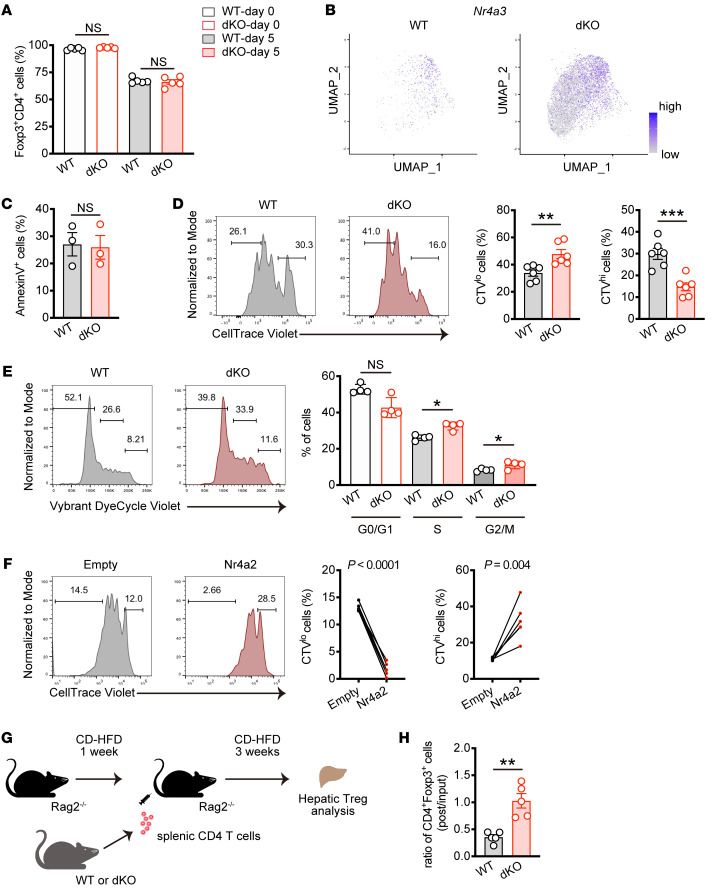
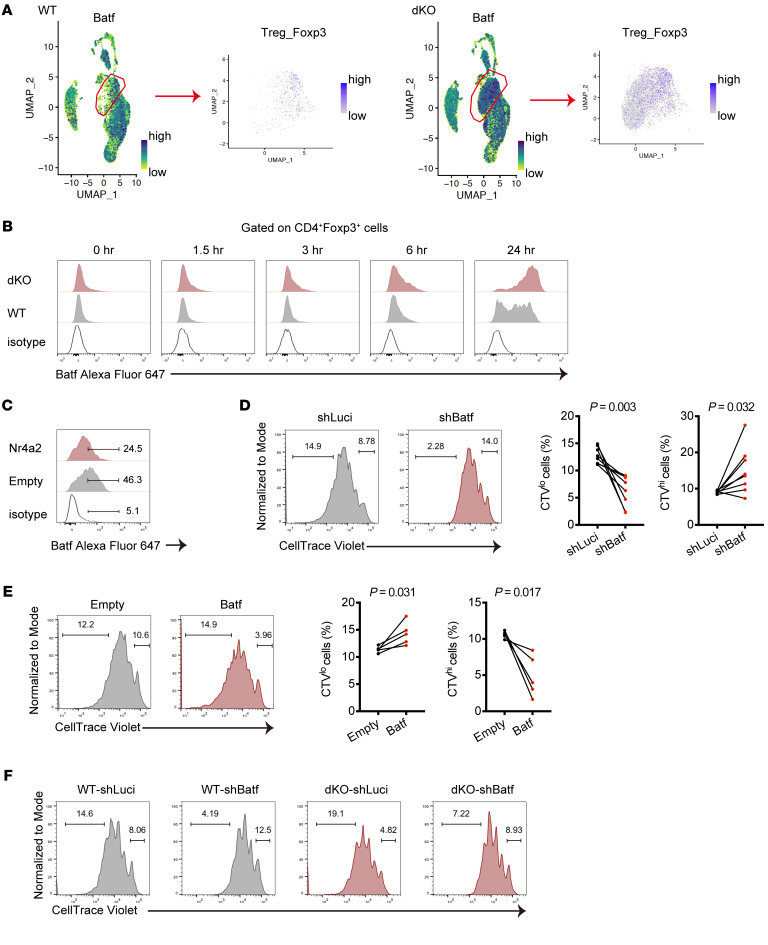
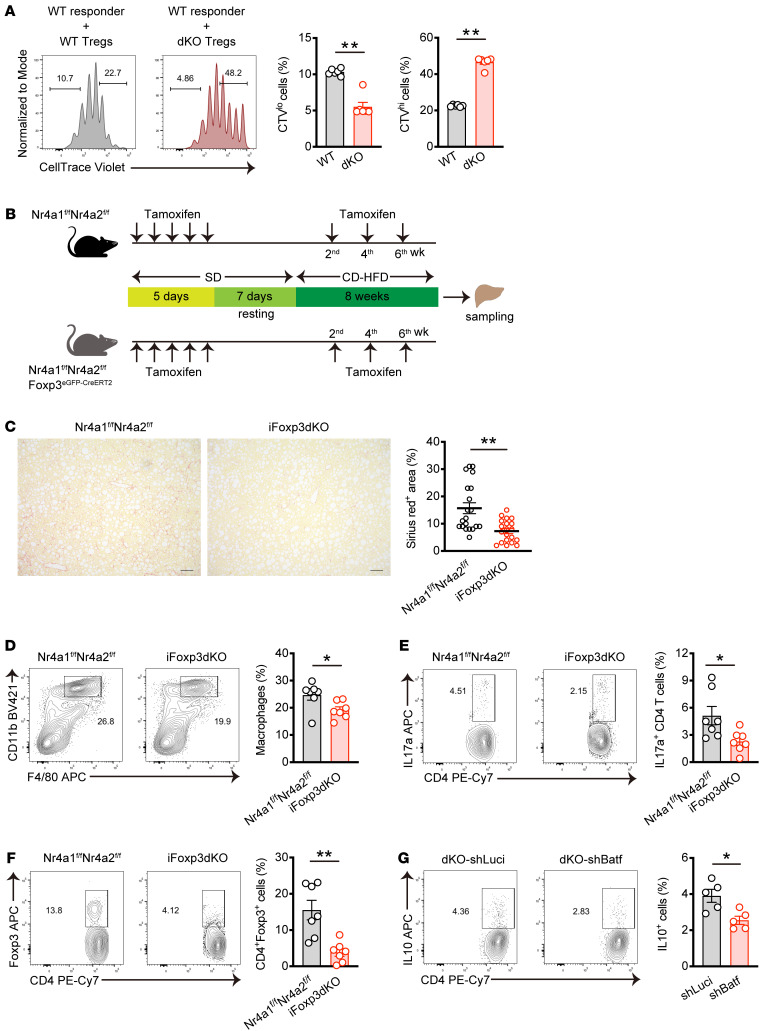
Metabolic dysfunction-associated steatotic hepatitis (MASH) is a chronic progressive liver disease that is highly prevalent worldwide. MASH is characterized by hepatic steatosis, inflammation, fibrosis, and liver damage, which eventually result in liver dysfunction due to cirrhosis or hepatocellular carcinoma. However, the cellular and molecular mechanisms underlying MASH progression remain largely unknown. Here, we found an increase of the Nr4a family of orphan nuclear receptor expression in intrahepatic T cells from mice with diet-induced MASH. Loss of Nr4a1 and Nr4a2 in T cell (dKO) ameliorated liver cell death and fibrosis, thereby mitigating liver dysfunction in MASH mice. dKO resulted in reduction of infiltrated macrophages and Th1/Th17 cells, whereas it led to a massive accumulation of Tregs in the liver of MASH mice. Combined single-cell RNA transcriptomic and TCR sequencing analysis revealed that intrahepatic dKO Tregs exhibited enhanced T cell immunoreceptor with Ig and ITIM domains (TIGIT) and IL-10 expression and were clonally expanded during MASH progression. Mechanistically, we found that dKO Tregs expressed high levels of basic leucine zipper ATF-like transcription factor (Batf), which promotes Treg cell proliferation and function upon TCR stimulation. Collectively, our findings not only provide an insight into the impact of intrahepatic Treg cells on MASH pathogenesis, but also suggest a therapeutic potential of targeting of the Nr4a family to treat the disease.

Keywords: Fibrosis; Immunology; T cell development; T cells.


Conflict of interest statement

Conflict of interest: The authors have declared that no conflict of interest exists.

Figures

Figure 1
Figure 1. MASH upregulates Nr4a family expression in hepatic T cells.
(A and B) Male C57BL/6 mice were fed SD or CD for 12 weeks (n = 5 per group). mRNA expression of Nr4a1, Nr4a2, and Nr4a3 in hepatic CD4+ T cells (A) or hepatic CD8+ T cells (B). (C) mRNA expression of Nr4a1, Nr4a2, and Nr4a3 in stimulated CD4+ T cells. Splenic naive CD4+ T cells were stimulated with α-CD3 and α-CD28 antibodies in normal RPMI (normal), or methionine and choline-deficient (MCD) medium for the indicated times (n = 4 per group). (D) Splenic naive CD4+ T cells from Nr4a3-EGFP reporter mice were stimulated with α-CD3 and α-CD28 antibodies in normal RPMI or MCD medium for 3 days, and GFP expression was assessed by flow cytometry. Representative flow cytometry plots (left) and percentages (right) of GFPhi cells (n = 6 per group). Primers used for quantitative PCR are listed in Supplemental Table 1. Data are represented as means ± SEM. P values were calculated using unpaired 2-tailed Student’s t test or Mann-Whitney U test (AD). *P < 0.05; **P < 0.01; ***P < 0.001; ****P < 0.0001.
Figure 2
Figure 2. Loss of Nr4a1 and Nr4a2 in T cell alleviates MASH pathology.
(A) Relative body weight changes of male WT and dKO mice fed CD for the indicated times (WT; n = 13, dKO; n = 14). (B) The ratio of liver weight to body weight of male WT and dKO mice fed CD for 8 weeks (WT; n = 8, dKO; n = 9). (CF) Female WT and dKO mice were fed CD for 12 weeks (n = 8 per group). ALT and AST levels (C), total cholesterol, albumin levels (D), bile acid, total bilirubin (t-bilirubin) levels (E), direct bilirubin (d-bilirubin), indirect bilirubin (i-bilirubin) levels (F) in the serum. (GJ) Male WT and dKO mice were fed CD for 8 weeks. (G) Representative liver sections stained TUNEL (green) and DAPI (blue). Original magnification, ×10. Scale bars: 100 μm (left). Quantification of TUNEL-positive area (%) per field (right) (n = 3 per group). (H) Representative oil red O staining of liver sections from 2 independent experiments. Original magnification, ×10. Scale bars: 100 μm. (I) Representative Sirius red staining of liver sections. Original magnification, ×10. Scale bars: 100 μm (left). Quantification of Sirius red staining area (%) per field (right) (n = 5 per group). (J) mRNA expression of fibrosis-related genes in liver tissue (WT; n = 6–7, dKO; n = 9). Data are represented as means ± SEM. P values were calculated using unpaired 2-tailed Student’s t test or Mann-Whitney U test (BG, I, and J). *P < 0.05; **P < 0.01; ***P < 0.001; ****P < 0.0001.
Figure 3
Figure 3. Hepatic immune cell composition from WT or dKO mice fed CD for 8 weeks.
(AD) WT and dKO mice were fed SD or CD for 8 weeks. (A) Representative flow cytometry plots (left) and percentages (right) of B cells (CD45+B220+) and T cells (CD45+CD3e+) in the liver (n = 9 per group). (B) Representative flow cytometry plots (top) and percentages (bottom) of CD45+CD4+ T cells and CD45+CD8 T cells in the liver (n = 9 per group). (C) Representative flow cytometry plots (left) and percentages (right) of NK (CD45+CD3eNK1.1+) cells and NKT (CD45+CD3e+NK1.1+) cells in the liver (n = 9 per group). (D) Representative flow cytometry plots (left) of macrophages (CD45+CD11bhiF4/80int) and Kupffer cells (CD45+CD11bintF4/80hi) and percentages (right) of macrophages in the liver (n = 9 per group). (E) Representative flow cytometry plots (top) and percentages (bottom) of CD45+CD11bhiF4/80intLy-6Chi macrophages in the liver from WT and dKO mice fed CD for 8 weeks (n = 5 per group). (F) mRNA expression of Trem2, Arg1, and Nos2 in hepatic CD11b+ cells from WT and dKO mice fed CD for 8 weeks (n = 5 per group). Data are represented as means ± SEM. P values were calculated using 1-way ANOVA or Kruskal-Wallis test (AD) or unpaired 2-tailed Student’s t test (E and F). *P < 0.05; **P < 0.01; ***P < 0.001; ****P < 0.0001.
Figure 4
Figure 4. Loss of Nr4a1 and Nr4a2 in T cells promotes hepatic Treg accumulation in MASH.
(AD) WT and dKO mice were fed CD for 8 weeks. (A) Representative flow cytometry plots (top) and percentages (bottom) of CD44+CD62L/loCD69+ cells gated on hepatic CD45+CD4+ cells (n = 9 per group). (BD) Representative flow cytometry plots (left) and percentages (right) of IFN-γ+ (B), IL-4+ (C), and IL-17a+ (D) cells gated on CD45+CD4+ cells in the liver (n = 7 per group). The cells were stimulated with phorbol 12-myristate 13-acetate (PMA) and ionomycin for 5 hours in the presence of Golgi plug before staining indicated cytokines. (E) WT and dKO mice were fed SD or CD for 8 weeks (n = 9 per group). Representative flow cytometry plots (left) and percentages (right) of Foxp3+ cells gated on CD45+CD4+ cells in the liver. (F) WT and dKO mice were fed CD for 8 weeks (n = 6 per group). Representative flow cytometry plots (top) and percentages (bottom) of IL-10+ cells gated on CD45+CD4+ cells in the liver. The cells were stimulated and stained as in BD. (G and H) RNA-Seq was performed using hepatic CD4+ T cells sorted from WT and dKO mice fed CD for 8 weeks (n = 3 per group). (G) Heatmap of Treg-related genes expressed between WT and dKO hepatic CD4+ T cells. (H) GSEA of previously published Tregs features enrichment in WT and dKO hepatic CD4+ T cells. P values were calculated using unpaired 2-tailed Student’s t test or Mann-Whitney U test (AD and F) or 1-way ANOVA (E). *P < 0.05; **P < 0.01; ***P < 0.001; ****P < 0.0001.
Figure 5
Figure 5. scRNA-Seq coupled with scTCR-Seq analysis identifies clonally expanded hepatic dKO Tregs in MASH.
(A) UMAP presentation of identified cell populations of hepatic CD4+ T cells of male WT and dKO mice fed CD for 8 weeks (n = 2 per group). (B) UMAP presentation (left) and frequencies (right) of cells in each cluster from WT and dKO hepatic CD4+ T cells. (C) Dot plot showing expression of indicated genes between Treg_Foxp3 and Treg_Helios clusters. (D) Dot plot showing expression of indicated genes between subclusters (left). UMAP presentation of 2 subclusters within Treg_Foxp3 cluster (right). (E) UMAP presentation of 2 subclusters within Treg_Foxp3 cluster (top) and frequencies of cells in each subcluster from WT and dKO hepatic CD4+ T cells (bottom). (F) UMAP presentation showing expression levels of Foxp3 (top) and Il10 (bottom) in Treg_Foxp3 cluster of WT and dKO hepatic CD4+ T cells. (G) Percentages of Tigit+, Icos+, CD103+, and Klrg1+ cells gated on hepatic CD45+CD4+Foxp3+ cells from WT and dKO mice fed CD for 8 weeks (n = 6 per group). (H and I) Spatial distribution of expanded clonotypes (H) and top 3 clonotypes expanded (I) in WT and dKO hepatic CD4+ T cells from mice fed CD for 8 weeks. (J) Violin plot of gene expression of Foxp3 (top) and Ifng (bottom) in top 3 clonotypes expanded from WT and dKO hepatic CD4+ T cells in MASH mice. P values were calculated using unpaired 2-tailed Student’s t test or Mann-Whitney U test (G). *P < 0.05; **P < 0.01.
Figure 6
Figure 6. Loss of Nr4a1 and Nr4a2 in T cells promotes Treg proliferation.
(A) Percentages of Foxp3-expressing cells in sorted splenic CD4+CD25+ Tregs (day 0) and cultured cells for 5 days (day 5) (n = 5 per group). (B) UMAP presentation showing Nr4a3 expression within Treg_Foxp3 cluster in WT and dKO hepatic CD4+ T cells from mice fed CD for 8 weeks. (C) Percentages of Annexin V+ WT and dKO splenic Tregs cultured after 3 days (n = 3 per group). (D) Representative CTV intensity histograms (left) and percentages of CTVlo (middle) and CTVhi (right) cells in WT and dKO splenic Tregs. Sorted Tregs were labeled and cultured for 3 days (n = 6 per group). (E) Representative flow cytometry analysis of cell cycle distribution (left) and quantification (right) in cultured WT and dKO splenic Tregs. After 3 days, cultured cells were labeled with Vybrant DyeCycle violet (n = 4 per group) and analyzed. (F) Representative CTV intensity histograms (left) and percentages of CTVlo (middle) and CTVhi (right) cells in splenic Tregs transduced with an empty vector or a vector encoding Nr4a2. Sorted Tregs were retrovirally transduced, rested, labeled with CTV, and then restimulated with α-CD3 and α-CD28 antibodies for 3 days. The cells were gated on GFP+CD4+ cells (n = 6 per group). (G) Schematic representation of adaptive transfer of WT and dKO splenic CD4+ T cells into MASH-induced Rag2–/– mice. (H) The ratio of hepatic CD4+Foxp3+ cell frequencies (post) from recipient mice fed CD to splenic CD4+Foxp3+ cell frequencies (input) from WT and dKO mice (n = 5 per group). P values were calculated using unpaired 2-tailed Student’s t test or Mann-Whitney U test (A, CE, and H) or paired 2-tailed Student’s t test (F). *P < 0.05; **P < 0.01; ***P < 0.001.
Figure 7
Figure 7. Nr4a/Batf axis regulates Treg proliferation.
(A) UMAP presentation showing Batf expression in assigned all clusters (left) and Treg_Foxp3 cluster (right) from WT and dKO CD4+ T cells in the liver of MASH mice. (B) Representative histograms normalized to mode for Batf expression in WT and dKO CD4+Foxp3+ T cells from 2 independent experiments. Sorted splenic CD4+ T cells were stimulated with plate-bound α-CD3 antibodies for the indicated times. (C) Representative histograms normalized to mode for Batf expression in splenic Tregs transduced with an empty vector or a vector encoding Nr4a2 from 2 independent experiments. Sorted Tregs were retrovirally transduced, rested, and then restimulated with α-CD3 and α-CD28 antibodies for 24 hours. The cells were gated on GFP+CD4+ cells. (D) Representative CTV intensity histograms normalized to mode in splenic Tregs transduced with shRNA targeting Luciferase or Batf (left) and percentages of CTVlo (middle) and CTVhi (right) cells. After resting culture, the cells were labeled and restimulated with α-CD3 and α-CD28 antibodies for 3 days. The cells were gated on GFP+CD4+ cells (n = 8 per group). (E) Representative CTV intensity histograms normalized to mode in splenic Tregs transduced with an empty vector or a vector encoding Batf (left) and percentages of CTVlo (middle) and CTVhi (right) cells. After resting culture, the cells were labeled and restimulated with α-CD3 and α-CD28 antibodies for 3 days. The cells were gated on GFP+CD4+ cells (n = 5 per group). (F) Representative CTV intensity histograms normalized to mode in WT and dKO splenic Tregs transduced with shRNA targeting Luciferase or Batf from 2 independent experiments. The cells were gated on GFP+CD4+ cells. P values were calculated using paired 2-tailed Student’s t test (D and E).
Figure 8
Figure 8. The loss of Nr4a1 and Nr4a2 in T cell promotes Treg function.
(A) Representative CTV intensity histograms normalized to mode in WT responder cells (left) and percentages of CTVlo (middle) and CTVhi (right) cells. Hepatic CD4+CD25+Tigit+ Tregs were sorted from WT and dKO mice fed CD for 8 weeks. CTV-labeled naive CD4+ T cells from the spleen of Ly5.1 mice were activated with Dynabeads Mouse T cell activator CD3/CD28 in the presence of sorted Tregs at a ratio of 5:1 (responder cells:Tregs). The cells were gated on CD45.1+CD4+ cells (n = 6 per group) (B) Schematic representation of the experimental procedure of MASH induction mouse model with Treg-specific inducible deletion of Nr4a1 and Nr4a2. (C) Representative Sirius red staining of liver sections from female mice. Original magnification, ×10. Scale bars: 100 μm. Quantification of Sirius red staining area (%) per field (right) in MASH-induced WT and iFoxp3dKO mice (n = 4 female per group). (DF) Representative flow cytometry plots (left) and percentages (right) of macrophages (CD45+CD11bhiF4/80int) (D), Th17 cells (CD45+CD4+IL17a+) (E), and Tregs (CD45+CD4+Foxp3+) (F) in the liver of MASH-induced WT and iFoxp3dKO mice (n = 7 per group). (G) Representative flow cytometry plots (left) and percentages (right) of IL-10+ in dKO splenic Tregs transduced with a shRNA targeting Luciferase or Batf. After resting culture, the cells were stimulated with PMA and ionomycin for 5 hours in the presence of Golgi plug before staining IL-10. The cells were gated on GFP+CD4+ cells (n = 5 per group). P values were calculated using unpaired 2-tailed Student’s t test or Mann-Whitney U test (A and CG). *P < 0.05; **P < 0.01.

References

    1. Younossi Z, et al. Global perspectives on nonalcoholic fatty liver disease and nonalcoholic steatohepatitis. Hepatology. 2019;69(6):2672–2682. doi: 10.1002/hep.30251. - DOI - PubMed
    1. Friedman SL, et al. Mechanisms of NAFLD development and therapeutic strategies. Nat Med. 2018;24(7):908–922. doi: 10.1038/s41591-018-0104-9. - DOI - PMC - PubMed
    1. Loomba R, et al. Mechanisms and disease consequences of nonalcoholic fatty liver disease. Cell. 2021;184(10):2537–2564. doi: 10.1016/j.cell.2021.04.015. - DOI - PubMed
    1. Adams LA, et al. Non-alcoholic fatty liver disease and its relationship with cardiovascular disease and other extrahepatic diseases. Gut. 2017;66(6):1138–1153. doi: 10.1136/gutjnl-2017-313884. - DOI - PubMed
    1. Eslam M, et al. MAFLD: a consensus-driven proposed nomenclature for metabolic associated fatty liver disease. Gastroenterology. 2020;158(7):1999–2014. doi: 10.1053/j.gastro.2019.11.312. - DOI - PubMed

MeSH terms

Substances

LinkOut - more resources