. 2024 Oct 15;135(1):e159400.
doi: 10.1172/JCI159400.

TREM2 aggravates sepsis by inhibiting fatty acid oxidation via the SHP1/BTK axis

Affiliations

TREM2 aggravates sepsis by inhibiting fatty acid oxidation via the SHP1/BTK axis

Siqi Ming et al. J Clin Invest. .

Abstract

Impaired fatty acid oxidation (FAO) and the therapeutic benefits of FAO restoration have been revealed in sepsis. However, the regulatory factors contributing to FAO dysfunction during sepsis remain inadequately clarified. In this study, we identified a subset of lipid-associated macrophages characterized by high expression of trigger receptor expressed on myeloid cells 2 (TREM2) and demonstrated that TREM2 acted as a suppressor of FAO to increase the susceptibility to sepsis. TREM2 expression was markedly upregulated in sepsis patients and correlated with the severity of sepsis. Knockout of TREM2 in macrophages improved the survival rate and reduced inflammation and organ injuries of sepsis mice. Notably, TREM2-deficient mice exhibited decreased triglyceride accumulation and an enhanced FAO rate. Further observations showed that the blockade of FAO substantially abolished the alleviated symptoms observed in TREM2-knockout mice. Mechanically, we demonstrated that TREM2 interacted with the phosphatase SHP1 to inhibit bruton tyrosine kinase-mediated (BTK-mediated) FAO in sepsis. Our findings expand the understanding of FAO dysfunction in sepsis and reveal TREM2 as a critical regulator of FAO that may provide a promising target for the clinical treatment of sepsis.

Keywords: Fatty acid oxidation; Infectious disease.


Figures

Figure 1
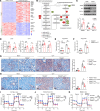
Figure 1. TREM2 expression is upregulated in monocytes/macrophages and associated with disease severity in sepsis.
(A and B) RNA-Seq of healthy controls (n = 10) and sepsis patients (n = 10) was performed. (A) Heatmap of markedly altered genes related to inflammation is shown. (B) PBMCs were isolated from healthy controls (n = 45) and sepsis patients (n = 54), respectively. TREM2 expression on CD11b+CD14+ monocytes was determined by flow cytometry. (C) CLP mouse model was established and TREM2 expression in CD11b+ F4/80+ macrophages at day 1, day 3, and day 5 after infection was assessed in PLFs, spleen, liver, and lung by flow cytometry. (D) Single-cell sequencing data from the lung of CLP sepsis mice were analyzed, and violin plots for the expression of Trem2, Ms4a3, Ms4a7, Spp1, Cd81, and Cd63 in TREM2 and TREM2+ macrophage clusters are shown. (E) The correlations of the percentages of TREM2+ monocytes with CRP, total bilirubin, BUN, and ALT levels were analyzed in sepsis patients (n = 54). (F) PBMCs were collected from sepsis patients (n = 15) on the ICU admission day (day 0) and 1, 3, 5, and 7 days after treatment. TREM2 expression on monocytes was detected and serum CRP levels were displayed. (G) The correlations of the percentages of TREM2+ monocytes with serum glucose and triglyceride concentrations were analyzed in sepsis patients (n = 54). Unpaired Student’s t test was performed (B). One-way ANOVA was employed (C and F). Spearman’s correlation analysis was used (E and G). Data are represented as means ± SEM from 3 independent experiments. *P < 0.05; **P < 0.01; ***P < 0.001.
Figure 2
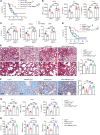
Figure 2. TREM2 knockout in macrophages alleviates sepsis-induced inflammation and organ damage.
(AE) CLP sepsis mouse model was established in WT and TREM2–/– mice. (A) Survival rates were observed. (B) Lung injuries and inflammatory cell infiltration were evaluated by H&E staining 24 hours later. (C) Lung neutrophil (Neu) and macrophage (Mφ) proportions were examined by flow cytometry 24 and 72 hours later. (D) Levels of IL-6, IL-1β, and TNF-α produced by CD11b+F4/80+ macrophages in liver and lung were determined by flow cytometry 12 hours after CLP. (E) IL-1β, IL-6, and TNF-α levels in serum and lung or liver suspension were detected by ELISA at 24 hours after challenge. (FJ) CLP sepsis mouse model was established in Lyz2Cre and TREM2fl/fl Lyz2Cre mice. (F) Survival rates were recorded. (G) Structural damage of lung tissue was evaluated by H&E staining 24 hours later. (H) The percentages of neutrophils and macrophages in lung were determined by flow cytometry 24 and 72 hours later. (I) Levels of macrophage-derived IL-6, IL-1β, and TNF-α in liver and lung were detected by flow cytometry 12 hours after CLP. (J) IL-1β, IL-6, and TNF-α levels in serum, lung, and liver supernatant were detected by ELISA 24 hours later. Log rank (Mantel-Cox) test was adopted to compare significance (A and F). One-way ANOVA was employed (BE and GJ). Data are represented as means ± SEM from at least 3 independent experiments. Scale bars: 50 μm. *P < 0.05; **P < 0.01.
Figure 3
Figure 3. TREM2 deficiency promotes FAO of macrophages in sepsis.
(A and B) RNA-Seq of healthy controls (n = 10) and sepsis patients (n = 10) was performed. (A) Heatmap of altered genes involved in the FA metabolism was shown. (B) Flowchart of FA metabolism is displayed. Upregulated genes in sepsis patients are marked as red and downregulated genes are marked as green. (C) Monocytes were isolated from healthy controls and sepsis patients. Western blot was performed to detect the expression of TREM2, CPTI, PGC-1α, and β-actin. (D) PBMCs were isolated from sepsis patients or healthy controls and treated with recombinant TREM2-Fc protein (4 μg/mL) and IgG-Fc for 12 hours, followed by the detection of the expression levels of CD36, CPTI, and CPTII in CD11b+CD14+ monocytes by flow cytometry. (EH) CLP mouse model was established. (E and F) Twelve hours later, serum triglyceride levels in WT versus TREM2–/– mice (E) or Lyz2Cre versus TREM2fl/fl Lyz2Cre mice (F) were detected. (G and H) Lipid droplets in the liver of WT versus TREM2–/– mice (G) or Lyz2Cre versus TREM2fl/fl Lyz2Cre mice (H) were assessed by oil red O staining 24 hours later. (I and J) CLP mouse model was established in WT and TREM2–/– mice. Peritoneal (I) or splenic (J) macrophages were isolated and the rates of FAO were determined by Seahorse XF Extracellular Flux Analyzers. (K) BMDMs were isolated and stimulated with LPS (1μg/ml) for 12 hours. Then the rate of FAO was determined. Paired Student’s t test was performed (D). Unpaired Student’s t test was used in C. One-way ANOVA was employed (EH). Two-way ANOVA was used to analyze significance (IK). Data are represented as means ± SEM from at least 3 independent experiments. Scale bars: 50 μm. *P < 0.05; **P < 0.01; ***P < 0.001.
Figure 4
Figure 4. Inhibition of FAO abolishes the improved sepsis symptoms regulated by TREM2.
(AC) CPTIfl/fl and CPTIfl/flLyz2Cre mice were treated with anti-TREM2 blocking Ab (150mg/kg) or IgG isotype control for 2 hours, followed by the establishment of CLP model. (A) The survival rates were observed. (B) IL-1β, IL-6, and TNF-α levels in serum were determined by ELISA at 24 hours after CLP challenge. (C) The serum biochemical indexes including ALT, CREA2, and BUN were detected 24 hours later. (DH) CLP model was established in TREM2fl/flLyzCre, CPTIfl/flLyz2Cre, CPTIfl/flTREM2fl/flLyz2Cre, and LyzCre control mice respectively. (D) The survival rates were observed. (E) H&E staining was performed to assess the lung injuries and inflammatory cell infiltration 24 hours later. (F) Lipid droplets in liver were assessed by oil red O staining 24 hours later. (G) Serum IL-1β, IL-6, and TNF-α levels were detected by ELISA 24 hours later. (H) ALT, BUN, and CREA2 concentrations in serum were detected 24 hours later. Log rank (Mantel-Cox) test was adopted to compare significance (A and D). One-way ANOVA was employed (B, C and EH). Data are represented as means ± SEM from at least 3 independent experiments. Scale bars: 50 μm. *P < 0.05; **P < 0.01; ***P < 0.001.
Figure 5
Figure 5. TREM2 regulates macrophage FAO through BTK kinase.
(A and B) WT and TREM2–/– pMφ was stimulated with LPS (1 μg/ml) for indicated times. (A) The expressions of CPTI, HK2, and PKM2 were detected by Western blot. (B) The expressions of FAO-related regulators were determined by Western blot. (C) Phosphorylation and total levels of AMPKα were determined. (D) Phosphorylation and total levels of BTK and STAT6 were compared among groups by Western blot. (E and F) WT and TREM2–/– pMφ cells were treated with BTK inhibitor LFM-A13 (1 μM) or ibrutinib (1 μM) for 1 hour, followed by stimulation with LPS (1 μg/ml) for 12 hours. (E) The expressions of FAO rate-limiting enzyme CPTI and associated molecules PGC-1, as well as the phosphorylation and total levels of AMPKα and STAT6, were measured. (F) The FAO rate was determined. (G) WT and TREM2–/– BMDM cells were treated with LFM-A13 (1 μM) or ibrutinib (1 μM) for 1 hour. Then LPS (1 μg/ml) was added for additional stimulation for 12 hours. The FAO rate was tested by Seahorse XF Extracellular Flux Analyzers. (H) WT and TREM2–/– pMφ cells were pretreated with LFM-A13 or ibrutinib for 1 hour and stimulated with LPS for 12 hours. Relative mRNA expressions of IL-1β and IL-6 were detected by quantitative real-time PCR. Two-way ANOVA was used to analyze significance (F and G). One-way ANOVA was employed (H). Data are represented as means ± SEM from at least 3 independent experiments. *P < 0.05; **P < 0.01; ***P < 0.001.
Figure 6
Figure 6. TREM2 inhibits BTK-mediated FAO via recruiting SHP1.
(A) Constructed plasmids were transfected into 293T cells. The interactions of TREM2 with SHP1, SHP2, and SHIP1 were determined by co-IP and Western blot 48 hours later. (B) PMφ cells were stimulated with LPS (1 μg/ml) for 12 hours and immunoprecipitated with IgG or TREM2 Ab to determine the binding between TREM2 and SHP1. (C) WT and TREM2–/– PMφ cells were stimulated with LPS (1 μg/ml) for indicated times. The phosphorylation and total levels of SHP1 were determined by Western blot. (D) TREM2 plasmid was transfected into BMDMs. Forty-eight hours later, BMDMs were pretreated with PTP inhibitor II (1 μM) or NSC87877 (1 μM) for 1 hour, followed by the treatment of LPS (1 μg/ml). BTK phosphorylation was assessed 12 hours later. (E) TREM2, SHP1, and DAP12 plasmids were transfected into 293T cells. Forty-eight hours later, co-IP assay was performed to determine the interaction between TREM2 and SHP1. (F) WT and DAP12-deficient (DAP12–/–) pMφ cells were treated with LPS (1μg/ml) for 12 hours and immunoprecipitated with IgG or TREM2 Abs. The binding among TREM2, DAP12, and SHP1 was detected by Western blot. (G) Plasmids expressing TREM2 lacking extracellular domain (ΔExtra) or transmembrane plus cytoplasmic domain (ΔTrans-cyto) and expressing SHP1 were transfected into 293T cells. Forty-eight hours after transfection, co-IP was performed. (H) TREM2 plasmid was transfected into 293T cells with full-length SHP1, N terminal-SH2 domain (N-SH), C-terminal SH2 (C-SH), or PTPase domain of SHP1, respectively, and the interactions of TREM2 with these domains were determined by co-IP after 48 hours. (I) PTPase domain or PTPase domain containing R352A, K356A, R358A, N359A, Y536A, or Y564A mutations were transfected into 293T cells with TREM2 plasmid and the interactions were determined 48 hours after transfection.

References

    1. Singer M, et al. The third international consensus definitions for sepsis and septic shock (Sepsis-3) JAMA. 2016;315(8):801–810. doi: 10.1001/jama.2016.0287. - DOI - PMC - PubMed
    1. Aziz M, et al. Current trends in inflammatory and immunomodulatory mediators in sepsis. J Leukoc Biol. 2013;93(3):329–342. doi: 10.1189/jlb.0912437. - DOI - PMC - PubMed
    1. Minasyan H. Sepsis: mechanisms of bacterial injury to the patient. Scand J Trauma Resusc Emerg Med. 2019;27(1):19. doi: 10.1186/s13049-019-0596-4. - DOI - PMC - PubMed
    1. Biswas SK, Lopez-Collazo E. Endotoxin tolerance: new mechanisms, molecules and clinical significance. Trends Immunol. 2009;30(10):475–487. doi: 10.1016/j.it.2009.07.009. - DOI - PubMed
    1. Hotchkiss RS, et al. The sepsis seesaw: tilting toward immunosuppression. Nat Med. 2009;15(5):496–497. doi: 10.1038/nm0509-496. - DOI - PMC - PubMed

MeSH terms