. 2024 Oct 15;20(10):e1012451.
doi: 10.1371/journal.ppat.1012451. eCollection 2024 Oct.

A master regulator of central carbon metabolism directly activates virulence gene expression in attaching and effacing pathogens

Affiliations

A master regulator of central carbon metabolism directly activates virulence gene expression in attaching and effacing pathogens

Kabo R Wale et al. PLoS Pathog. .

Abstract

The ability of the attaching and effacing pathogens enterohaemorrhagic Escherichia coli (EHEC) and Citrobacter rodentium to overcome colonisation resistance is reliant on a type 3 secretion system used to intimately attach to the colonic epithelium. This crucial virulence factor is encoded on a pathogenicity island known as the Locus of Enterocyte Effacement (LEE) but its expression is regulated by several core-genome encoded transcription factors. Here, we unveil that the core transcription factor PdhR, traditionally known as a regulator of central metabolism in response to cellular pyruvate levels, is a key activator of the LEE. Through genetic and molecular analyses, we demonstrate that PdhR directly binds to a specific motif within the LEE master regulatory region, thus activating type 3 secretion directly and enhancing host cell adhesion. Deletion of pdhR in EHEC significantly impacted the transcription of hundreds of genes, with pathogenesis and protein secretion emerging as the most affected functional categories. Furthermore, in vivo studies using C. rodentium, a murine model for EHEC infection, revealed that PdhR is essential for effective host colonization and maximal LEE expression within the host. Our findings provide new insights into the complex regulatory networks governing bacterial pathogenesis. This research highlights the intricate relationship between virulence and metabolic processes in attaching and effacing pathogens, demonstrating how core transcriptional regulators can be co-opted to control virulence factor expression in tandem with the cell's essential metabolic circuitry.


Conflict of interest statement

The authors have declared that no competing interests exist.

Figures

Fig 1
Fig 1. Identification of PdhR as a regulator of the LEE-encoded T3SS in EHEC.
The flow chart summarises the C. rodentium in vivo transcriptome and illustrates the identification of four TF encoding genes in EHEC that were also found as part of the C. rodentium in vivo DEG set. The bar chart shows the results of a transcriptional reporter screen (using plasmid pLEE-GFP) to identify the effects of TF deletion on T3SS expression. ** and ns indicate P < 0.01 or not significant respectively, as determined by two-way ANOVA with Dunnett’s post-test. Error bars represent standard error of the mean. Figure created using Biorender.com.
Fig 2
Fig 2. PdhR promotes T3SS expression and host cell attachment independently of its effects on growth.
(A) Growth curves depicting hourly optical density (600 nm) measurements of EHEC, ΔpdhR and ΔpdhR:ppdhR cultured in MEM-HEPES (left panel) or MEM-HEPES supplemented with 0.2% succinate (right panel). Error bars represent standard error of the mean. (B) LEE-GFP reporter assay of EHEC and ΔpdhR cultured in MEM-HEPES supplemented with 0.2% succinate. ** indicates P < 0.01, as determined by two-way ANOVA with Dunnett’s post-test. Error bars represent standard error of the mean. (C) SDS-PAGE profiling of EHEC, ΔpdhR and ΔpdhR:ppdhR culture supernatants from MEM-HEPES supplemented with 0.2% succinate. The arrows indicate the position of known and previously verified T3SS-related effector proteins. The large band at 15 kDa represents Lysozyme added equally to each sample as a loading control. This experiment was performed on three independent occasions. (D) HeLa cells infected with EHEC, ΔpdhR and ΔpdhR:ppdhR that were pre-cultured in MEM-HEPES supplemented with 0.2% succinate. The overlaid channels are labelled across the top. The images represent a single field of view from N = 10 for each strain. This experiment was performed on three independent occasions. (E) Quantification of data derived from widefield fluorescence microscopy analysis of HeLa cell infection assays depicted in panel D. **** or ns indicate P < 0.0001 or not significant respectively, as determined by two-way ANOVA with Dunnett’s post-test. Error bars represent standard error of the mean.
Fig 3
Fig 3. PdhR is a global regulator of transcription in EHEC.
(A) Volcano plot depicting global gene expression patterns of ΔpdhR versus EHEC cultured in MEM-HEPES supplemented with 0.2% succinate, determined by RNA-seq. The data points represent all significantly differentially expressed genes (FDR P < 0.05) that were below the absolute fold-change threshold of +/- 1.5 (grey bars). The points highlighted in red are all LEE-associated. (B) Gene ontology analysis illustrating the most significantly enriched biological processes amongst the upregulated DEGs identified in panel A. (C) Gene ontology analysis performed on the downregulated DEGs from panel A, with LEE and virulence associated pathways highlighted in red.
Fig 4
Fig 4. PdhR binds to and directly regulates the LEE master regulatory region.
(A) Sequence of the LEE master regulatory region, directly upstream of operon LEE1. The ler start codon is highlighted in bold. Promoters 1 (P1) and 2 (P2) are underlined. The identified PdhR binding site is indicated in purple. (B) EMSA analysis of recombinant PdhR-his interactions with DNA probes corresponding to the LEE1, LEE1mut and grlA promoter regions. A negative control of the amp gene is shown also. Protein concentrations are indicated above each lane of the EMSA gel. EMSA experiments were performed on at least three independent occasions with reproducible results observed. (C) Schematic illustrating the design of various transcriptional reporter fusions of LEE promoter fragments to GFP, used to assess the activity of individual promoters located within the LEE regulatory region. (D) Transcriptional reporter assay of EHEC and ΔpdhR cultured in MEM-HEPES supplemented with 0.2% succinate. The graphs correspond to constructs designed in panel C (labelled P1/P2, P1 alone or P2 alone respectively). ** or ns indicate P < 0.01 or not significant, as determined by two-way ANOVA with Dunnett’s post-test. Error bars represent standard error of the mean. (E) LEE1-GFP reporter assay of EHEC, ΔpdhR, EHECPLEEmut and ΔpdhRPLEEmut. The sequence modification that PLEEmut corresponds to, as well as the PdhR binding motif from E. coli K-12, are illustrated on the left of the graph. Error bars represent standard error of the mean.
Fig 5
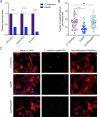
Fig 5. PdhR promotes T3SS expression and host cell attachment in C. rodentium.
(A) RT-qPCR analysis of eae, espZ and ler from C. rodentium and ΔpdhR cultured in MEM-HEPES. Data were normalised to the gapA gene. **** or ns indicate P < 0.0001 or not significant respectively, as determined by two-way ANOVA with Dunnett’s post-test. Error bars represent standard error of the mean. (B) Quantification of widefield fluorescence microscopy analysis of HeLa cells infected with C. rodentium, ΔpdhR and ΔpdhR:ppdhR. **** or ns indicate P < 0.0001 or not significant respectively, as determined by two-way ANOVA with Dunnett’s post-test. Error bars represent standard error of the mean. (C) Representative images of HeLa cells infected with EHEC, ΔpdhR and ΔpdhR:ppdhR. The overlaid channels are labelled across the top row. The images represent a single field of view from N = 10 for each strain. This experiment was performed on three independent occasions.
Fig 6
Fig 6. PdhR contributes to the in vivo fitness of C. rodentium via T3SS regulation.
(A) Colonisation dynamics of female BALB/c mice (N = 9) orally infected with either C. rodentium or ΔpdhR. Colony forming units were determined from faecal samples taken at the indicated intervals. *, ** or *** indicate P < 0.05, P < 0.01 P < 0.0001 respectively, as determined by two-way Mann-Whitney U-test. Error bars represent standard error of the mean. (B) RT-qPCR analysis of relative ler transcription from C. rodentium or ΔpdhR infected colonic tissue. ** indicates P < 0.01, as determined by two-way ANOVA with Dunnett’s post-test. Error bars represent standard error of the mean.

References

    1. Caballero-Flores G, Pickard JM, Núñez G. Microbiota-mediated colonization resistance: mechanisms and regulation. Nature Reviews Microbiology. 2023. pp. 347–360. doi: 10.1038/s41579-022-00833-7 - DOI - PMC - PubMed
    1. Woelfel S, Silva MS, Stecher B. Intestinal colonization resistance in the context of environmental, host, and microbial determinants. Cell Host Microbe. 2024;32: 820–836. doi: 10.1016/j.chom.2024.05.002 - DOI - PubMed
    1. Baümler AJ, Sperandio V. Interactions between the microbiota and pathogenic bacteria in the gut. Nature. 2016. pp. 85–93. doi: 10.1038/nature18849 - DOI - PMC - PubMed
    1. Kamada N, Kim YG, Sham HP, Vallance BA, Puente JL, Martens EC, et al.. Regulated virulence controls the ability of a pathogen to compete with the gut microbiota. Science (80-). 2012;336: 1325–1329. doi: 10.1126/science.1222195 - DOI - PMC - PubMed
    1. Croxen MA, Finlay BB. Molecular mechanisms of Escherichia coli pathogenicity. Nature Reviews Microbiology. 2010. pp. 26–38. doi: 10.1038/nrmicro2265 - DOI - PubMed

MeSH terms

LinkOut - more resources