. 2024:44:103686.
doi: 10.1016/j.nicl.2024.103686. Epub 2024 Oct 10.

Altered brain complexity in first-episode antipsychotic-naïve patients with schizophrenia: A whole-brain voxel-wise study

Affiliations

Altered brain complexity in first-episode antipsychotic-naïve patients with schizophrenia: A whole-brain voxel-wise study

Naici Liu et al. Neuroimage Clin. 2024.

Abstract

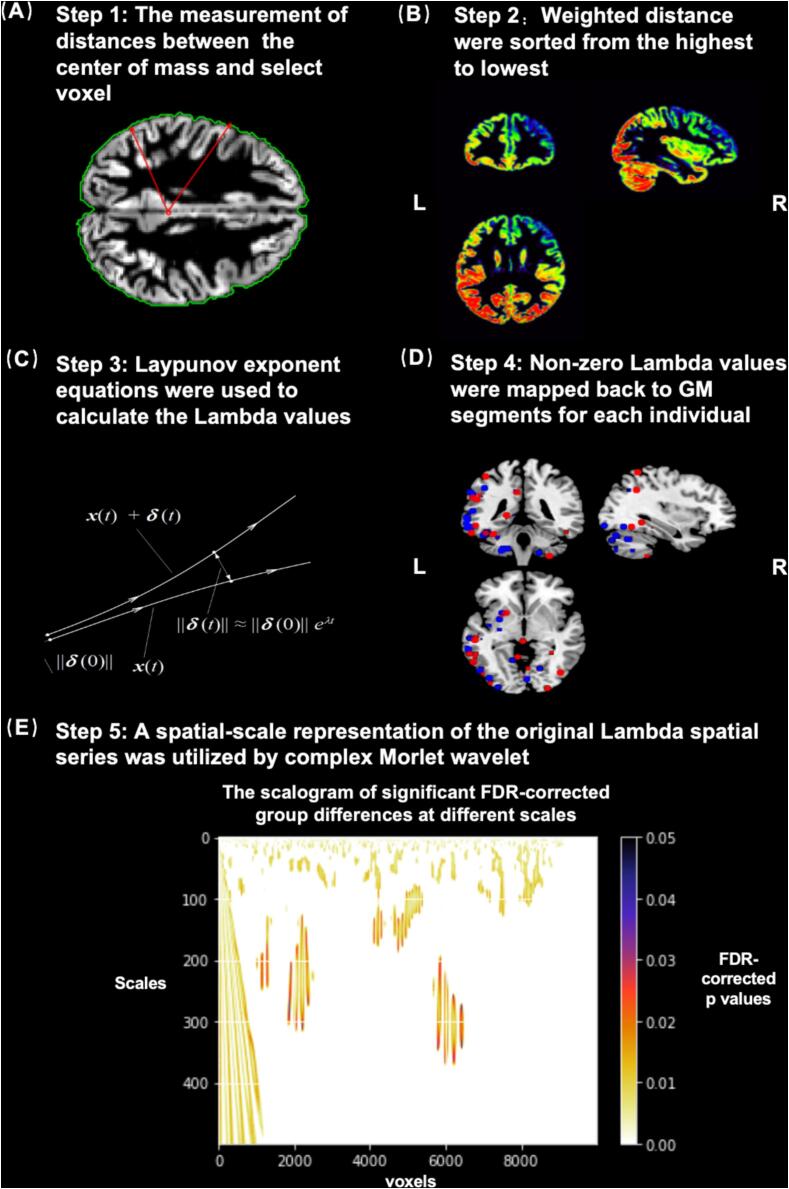
Background: Measures of cortical topology are believed to characterize large-scale cortical networks. Previous studies used region of interest (ROI)-based approaches with predefined templates that limit analyses to linear pair-wise interactions between regions. As cortical topology is inherently complex, a non-linear dynamic model that measures the brain complexity at the voxel level is suggested to characterize topological complexities of brain regions and cortical folding.

Methods: T1-weighted brain images of 150 first-episode antipsychotic-naïve schizophrenia (FES) patients and 161 healthy comparison participants (HC) were examined. The Chaos analysis approach was applied to detect alterations in brain structural complexity using the largest Lyapunov exponent (Lambda) as the key measure. Then, the Lambda spatial series was mapped in the frequency domain using the correlation of the Morlet wavelet to reflect cortical folding complexity.

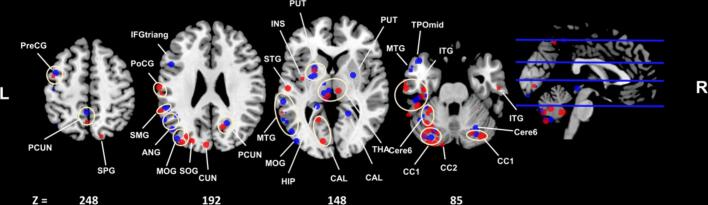
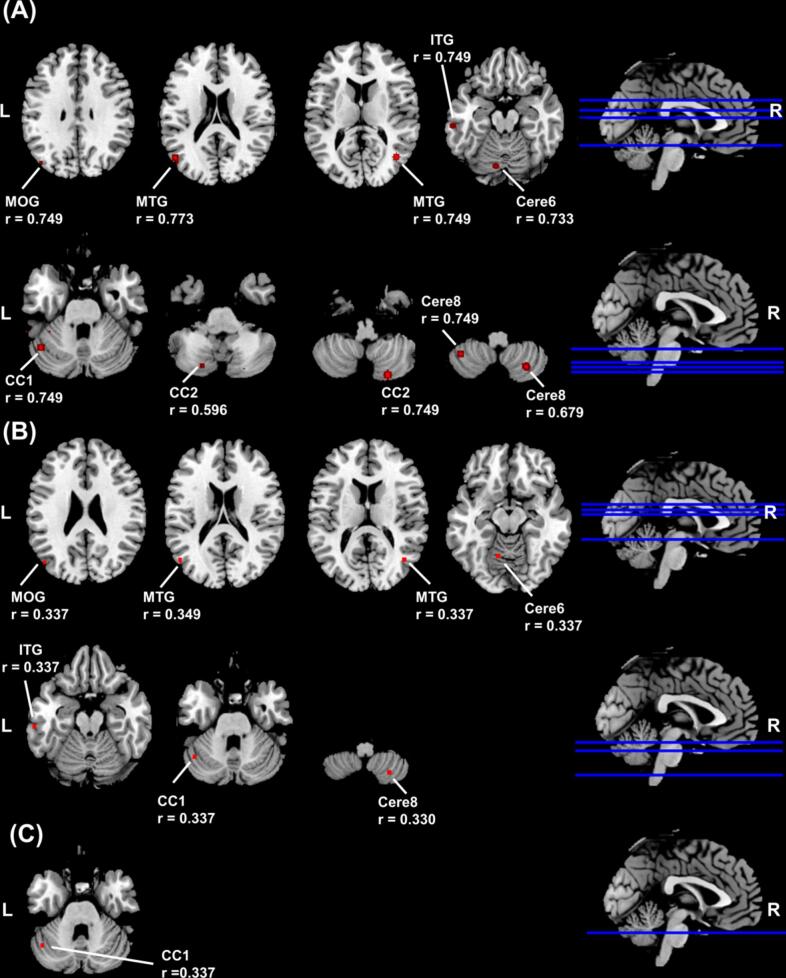
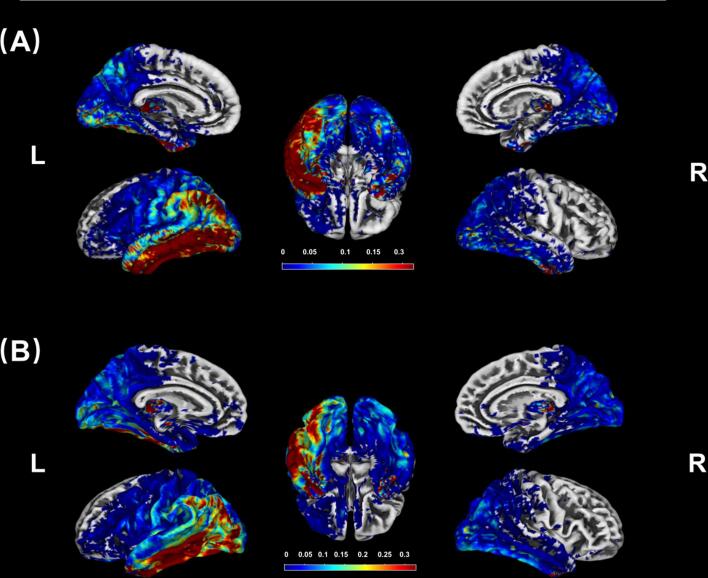
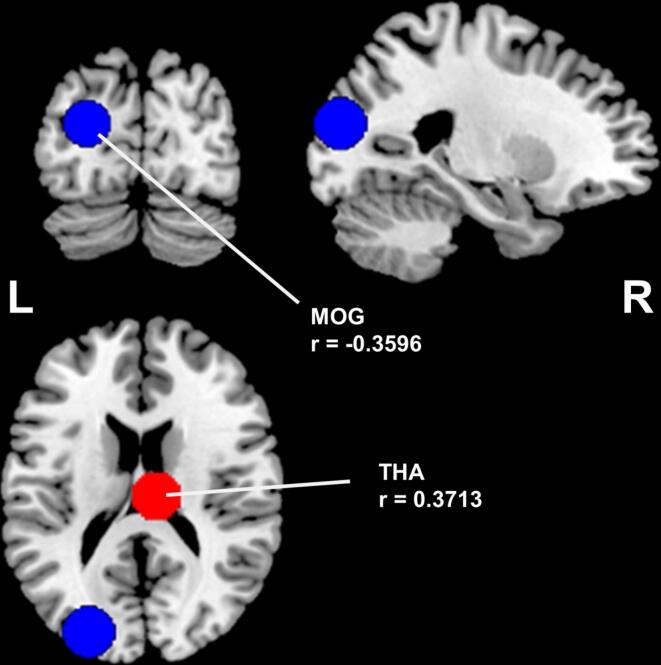
Results: A widespread voxel-wise decrease in Lambda values in space and frequency domains was observed in FES, especially in frontal, parietal, temporal, limbic, basal ganglia, thalamic, and cerebellar regions. The widespread decrease indicates a general loss of brain topological complexity and cortical folding. An additional pattern of increased Lambda values in certain regions highlights the redistribution of complexity measures in schizophrenia at an early stage with potential progression as the illness advances. Strong correlations were found between the duration of untreated psychosis and Lambda values related to the cerebellum, temporal, and occipital gyri.

Conclusions: Our findings support the notion that defining brain complexity by non-linear dynamic analyses offers a novel approach for identifying structural brain alterations related to the early stages of schizophrenia.

Keywords: Brain complexity; Cortical topology; Largest Lyapunov exponent; Non-linear dynamic model; Schizophrenia.


Conflict of interest statement

Declaration of competing interest The authors declare that they have no known competing financial interests or personal relationships that could have appeared to influence the work reported in this paper.

Figures

Fig. 1
Fig. 1
Flowchart of the Chaos analysis and Continuous Wavelet transformation. (A) step 1: the distances between the center of mass and all voxels were measured based on the modulated and normalized GM segment images, (B) step 2: weighted distances (distance in mm × voxel intensity) were obtained to capture geometric changes in brain regions and were sorted from the highest to lowest, higher weighted distances are indicated by red/warm color and lower weighted distance are indicated by blue/cold color. Then the top 10,000 non-zero voxels were retained to estimate Lambda values, (C) step 3: Lyapunov exponent equations and explanation of the divergence of the points in a state-space, (D) step 4: non-zero Lambda values were mapped back to GM segments for each individual. Representations of the mean non-zero Lambda values of FES (red) and HC (blue) at the group level, (E) step 5: a spatial-scale representation of the original Lambda spatial series of the 10,000 selected voxels was utilized. The Scalogram showed significant FDR-corrected group differences at different scales (0–500). Selected top 10,000 non-zero voxels are represented on the x-axis and scales on the y-axis. Each value in the scalogram represents the correlation of the Lambda series with the Morlet wavelet on the respective voxel and scale. The colors represent the correlation with the Morlet wavelet with deep purple color corresponding to larger and white color corresponding to smaller FDR-corrected p-values. All voxels had significant FDR-corrected p values. Abbreviations: GM, gray matter; FDR, false discovery rate; L, left; R, right.
Fig. 2
Fig. 2
Brain regions showing significant FDR corrected group differences in Lambda values indicating both higher and lower complexity in FES compared with HC. Blue spots represent FES while red spots represent HC (FWHM = 6 mm). The horizontal blue lines in the right part of the figure indicate the axial slice locations. The spots in the same brain area are circled by yellow lines. Abbreviations: ANG, angular gyrus; CAL, calcarine fissure and surrounding cortex; CC1, cerebellum crus 1; CC2, cerebellum crus 2; Cere6, cerebellum 6; CUN, cuneus; IFGtriang, triangular part of inferior frontal gyrus; INS, insula; ITG, inferior temporal gyrus; L, left; MOG, middle occipital gyrus; MTG, middle temporal gyrus; PCUN, Precuneus; PreCG, precentral gyrus; PUT, putamen; R, right; SMG, Supramargnial gyrus; SOG, superior occipital gyrus; SPG, superior parietal gyrus; THA, thalamus.
Fig. 3
Fig. 3
Correlations between brain complexity and (A) DUP, (B) negative syndrome, and (C) anergia subscores in FES. The red spots indicate positive correlations (FWHM = 6 mm). The horizontal blue lines in the right part of the figure indicate the axial slice locations. Abbreviations: CC1, cerebellum crus1; CC2, cerebellum crus2; Cere6, cerebellum 6; Cere8, cerebellum 8; ITG, inferior temporal gyrus; L, left; MOG, middle occipital gyrus; MTG, middle temporal gyrus; R, right.
Fig. 4
Fig. 4
Correlations of the Lambda values with the Morlet wavelet in voxels with statistically significant FDR-corrected differences for 400 scales were overlaid to (A) FES and (B) HC. The color scale represents the range of the correlation, higher (lower) correlations are indicated by red/warm (blue/cold) color and represent smooth (sharp) cortical folding. Abbreviations: L, left; R, right.
Fig. 5
Fig. 5
Correlations between clinical symptoms and cortical folding complexity among brain regions in FES. The blue spot indicates negative correlation between left middle occipital gyrus and paranoid syndrome subscores. The red spot indicates positive correlation between right thalamus and depression subscores (FWHM = 8 mm). Abbreviations: L, left; MOG, middle occipital gyrus; R, right; THA, thalamus.

Similar articles

References

    1. Breakspear M. The nonlinear theory of schizophrenia. Aust. N. Z. J. Psychiatry. 2006;40(1):20–35. - PubMed
    1. Chen Y., Pham T.D. Sample entropy and regularity dimension in complexity analysis of cortical surface structure in early Alzheimer's disease and aging. J. Neurosci. Methods. 2013;215(2):210–217. - PubMed
    1. Chopra S., Segal A., Oldham S., Holmes A., Sabaroedin K., Orchard E.R., et al. Network-based spreading of gray matter changes across different stages of psychosis. JAMA Psychiat. 2023;80(12):1246–1257. - PMC - PubMed
    1. Cuadra M.B., Cammoun L., Butz T., Cuisenaire O., Thiran J.P. Comparison and validation of tissue modelization and statistical classification methods in T1-weighted MR brain images. IEEE Trans. Med. Imaging. 2005;24(12):1548–1565. - PubMed
    1. Dahnke R., Yotter R.A., Gaser C. Cortical thickness and central surface estimation. Neuroimage. 2013;65:336–348. - PubMed