. 2024 Oct 21;4(10):100878.
doi: 10.1016/j.crmeth.2024.100878. Epub 2024 Oct 14.

Generation, expansion, gene delivery, and single-cell profiling in rhesus macaque plasma B cells

Affiliations

Generation, expansion, gene delivery, and single-cell profiling in rhesus macaque plasma B cells

Rene Yu-Hong Cheng et al. Cell Rep Methods. .

Abstract

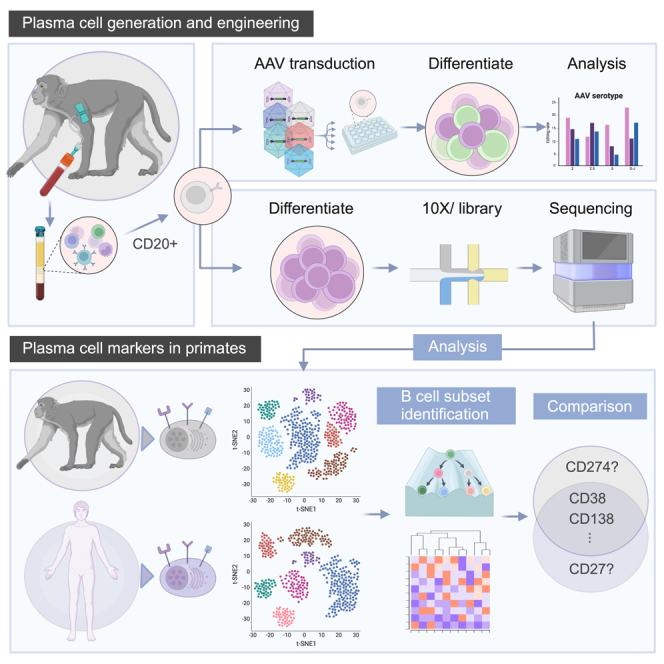
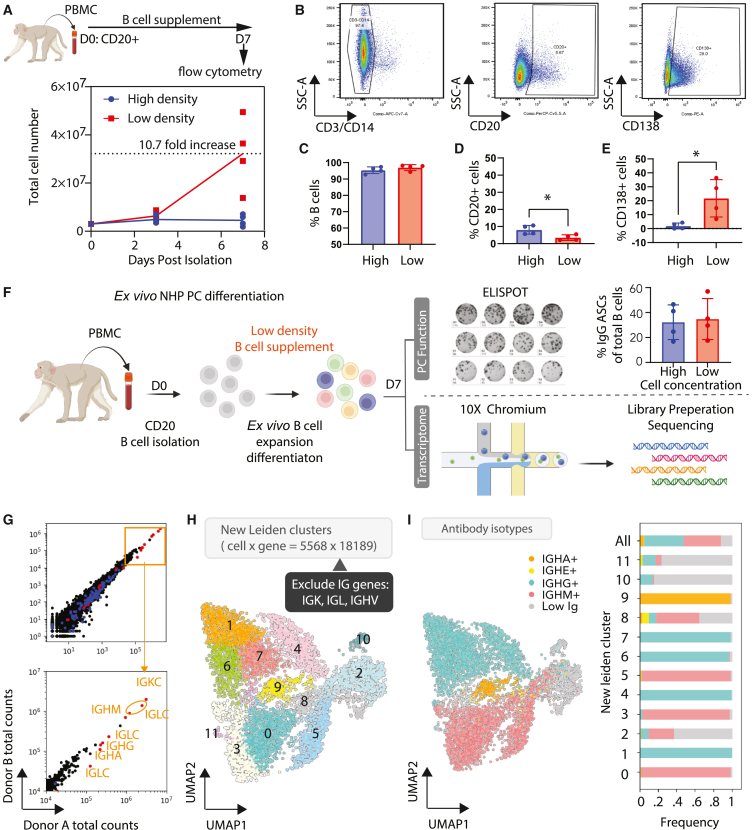
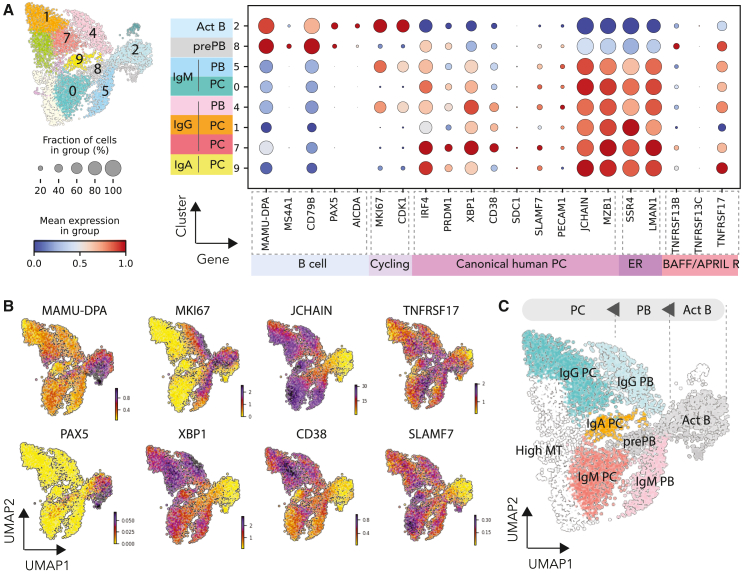
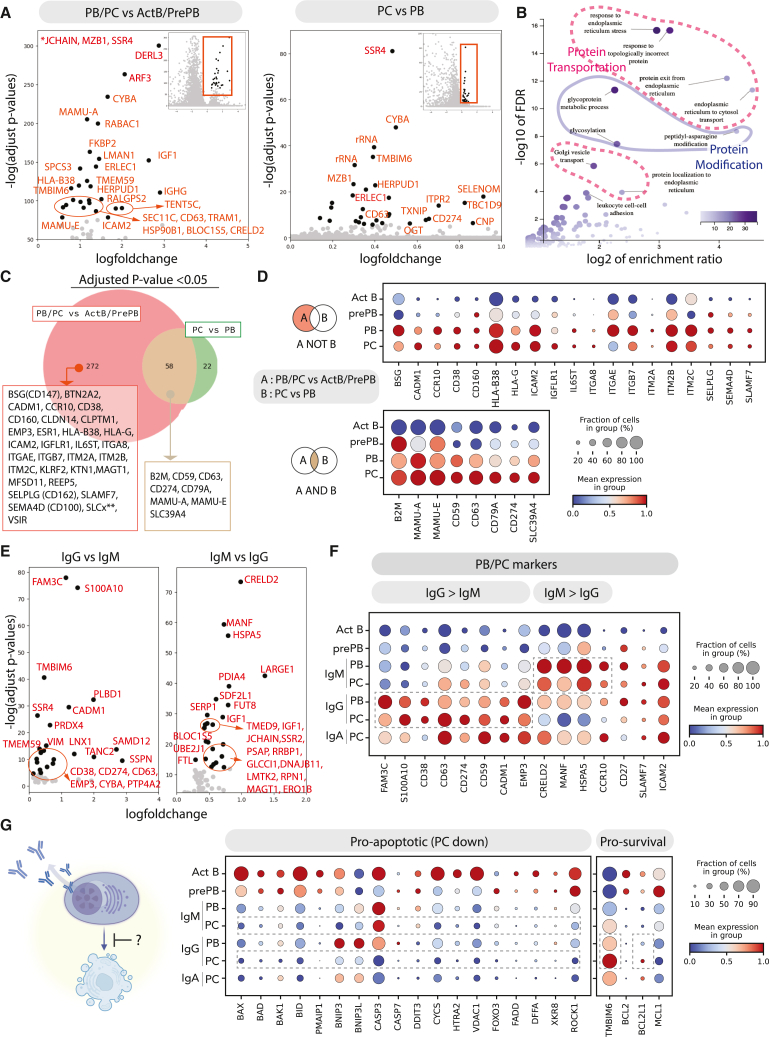
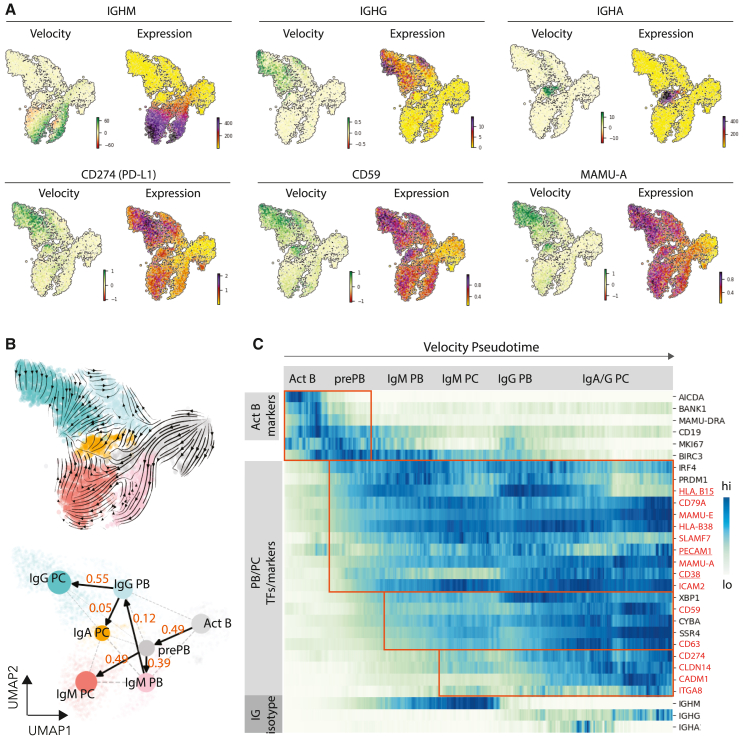
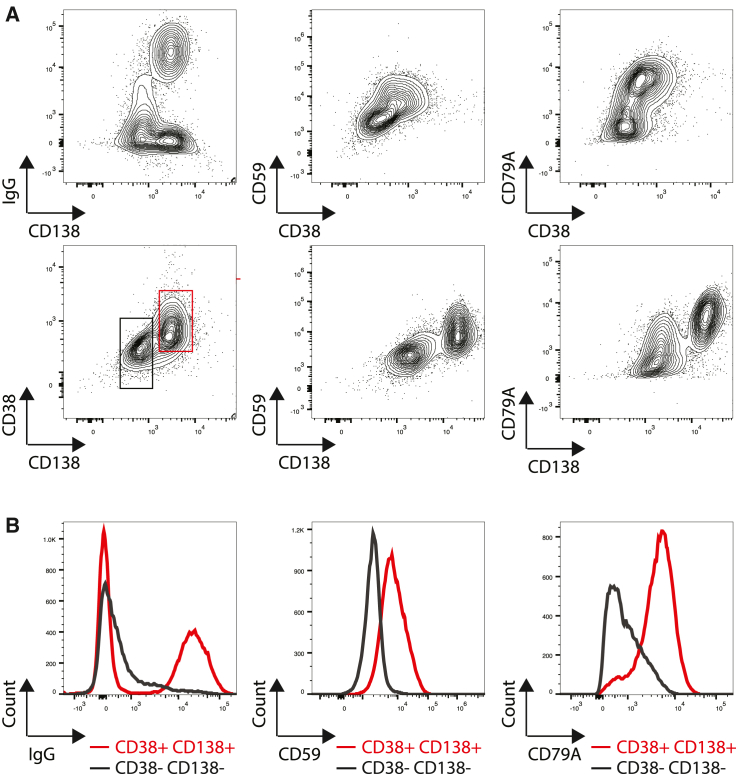
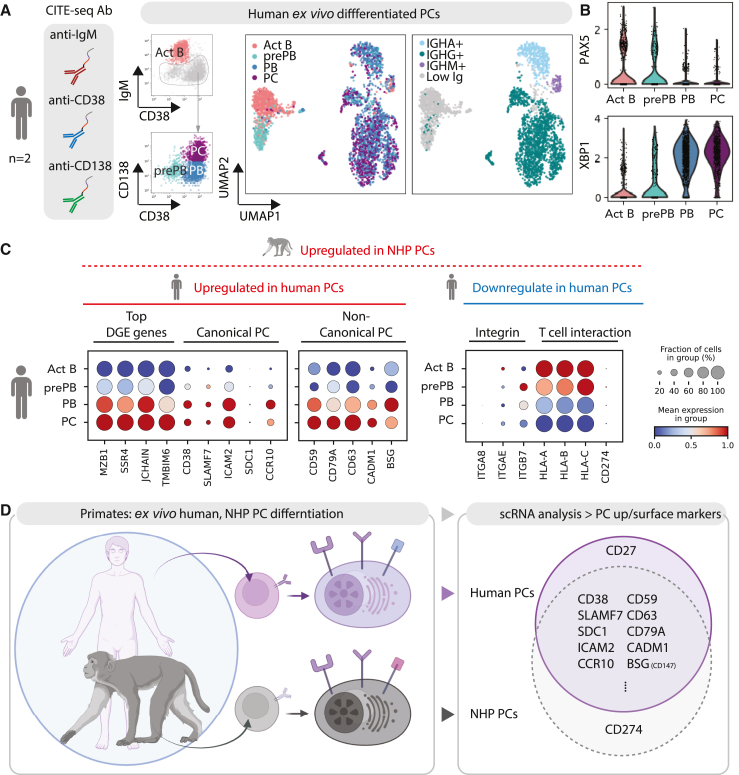
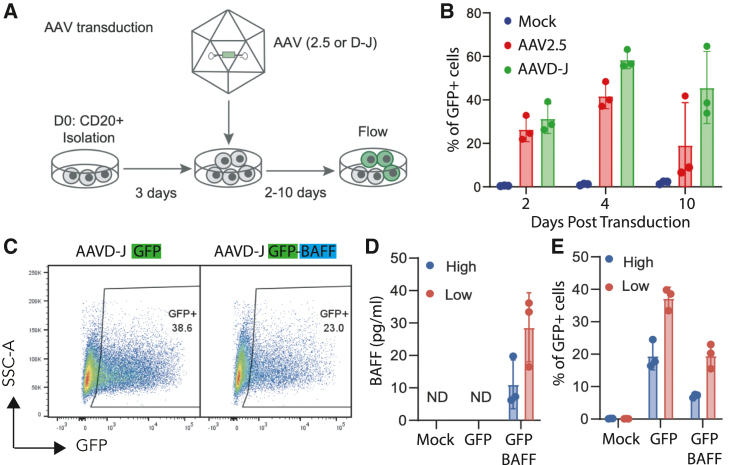
A key step in developing engineered B cells for therapeutic purposes is evaluation in immunocompetent, large-animal models. Therefore, we developed methods to purify, expand, and differentiate non-human primate (NHP; rhesus macaque) B cells. After 7 days in culture, B cells expanded 10-fold, differentiated into a plasma cell phenotype (CD38, CD138), and secreted immunoglobulin G. Using single-cell sequencing and flow cytometry, we verified the presence of plasma cell genes in differentiated NHP B cells and unearthed less-recognized markers, such as CD59 and CD79A. In contrast with human cells, we found that the immune checkpoint molecule CD274 (PD-L1) and major histocompatibility complex (MHC) class I molecules were upregulated in NHP plasma cells in the transcriptional data. Lastly, we established the conditions for efficient transduction of NHP B cells with adeno-associated virus (AAV) vectors, achieving a delivery rate of approximately 60%. We envision that this work will accelerate proof-of-concept studies using engineered B cells in NHPs.

Keywords: AAV; CD59; CD79A; CP: Biotechnology; CP: Immunology; MHC class I; NHP; PD-L1; cell therapy; differentiation; expansion; plasma cell; primate.


Conflict of interest statement

Declaration of interests R.G.J. and D.J.R. hold equity in and serve on the scientific advisory board of Be Biopharma, Inc. S.K. is currently an employee at Astellas Pharma, Y.H. is currently an employee of Sonoma Biotherapeutics, and C.L. is currently an employee of Sartorius AG.

Figures

None
Graphical abstract
Figure 1
Figure 1
Monkey ex-vivo-differentiated PC transcriptome with high immunoglobulin expression (A–E) To assess the impact of cell density, CD20+ NHP B cells were cultured in a commercial B cell medium for 7 days (plated and maintained at 1.5 × 106 cells/mL versus plated at 2.5 × 105 cells/mL and maintained at 1 × 105 cells/mL; 4 donors, n = 4). At day 7 following isolation, the cells were analyzed using flow cytometry. (A) Dynamic of total cell overtime. (B) Representative flow cytometry plots of CD3/CD14, CD20, and CD138 expression. (C) B cells (CD3CD14). (D) Naive B cells (CD20+). (E) Plasma cells (CD138+). (C–E) Mean +/− SD is shown for barplots, and the statistical significance is determined by unpaired Student's t test. ∗p value < 0.05. (F) Schematic workflow of monkey ex-vivo-differentiated PC generation for functional (n = 4) and transcriptional (n = 2) profile characterization. (G) Scatterplot of RNA total counts from two donors (n = 2). Red dots represent immunoglobulin constant genes, and blue dots represent immunoglobulin variable genes. (H) UMAP Leiden clusters after removing immunoglobulin light-chain genes and variable genes. (I) UMAP of antibody isotype. A bar graph of the percentage of antibody isotype in each cluster is shown.
Figure 2
Figure 2
Monkey ex-vivo-differentiated PC subset classification and differential expression analysis for PCs (A) Dot plot visualization of ex-vivo-differentiated PCs: subsets are listed on the y axis and genes (features) are listed along the x axis. Dot size represents the percentage of cells in a group expressing each gene; dot color indicates the normalized mean expression level in a group. (B) Heatmap showing expression of representative genes of PC markers (CD38, JCHAIN, XBP1) and proliferating marker (MKI67). (C) Cluster renamed to B cell subsets based on the gene features from (A) and (B).
Figure 3
Figure 3
Monkey PCs’ potential markers from differentially expressed genes (A) Volcano plot of differential expression genes: PBs/PCs versus activated B cells/pre-PBs and PCs versus PBs. Only the top 30 differential genes are highlighted as black dots. ∗JCHAIN, MZB1, and SSR4 are infinitely small adjusted p values and not plotted in the plot. (B) Volcano plot of enriched gene set from an over-representation analysis using the single-cell anslysis in Python algorithm. Heatmap represents the number of genes enriched in each gene set. (C) Venn diagram of genes upregulated in PB/PCs and PCs by comparison with activated B cells/pre-PBs and PBs with adjusted p value <0.05. Only surface markers for some transmembrane genes are highlighted. (D) Dot plot visualization of ex-vivo-differentiated PCs: subsets are listed on the y axis and genes (features) are listed along the x axis. (E) Volcano plot of differential expression genes: IgG PBs/PCs versus IgM PBs/PCs (left) and IgM PBs/PCs versus IgG PBs/PCs (right). Only the top 25 differential genes are highlighted as black dots. (F) Dot plot visualization of ex-vivo-differentiated PBs/PCs: subsets with different isotypes are listed on the y axis and representative surface marker genes or genes from (E) are listed along the x axis. (G) Schematic cartoon of a PC’s anti-apoptotic program. Dot plot visualization of ex-vivo-differentiated PBs/PCs: subsets with different isotypes are listed on the y axis and representative anti-/pro-apoptotic genes are listed along the x axis.
Figure 4
Figure 4
Monkey PCs’ dynamic expression (A) Heatmap of indicated gene velocity and RNA expression level superimposed onto UMAP. (B) Velocities derived from the stochastic model and visualized as streamlines in a UMAP-based embedding (top). PAGA/transition confidence probability from one node to the next node (bottom). (C) Expression heatmap of genes shows gene regulation along plasma cell development and genes upregulated in PCs from differentially expressed gene (DEG) analysis. The velocity pseudotime is shown along the x axis and the indicated genes are shown on the y axis. Potential PC markers are highlighted orange.
Figure 5
Figure 5
Using flow cytometry to validate non-canonical markers for NHP PCs (A) Flow plot of canonical PC markers (CD38, CD138) and IgG versus non-canonical markers. (B) IgG, CD59, and CD79A expression in CD38CD138 B cells versus CD38+CD138+ PCs. CD59 and CD38 were stained prior to fixation, while CD138, CD79A, and IgG were stained after fixation.
Figure 6
Figure 6
Comparison of human and monkey PC makers by scRNA-seq analysis (A) Ex-vivo-differentiated human PCs with CITE-seq. Classification of B cell subsets categorized by the indicated protein markers: IgMhiCD38lo (activated B cells, ActB), IgMloCD38lo (pre-PBs), CD38hiCD138lo (PBs), and CD38hiCD138hi (PCs). B cell subsets and isotype are superimposed onto UMAP; day 13 B cells (n = 2,897) are from two biological replicates. (B) Violin plot of indicated genes. (C) Dot plot visualization of ex-vivo-differentiated human PC: subsets are listed on the y axis and representative genes from Figure 3D are listed along the x axis. (D) Schematic cartoon summary of human PC markers compared with monkey PC markers from scRNA analysis. ∗MHC class I is expressed in most cell types but is not ideal as a marker for NHP PCs.
Figure 7
Figure 7
Efficient transduction of NHP B cells with the AAV (A) Diagram of the AAV and transduction and culturing protocol. (B) NHP CD20+ B cells were cultured for 3 days before transduction with the indicated AAV pseudotypes expressing GFP (MOI = 4 × 104). Transduction efficiency was quantified by flow cytometry at the indicated time points. (C–E) NHP CD20+ B cells grown at high (1.5 × 106 cells/mL) or low (2.5 × 105 cells/mL) density were transduced with either AAV D-J GFP or AAV D-J GFP-BAFF (3 donors, n = 3). (C) Representative flow plot of GFP and GFP-BAFF transduced cells. (D) Bar plot of BAFF secretion was quantified 4 days post-transduction. (E) Bar plot of percentage of GFP+ cells with indicated high or low cell density and AAV. (B), (D), and (E) Mean +/− SD is shown for barplots.

References

    1. Cheng R.Y.-H., Hung K.L., Zhang T., Stoffers C.M., Ott A.R., Suchland E.R., Camp N.D., Khan I.F., Singh S., Yang Y.-J., et al. Ex vivo engineered human plasma cells exhibit robust protein secretion and long-term engraftment in vivo. Nat. Commun. 2022;13:6110. - PMC - PubMed
    1. Cheng R.Y.-H., de Rutte J., Ito C.E.K., Ott A.R., Bosler L., Kuo W.-Y., Liang J., Hall B.E., Rawlings D.J., Di Carlo D., James R.G. SEC-seq: association of molecular signatures with antibody secretion in thousands of single human plasma cells. Nat. Commun. 2023;14:3567. - PMC - PubMed
    1. Vamva E., Ozog S., Leaman D.P., Yu-Hong Cheng R., Irons N.J., Ott A., Stoffers C., Khan I., Goebrecht G.K.E., Gardner M.R., et al. A lentiviral vector B cell gene therapy platform for the delivery of the anti-HIV-1 eCD4-Ig-knob-in-hole-reversed immunoadhesin. Mol. Ther. Methods Clin. Dev. 2023;28:366–384. - PMC - PubMed
    1. Hill T.F., Narvekar P., Asher G.D., Edelstein J.N., Camp N.D., Grimm A., Thomas K.R., Leiken M.D., Molloy K.M., Cook P.J., et al. Human plasma cells engineered to secrete bispecifics drive effective in vivo leukemia killing. Mol. Ther. 2024;32:2676–2691. - PMC - PubMed
    1. Hung K.L., Meitlis I., Hale M., Chen C.-Y., Singh S., Jackson S.W., Miao C.H., Khan I.F., Rawlings D.J., James R.G. Engineering Protein-Secreting Plasma Cells by Homology-Directed Repair in Primary Human B Cells. Mol. Ther. 2018;26:456–467. - PMC - PubMed

LinkOut - more resources