. 2024 Nov 13;4(11):100674.
doi: 10.1016/j.xgen.2024.100674. Epub 2024 Oct 14.

Long-read sequencing of an advanced cancer cohort resolves rearrangements, unravels haplotypes, and reveals methylation landscapes

Affiliations

Long-read sequencing of an advanced cancer cohort resolves rearrangements, unravels haplotypes, and reveals methylation landscapes

Kieran O'Neill et al. Cell Genom. .

Abstract

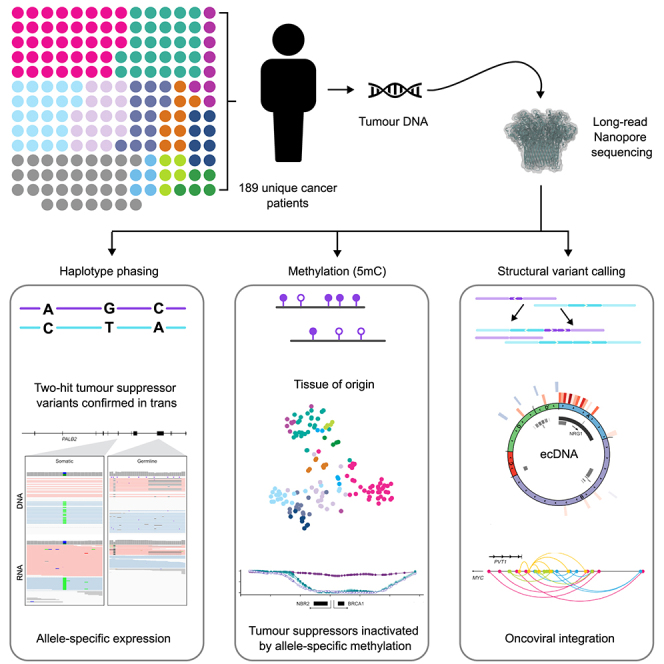
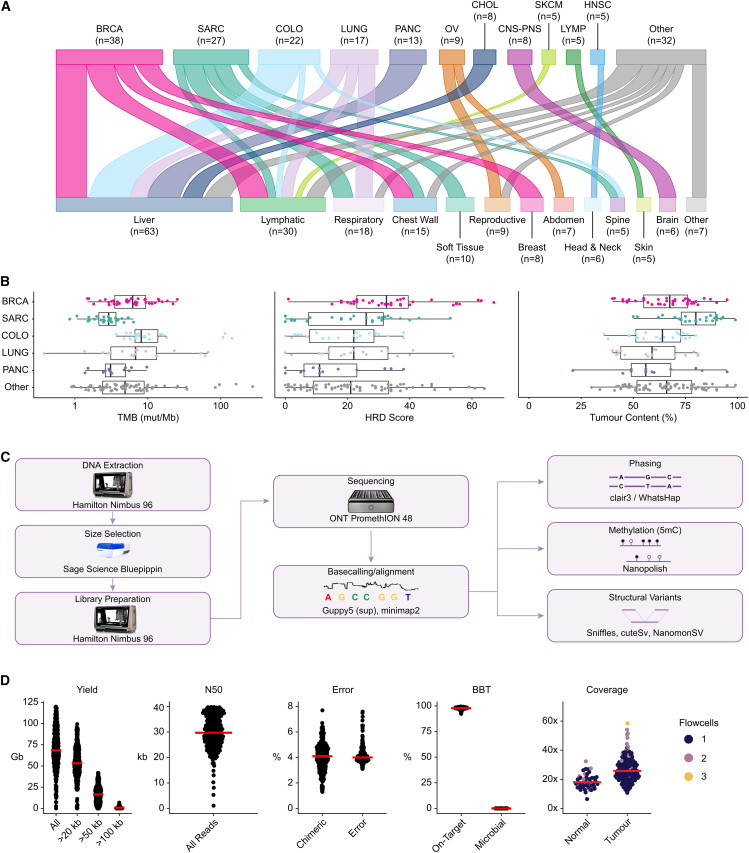
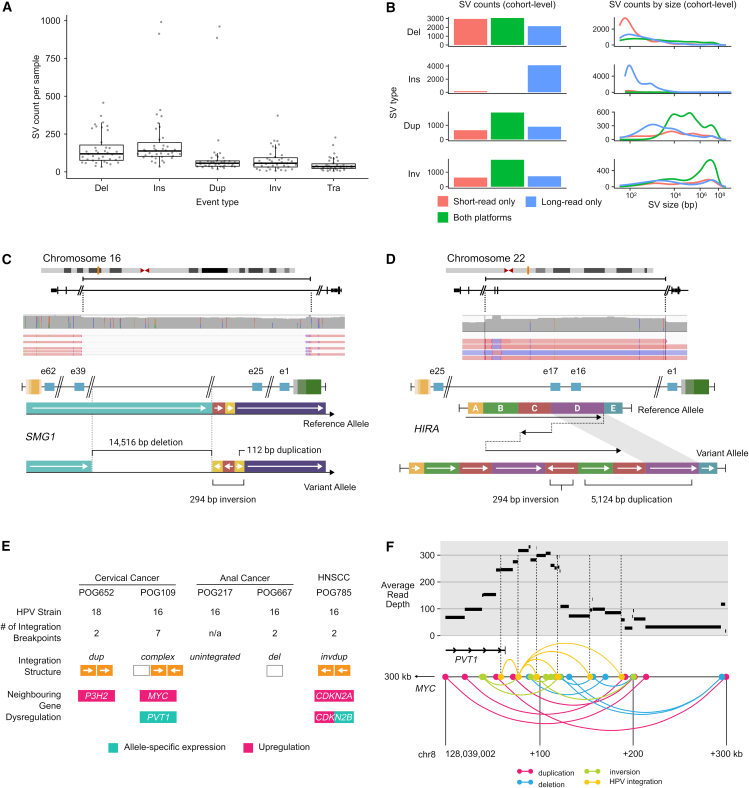
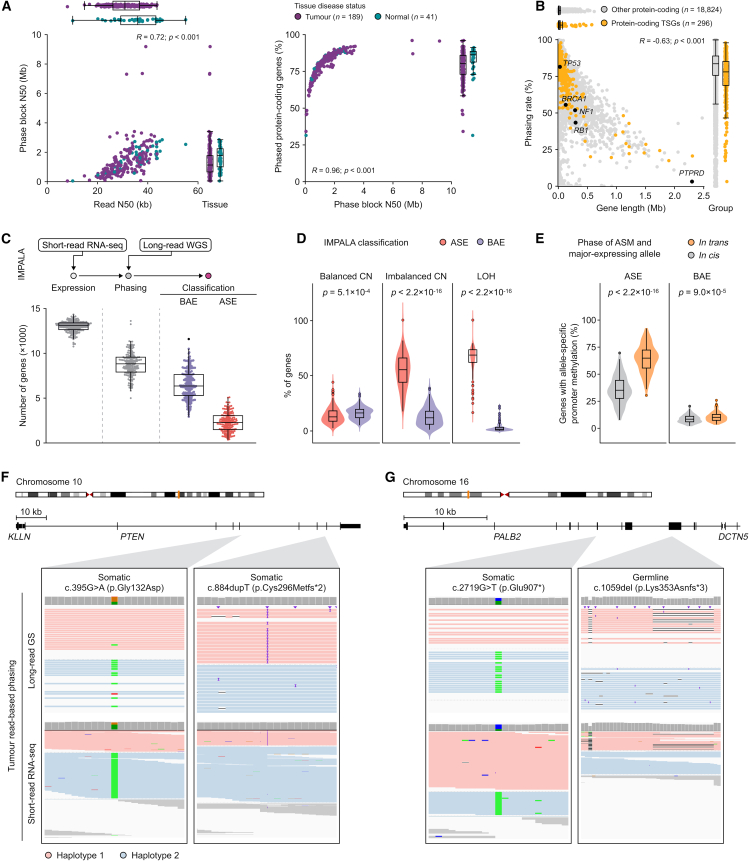
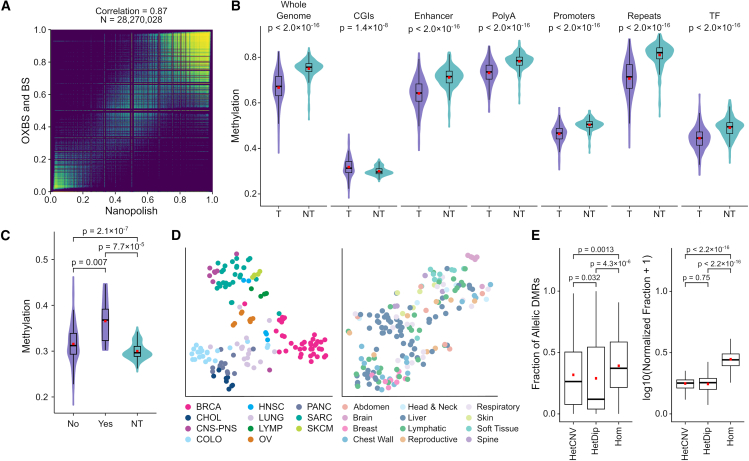
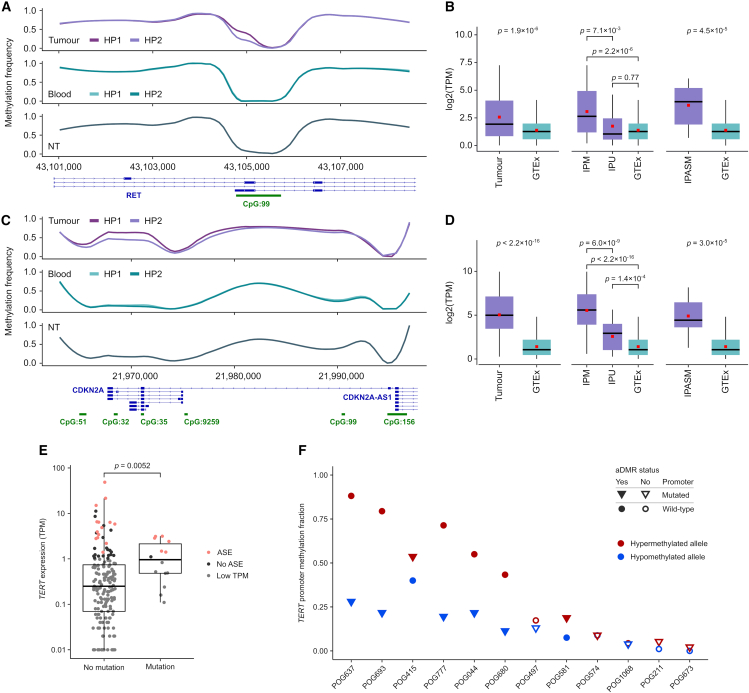
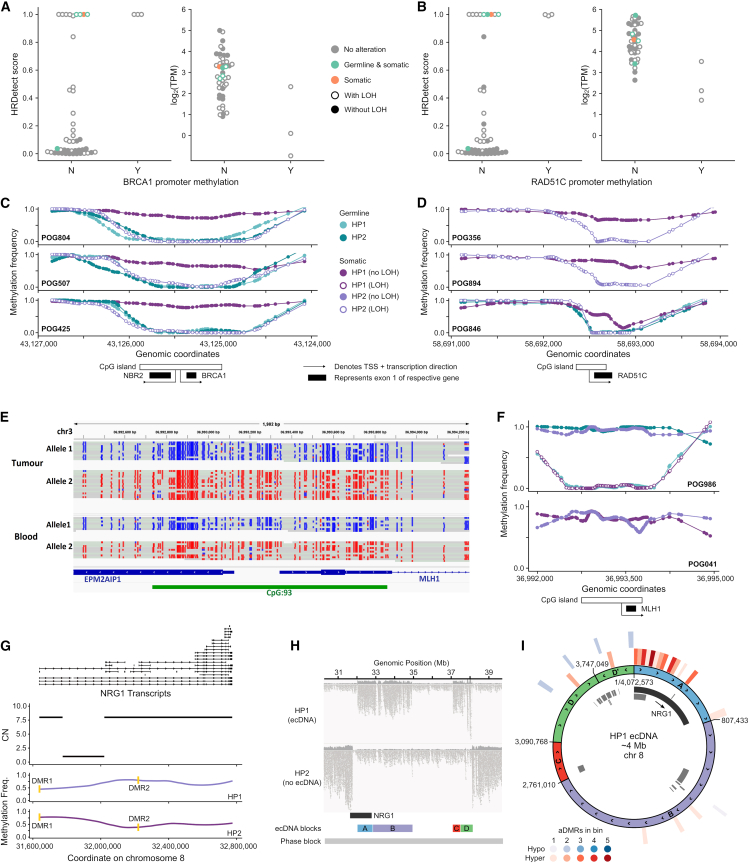
The Long-Read Personalized OncoGenomics (POG) dataset comprises a cohort of 189 patient tumors and 41 matched normal samples sequenced using the Oxford Nanopore Technologies PromethION platform. This dataset from the POG program and the Marathon of Hope Cancer Centres Network includes DNA and RNA short-read sequence data, analytics, and clinical information. We show the potential of long-read sequencing for resolving complex cancer-related structural variants, viral integrations, and extrachromosomal circular DNA. Long-range phasing facilitates the discovery of allelically differentially methylated regions (aDMRs) and allele-specific expression, including recurrent aDMRs in the cancer genes RET and CDKN2A. Germline promoter methylation in MLH1 can be directly observed in Lynch syndrome. Promoter methylation in BRCA1 and RAD51C is a likely driver behind homologous recombination deficiency where no coding driver mutation was found. This dataset demonstrates applications for long-read sequencing in precision medicine and is available as a resource for developing analytical approaches using this technology.

Keywords: TFRI MOHCCN; allele-specific expression; allelically differentially methylated regions (aDMRs); cancer genomics; extrachromosomal DNA; homologous recombination deficiency; long-range phasing; nanopore long-read sequencing; personalized medicine; structural variant detection.


Conflict of interest statement

Declaration of interests The following authors disclose relevant potential competing interests: K.O.N., V.P., L.F.P., K.D., J.L., and S.J.M.J. received travel funding from Oxford Nanopore Technologies to present at conferences in 2022 and 2023.

Figures

None
Graphical abstract
Figure 1
Figure 1
Nanopore long-read sequencing of an advanced cancer cohort (A) Tumor types (top) and metastatic sites (bottom) for patient samples. Each patient is represented once; tissue groups with fewer than five samples are shown under “other.” (B) Genomic features of tumors by type. TMB, tumor mutation burden; mut/Mb, mutations per megabase; HRD, homologous recombination deficiency; BRCA, breast; SARC, sarcoma; COLO, colorectal; PANC, pancreatic. Boxplots represent the median and upper and lower quartiles of the distribution, and whiskers represent 1.5× interquartile range (IQR). “Other” tumor group includes all tumors not in the five most common tumor types, n = 72. (C) Schematic overview of the laboratory methods and primary analysis for this cohort. (D) Fold coverage per sample sequenced and per-flow cell quality control statistics. Red bars indicate medians. Median yield of 68.4 Gbp per flow cell. Using BioBloom tools, a median of 97.8% of reads matched the human reference, while no sample showed more than 0.2% of reads matching microbial taxa.
Figure 2
Figure 2
Structural variants (A) Per-sample counts of somatic SV calls in samples with matched normal (n = 43). Boxplots represent median, upper, and lower quartiles; whiskers represent 1.5× IQR. Del, deletion; Ins, insertion; Dup, duplication; Inv, inversion; Tra, translocation. (B) Concordance of SV calling between platforms, summed across cohort. (C) Schematic of a resolved complex foldback inversion affecting SMG1, including a deletion of exons 26–38, detected only in the nanopore data. (D) Schematic of a resolved complex foldback inversion affecting HIRA, including duplication of exons 16–17, detected only in the nanopore data. (E) Features of HPV integration characterized using nanopore sequencing in the five tumors with HPV. (F) Diagram of a complex rearrangement (bottom) and alterations in read depth (top) involving HPV integration sites in a cervical cancer (POG109).
Figure 3
Figure 3
Phasing (A) Spearman's correlation between read length, phase block size, and phasing rate for Ensembl 100 protein-coding genes (plus promoters) across normal and tumor tissues. (B) Spearman's correlation between gene length and phasing rate for protein-coding genes (percentage of tumors in which a gene plus promoter could be fully phased). (C) Summary of IMPALA results for the cohort, showing number of genes with sufficient expression to be considered (<1 TPM), number with sufficient expression and at least one phasing SNP, and their final classification as having allele-specific expression (ASE) or balanced allelic expression (BAE). (D) Percentage of genes in regions of the tumor genome with balanced copy number (CN), imbalanced CN, or LOH that were classified as ASE or BAE. (E) Percentage of genes with allele-specific promoter methylation by the relative phase of the major expressed allele for ASE and BAE genes. Boxplots represent median, upper, and lower quartiles; whiskers represent 1.5× IQR for (C), (D), and (E). The p values are Wilcoxon rank-sum test for (D) and (E). (F and G) Examples of biallelic variants in tumor suppressor genes with ASE (F) and BAE (G). Reads are colored by predicted haplotype from long-read-based phasing, and reads that could not be assigned to a haplotype are colored in gray.
Figure 4
Figure 4
Methylation (A) Correlation of nanopolish methylation frequency with WGBS for POG044. BS, bisulfite sequencing; OXBS, oxidative bisulfite sequencing. (B) Average methylation across tumors (T) compared with public WGBS methylation data from normal tissues and cells (NT), genome wide and at different genomic regions. (C) Average methylation at CGIs in POG cases with either IDH-activating or TET-inactivating mutations (yes) compared with the remainder of the cohort (no) and public normal tissue (NT). (D) tSNE plots based on DNA methylation at regulatory regions, compared with tumor type (left) and biopsy site (right). (E) aDMR distributions by copy number (CN). Heterozygous diploid (HetDip) indicates CN-balanced regions. Heterozygous copy number variant (HetCNV) indicates CNV regions with both parental alleles. Homozygous (Hom) indicates LOH. All p values are Wilcoxon rank-sum test. Boxplots represent median, upper, and lower quartiles; whiskers represent 1.5× IQR.
Figure 5
Figure 5
Methylation in specific cancer genes (A) DNA methylation at RET intragenic promoter CpGs, compared with patient blood and normal tissue (NT). (B) RET gene expression compared with GTEx normal tissues in (left) the whole cohort, (center) samples with >25% intragenic promoter methylation (IPM) vs. other samples (intragenic promoter unmethylated [IPU]), and (right) only those samples with an aDMR at the intragenic promoter (IPASM). Only samples with TPM > 1 were used for expression comparison. (C and D) The same analysis as in (A) and (B) but for CDKN2A. Note that in (A) and (C) the haplotags were swapped so that HP1 represents the hypermethylated allele. (E) TERT expression in samples with and without TERT promoter hotspot mutation at chr5:1,295,113 or chr5:1,295,135. (F) Average allele-specific methylation of the core TERT promoter (153 CpGs in chr5:1,294,414–1,295,655). aDMRs are noted when an aDMR overlapping the hotspot mutation coordinates was identified by the software DSS and average allele-specific methylation differed by at least 0.1 between alleles within the defined core TERT promoter. All p values are Wilcoxon rank-sum test. Boxplots represent median, upper, and lower quartiles; whiskers represent 1.5× IQR. TPM, transcripts per million.
Figure 6
Figure 6
Integrative analyses (A–D) BRCA1 (A) and RAD51C (B) HRDetect scores (left) and expression values (right) for breast and ovarian samples with or without promoter methylation in BRCA1 or RAD51C. Samples with deleterious alterations in five key HR genes (BRCA1, BRCA2, ATM, PALB2, and RAD51C) are colored orange (somatic) and green (germline and somatic). Haplotype-specific DNA methylation frequencies at the BRCA1/NBR2 (C) and RAD51C (D) promoter regions in HRD samples (HRDetect score ≥ 0.7) with promoter methylation. Germline refers to a matched blood sample from the same individual. (E) Haplotype-specific DNA methylation at the MLH1 promoter in a lung squamous cell carcinoma sample with MLH1 germline epimutation. (F) Haplotype-specific DNA methylation frequencies at the MLH1 promoter region in a lung squamous cell carcinoma sample with MLH1 germline epimutation (top) and in a uterine endometrioid carcinoma sample with somatic MLH1 promoter methylation (bottom). (G) Haplotype-specific methylation and copy number for NRG1 in breast cancer sample POG816. The 3′ amplification was included within an ecDNA. Promoter aDMRs are highlighted in yellow. (H) Haplotype-phased long reads mapped to the ecDNA region. (I) Circos plot of the NRG1-containing ecDNA, highlighting DMRs and methylation states. Inner track: gene annotations, with NRG1 highlighted. Outer tracks: binned counts of aDMRs, showing substantial enrichment at the 5′ end of NRG1.

References

    1. Priestley P., Baber J., Lolkema M.P., Steeghs N., de Bruijn E., Shale C., Duyvesteyn K., Haidari S., van Hoeck A., Onstenk W., et al. Pan-cancer whole-genome analyses of metastatic solid tumours. Nature. 2019;575:210–216. doi: 10.1038/s41586-019-1689-y. - DOI - PMC - PubMed
    1. Pleasance E., Titmuss E., Williamson L., Kwan H., Culibrk L., Zhao E.Y., Dixon K., Fan K., Bowlby R., Jones M.R., et al. Pan-cancer analysis of advanced patient tumors reveals interactions between therapy and genomic landscapes. Nat. Cancer. 2020;1:452–468. doi: 10.1038/s43018-020-0050-6. - DOI - PubMed
    1. Zehir A., Benayed R., Shah R.H., Syed A., Middha S., Kim H.R., Srinivasan P., Gao J., Chakravarty D., Devlin S.M., et al. Mutational landscape of metastatic cancer revealed from prospective clinical sequencing of 10,000 patients. Nat. Med. 2017;23:703–713. doi: 10.1038/nm.4333. - DOI - PMC - PubMed
    1. Chalmers Z.R., Connelly C.F., Fabrizio D., Gay L., Ali S.M., Ennis R., Schrock A., Campbell B., Shlien A., Chmielecki J., et al. Analysis of 100,000 human cancer genomes reveals the landscape of tumor mutational burden. Genome Med. 2017;9:34. doi: 10.1186/s13073-017-0424-2. - DOI - PMC - PubMed
    1. Wong M., Mayoh C., Lau L.M.S., Khuong-Quang D.-A., Pinese M., Kumar A., Barahona P., Wilkie E.E., Sullivan P., Bowen-James R., et al. Whole genome, transcriptome and methylome profiling enhances actionable target discovery in high-risk pediatric cancer. Nat. Med. 2020;26:1742–1753. doi: 10.1038/s41591-020-1072-4. - DOI - PubMed

MeSH terms

Substances