. 2024 Nov 12;57(11):2597-2614.e13.
doi: 10.1016/j.immuni.2024.09.013. Epub 2024 Oct 14.

CRISPR screens unveil nutrient-dependent lysosomal and mitochondrial nodes impacting intestinal tissue-resident memory CD8+ T cell formation

Affiliations

CRISPR screens unveil nutrient-dependent lysosomal and mitochondrial nodes impacting intestinal tissue-resident memory CD8+ T cell formation

Jana L Raynor et al. Immunity. .

Abstract

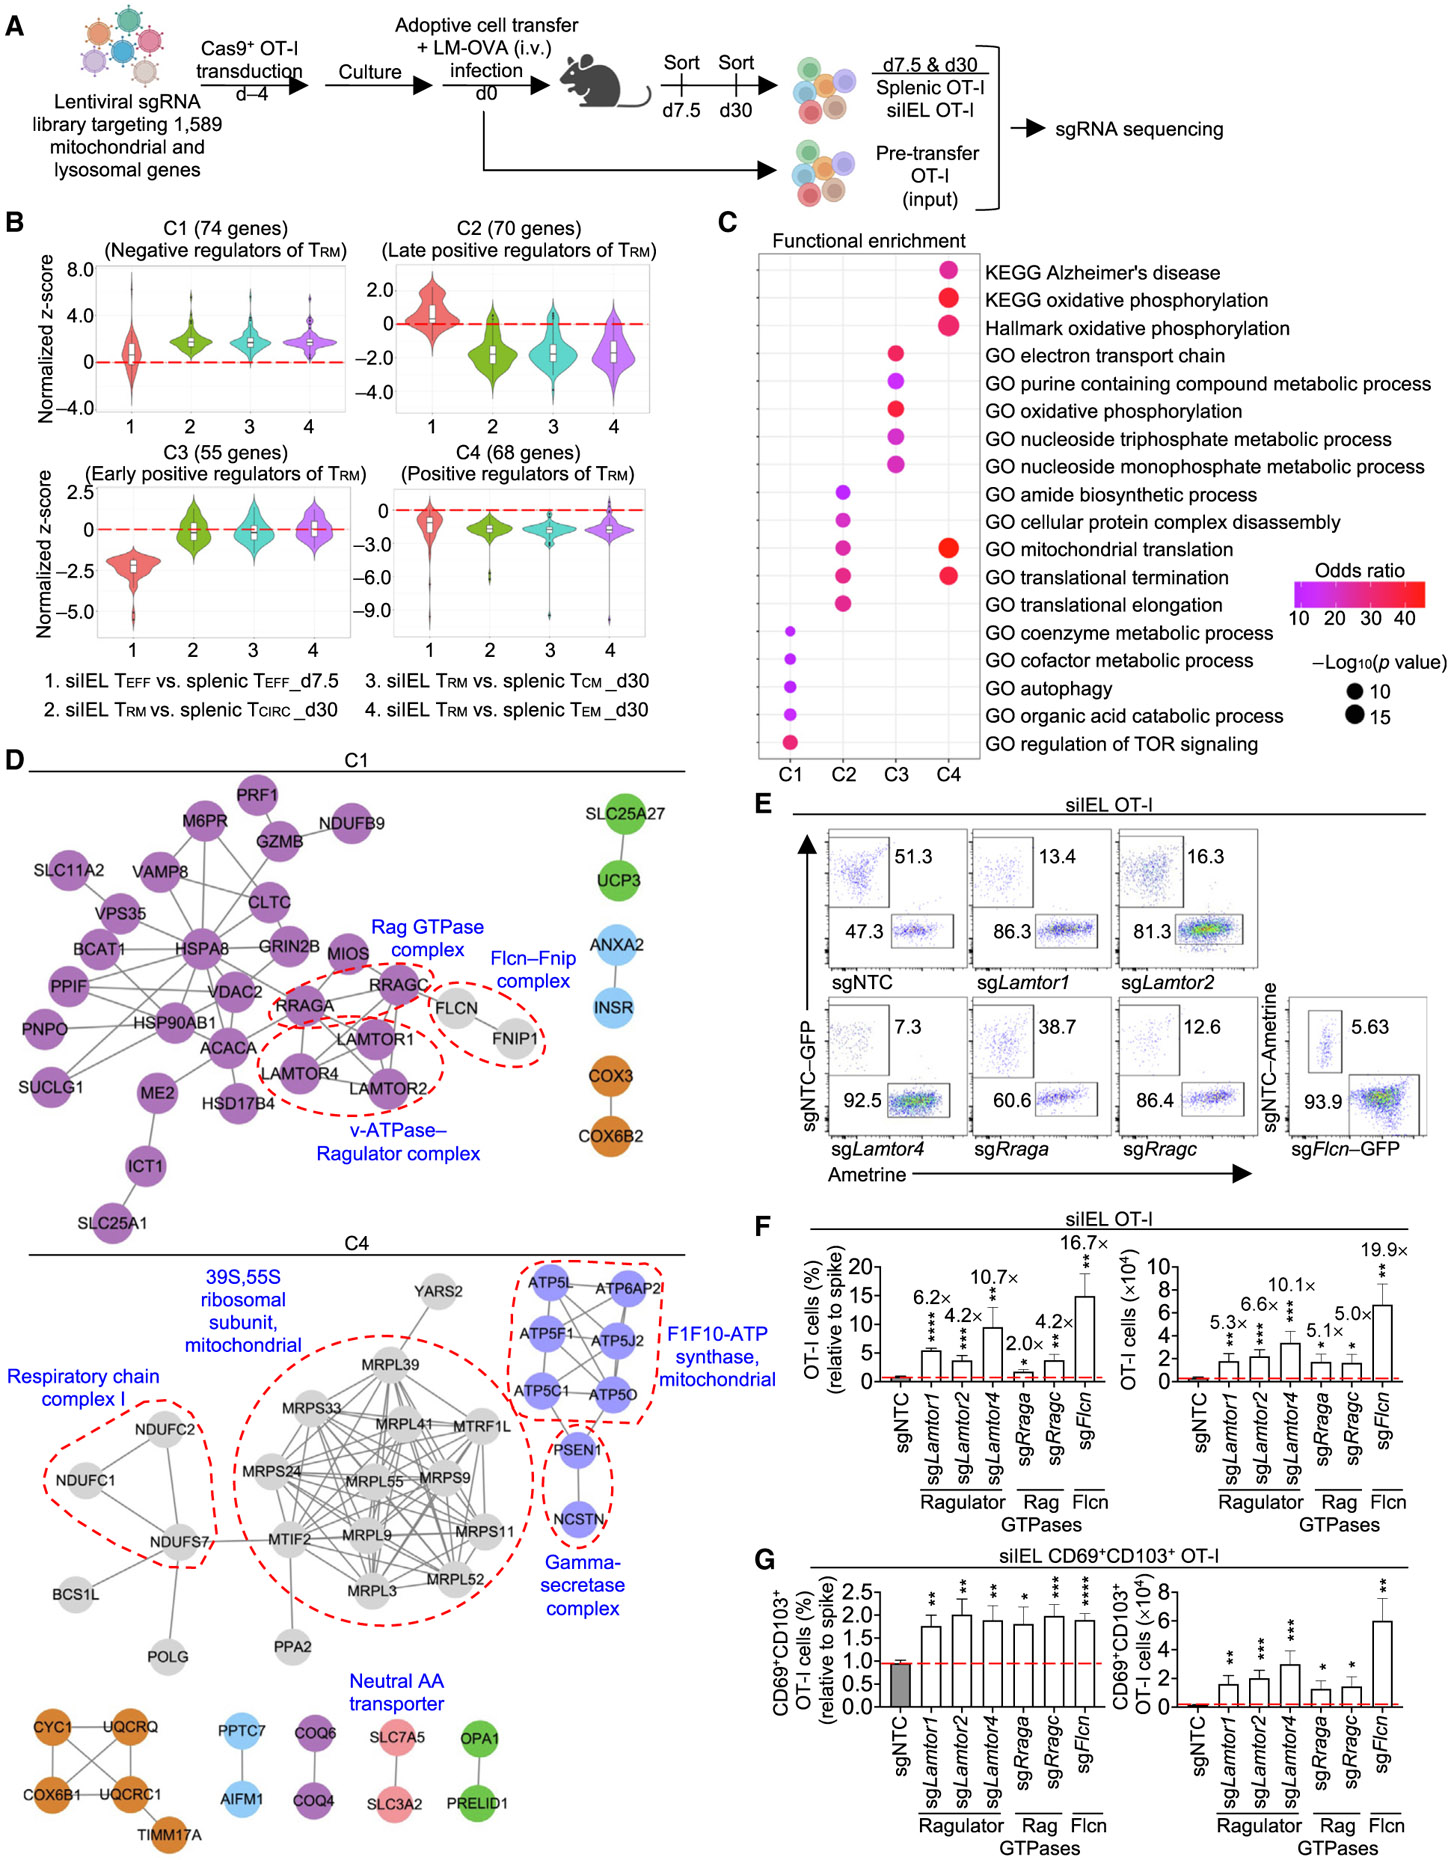
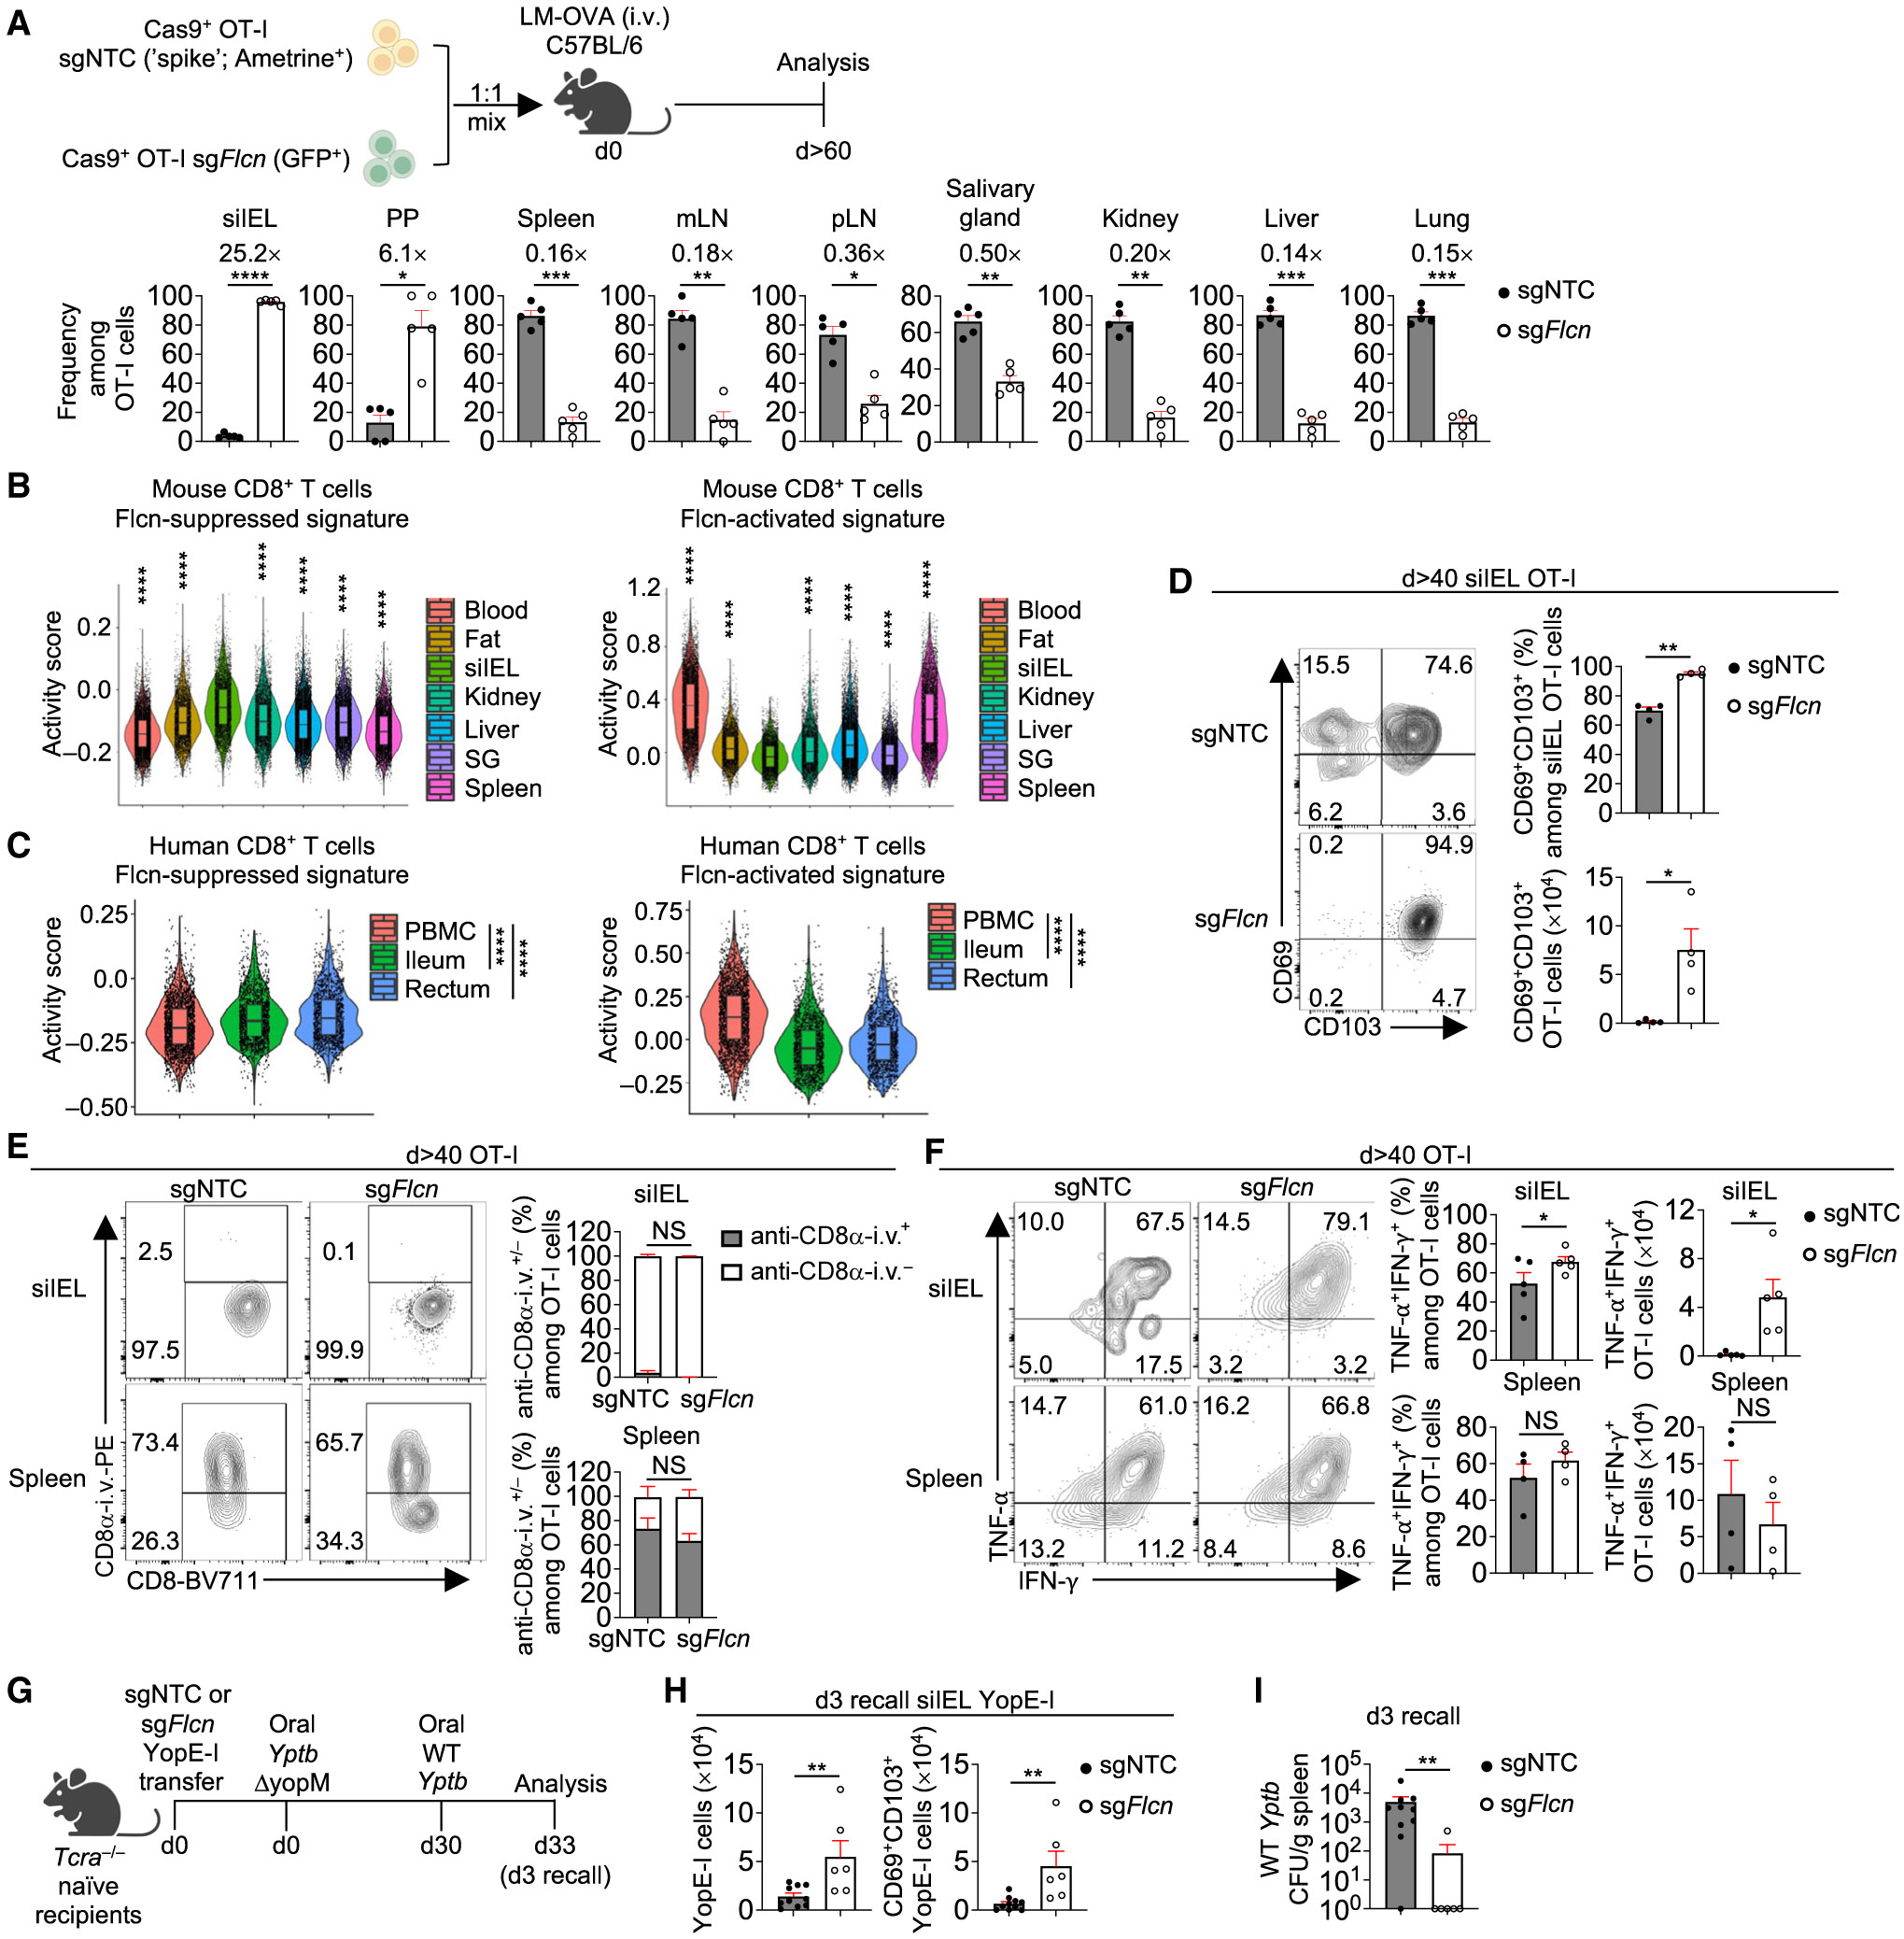
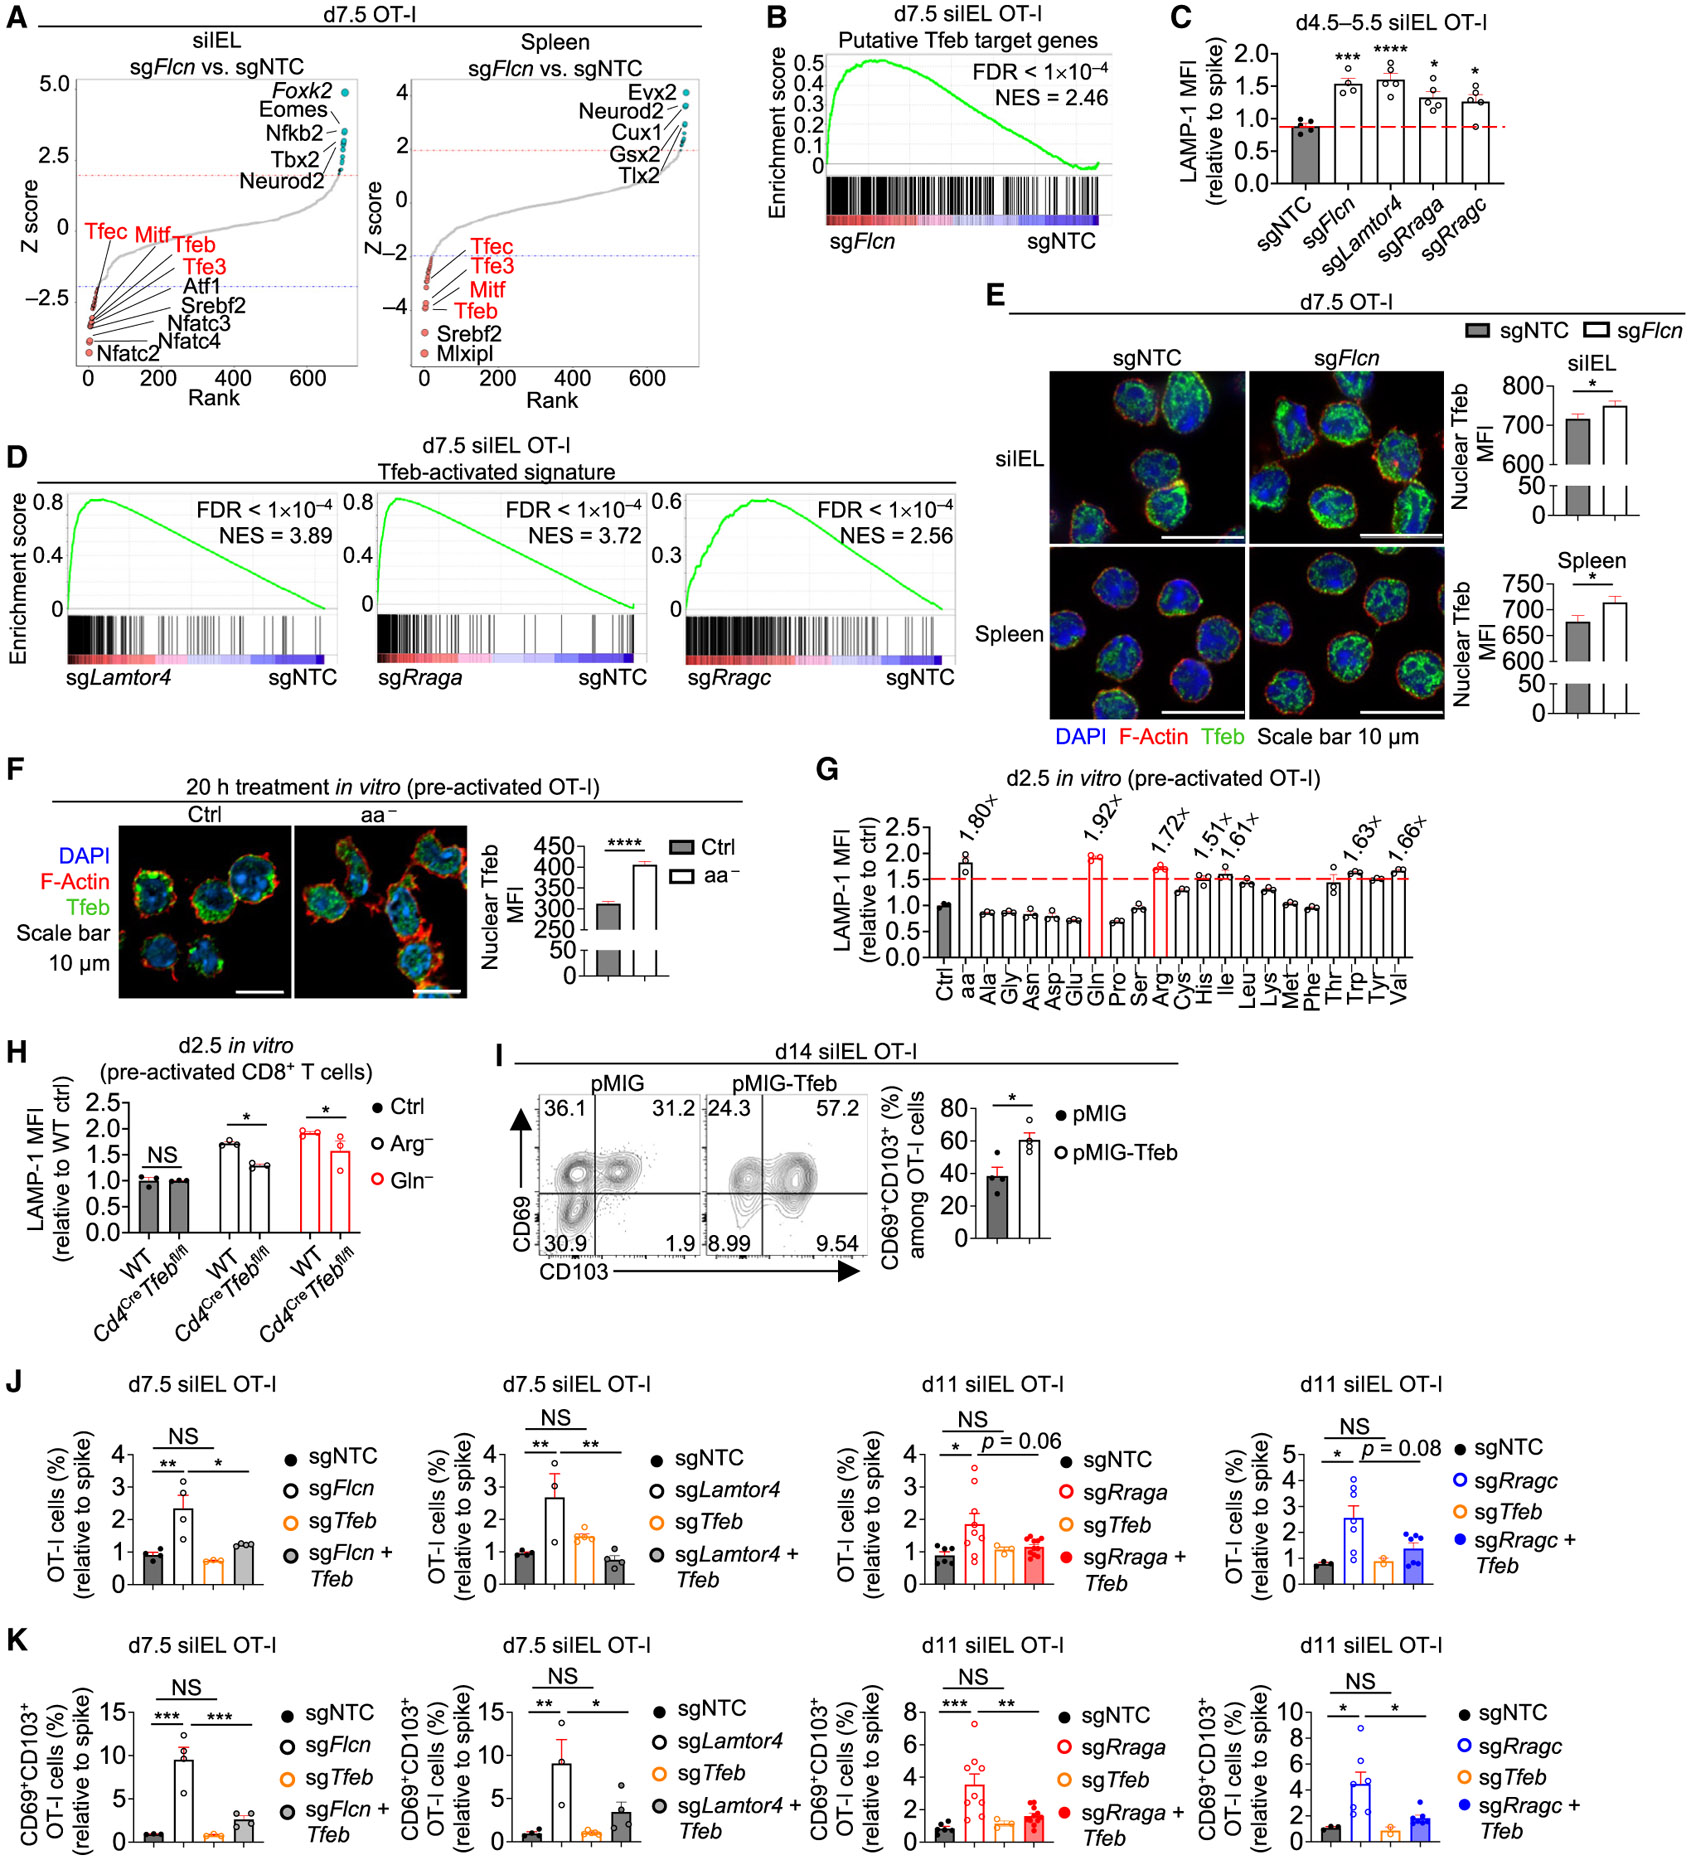
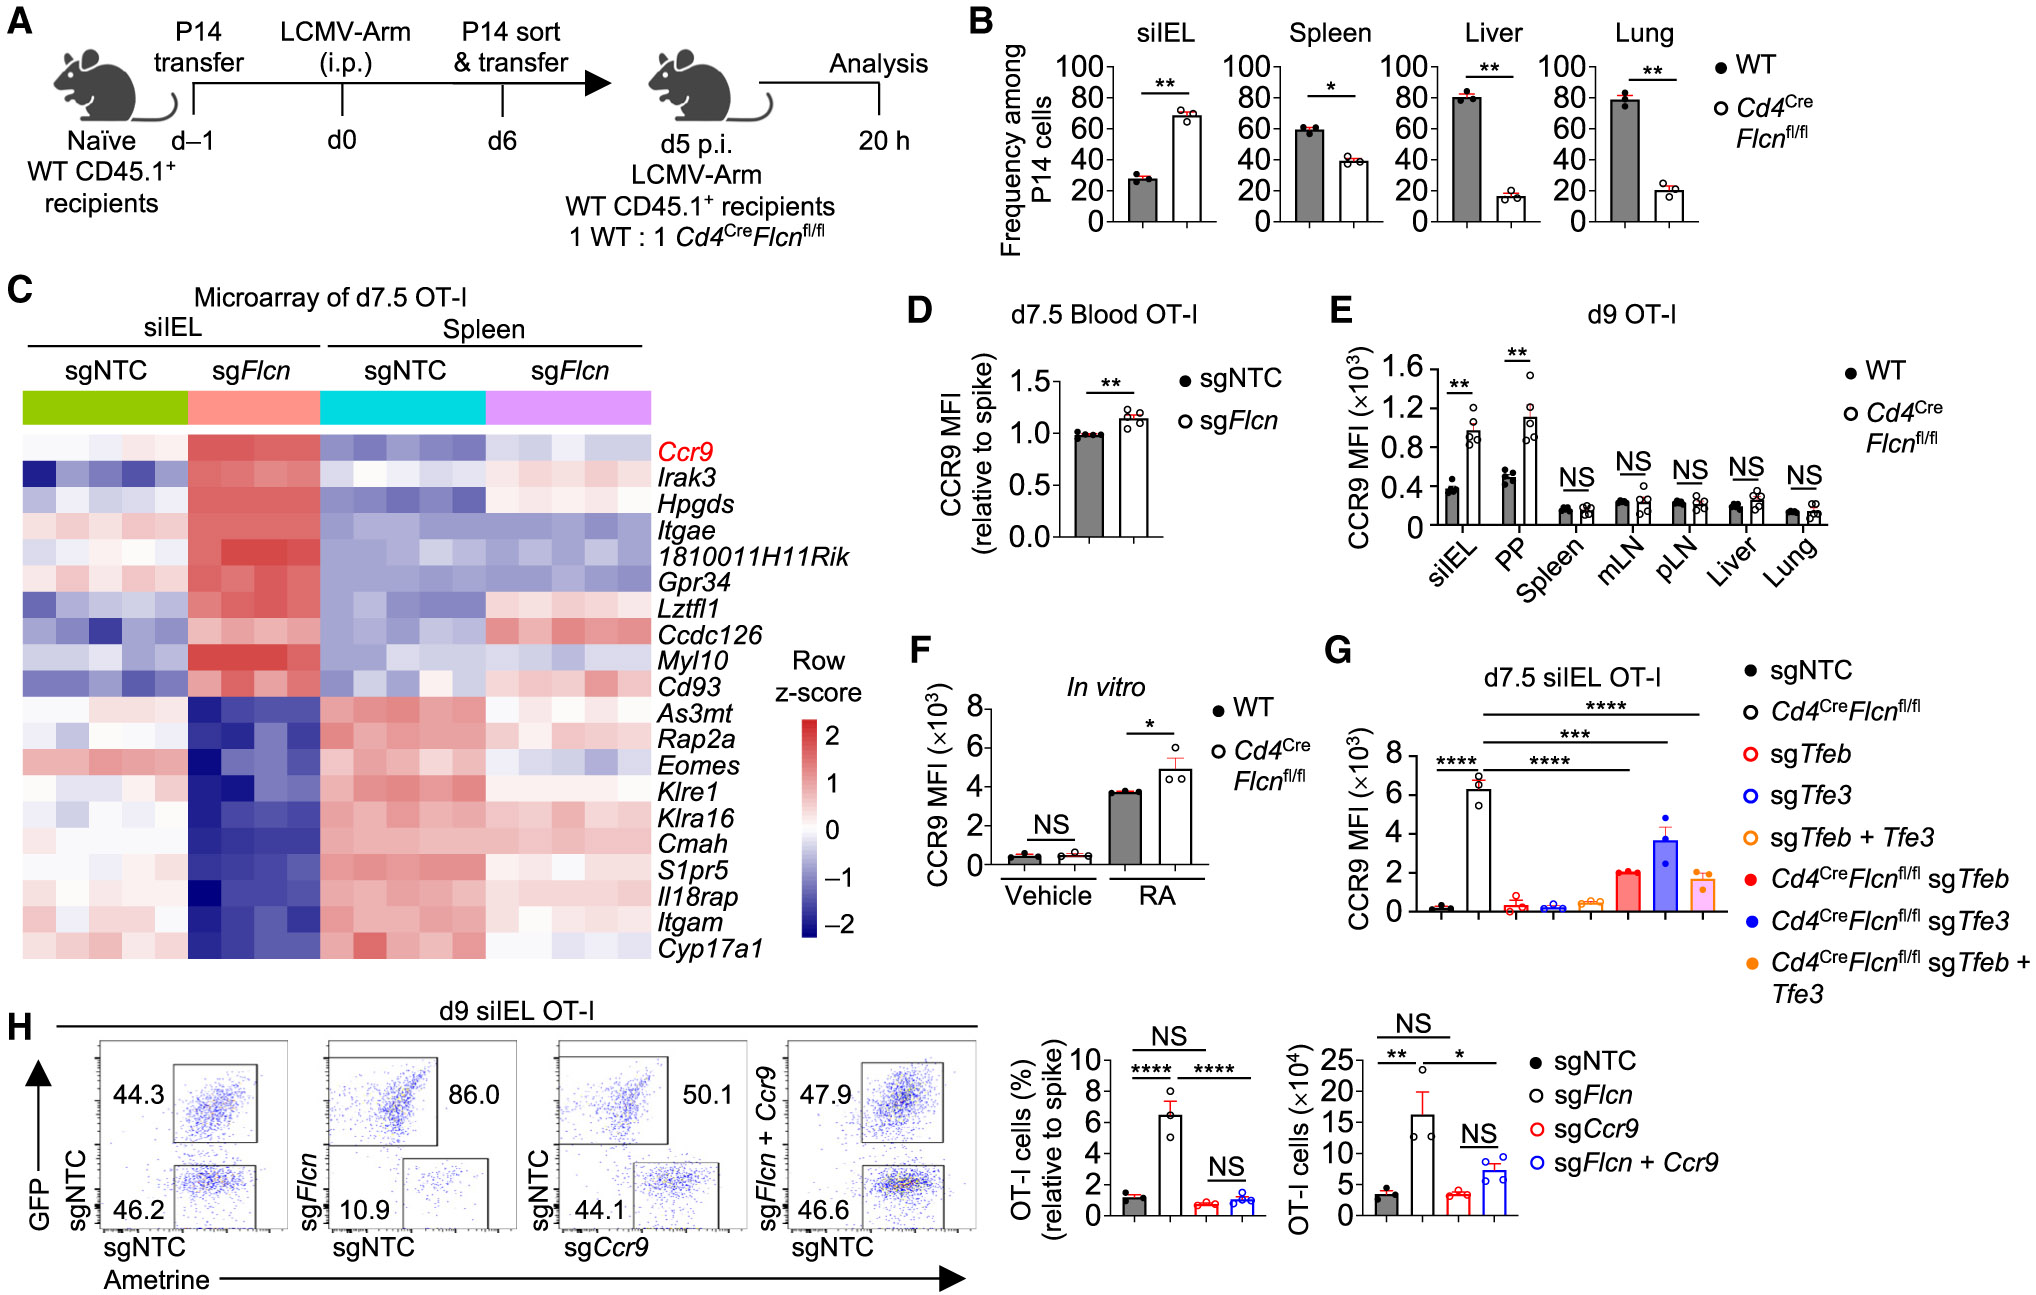
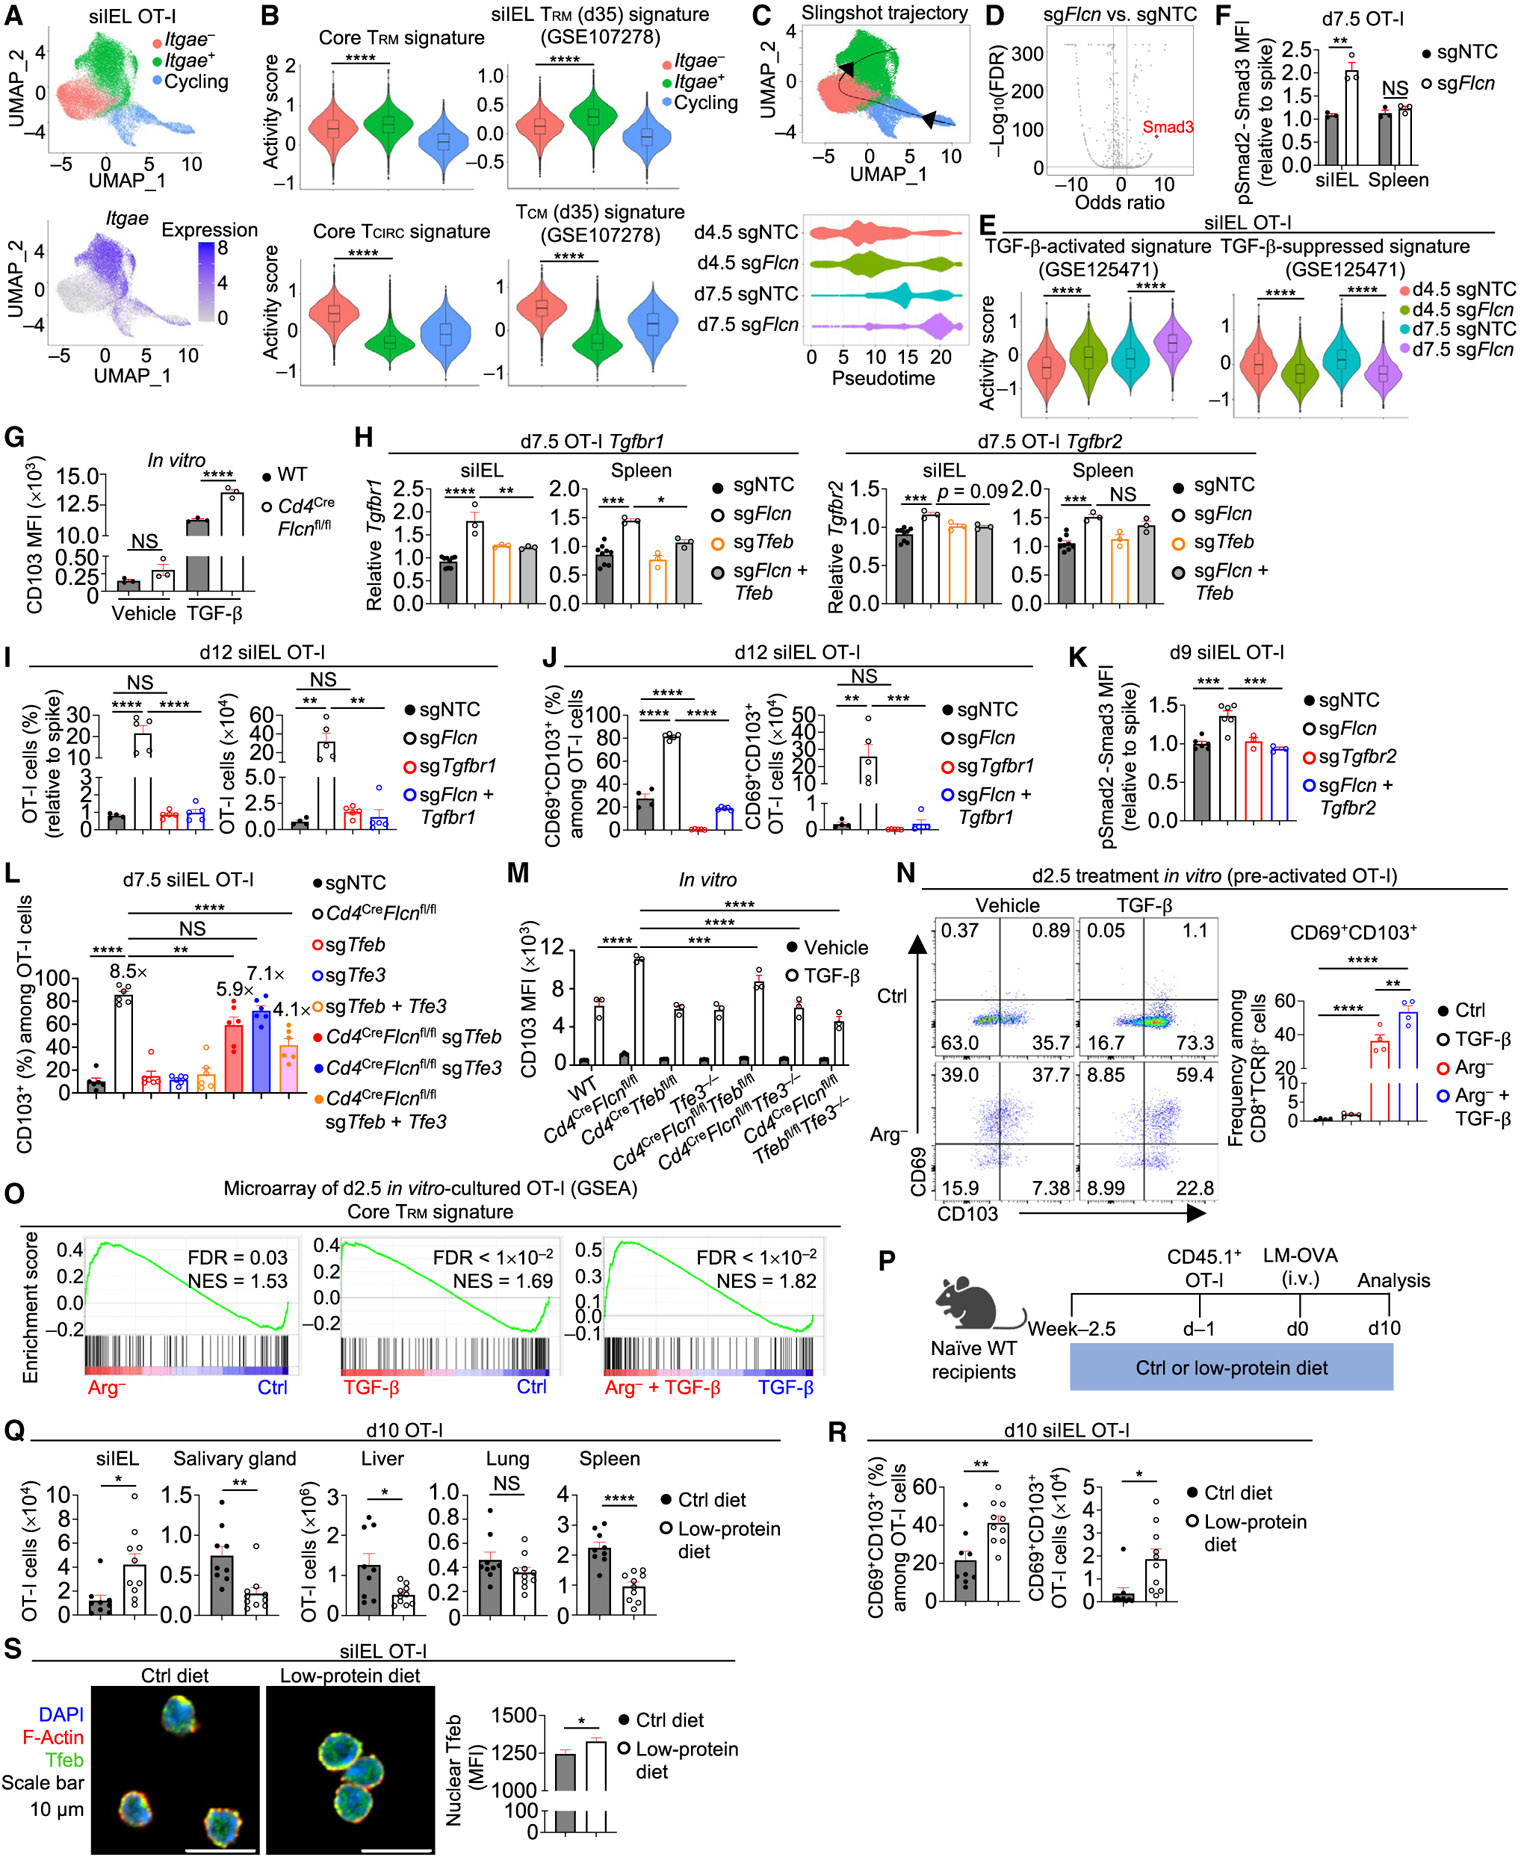
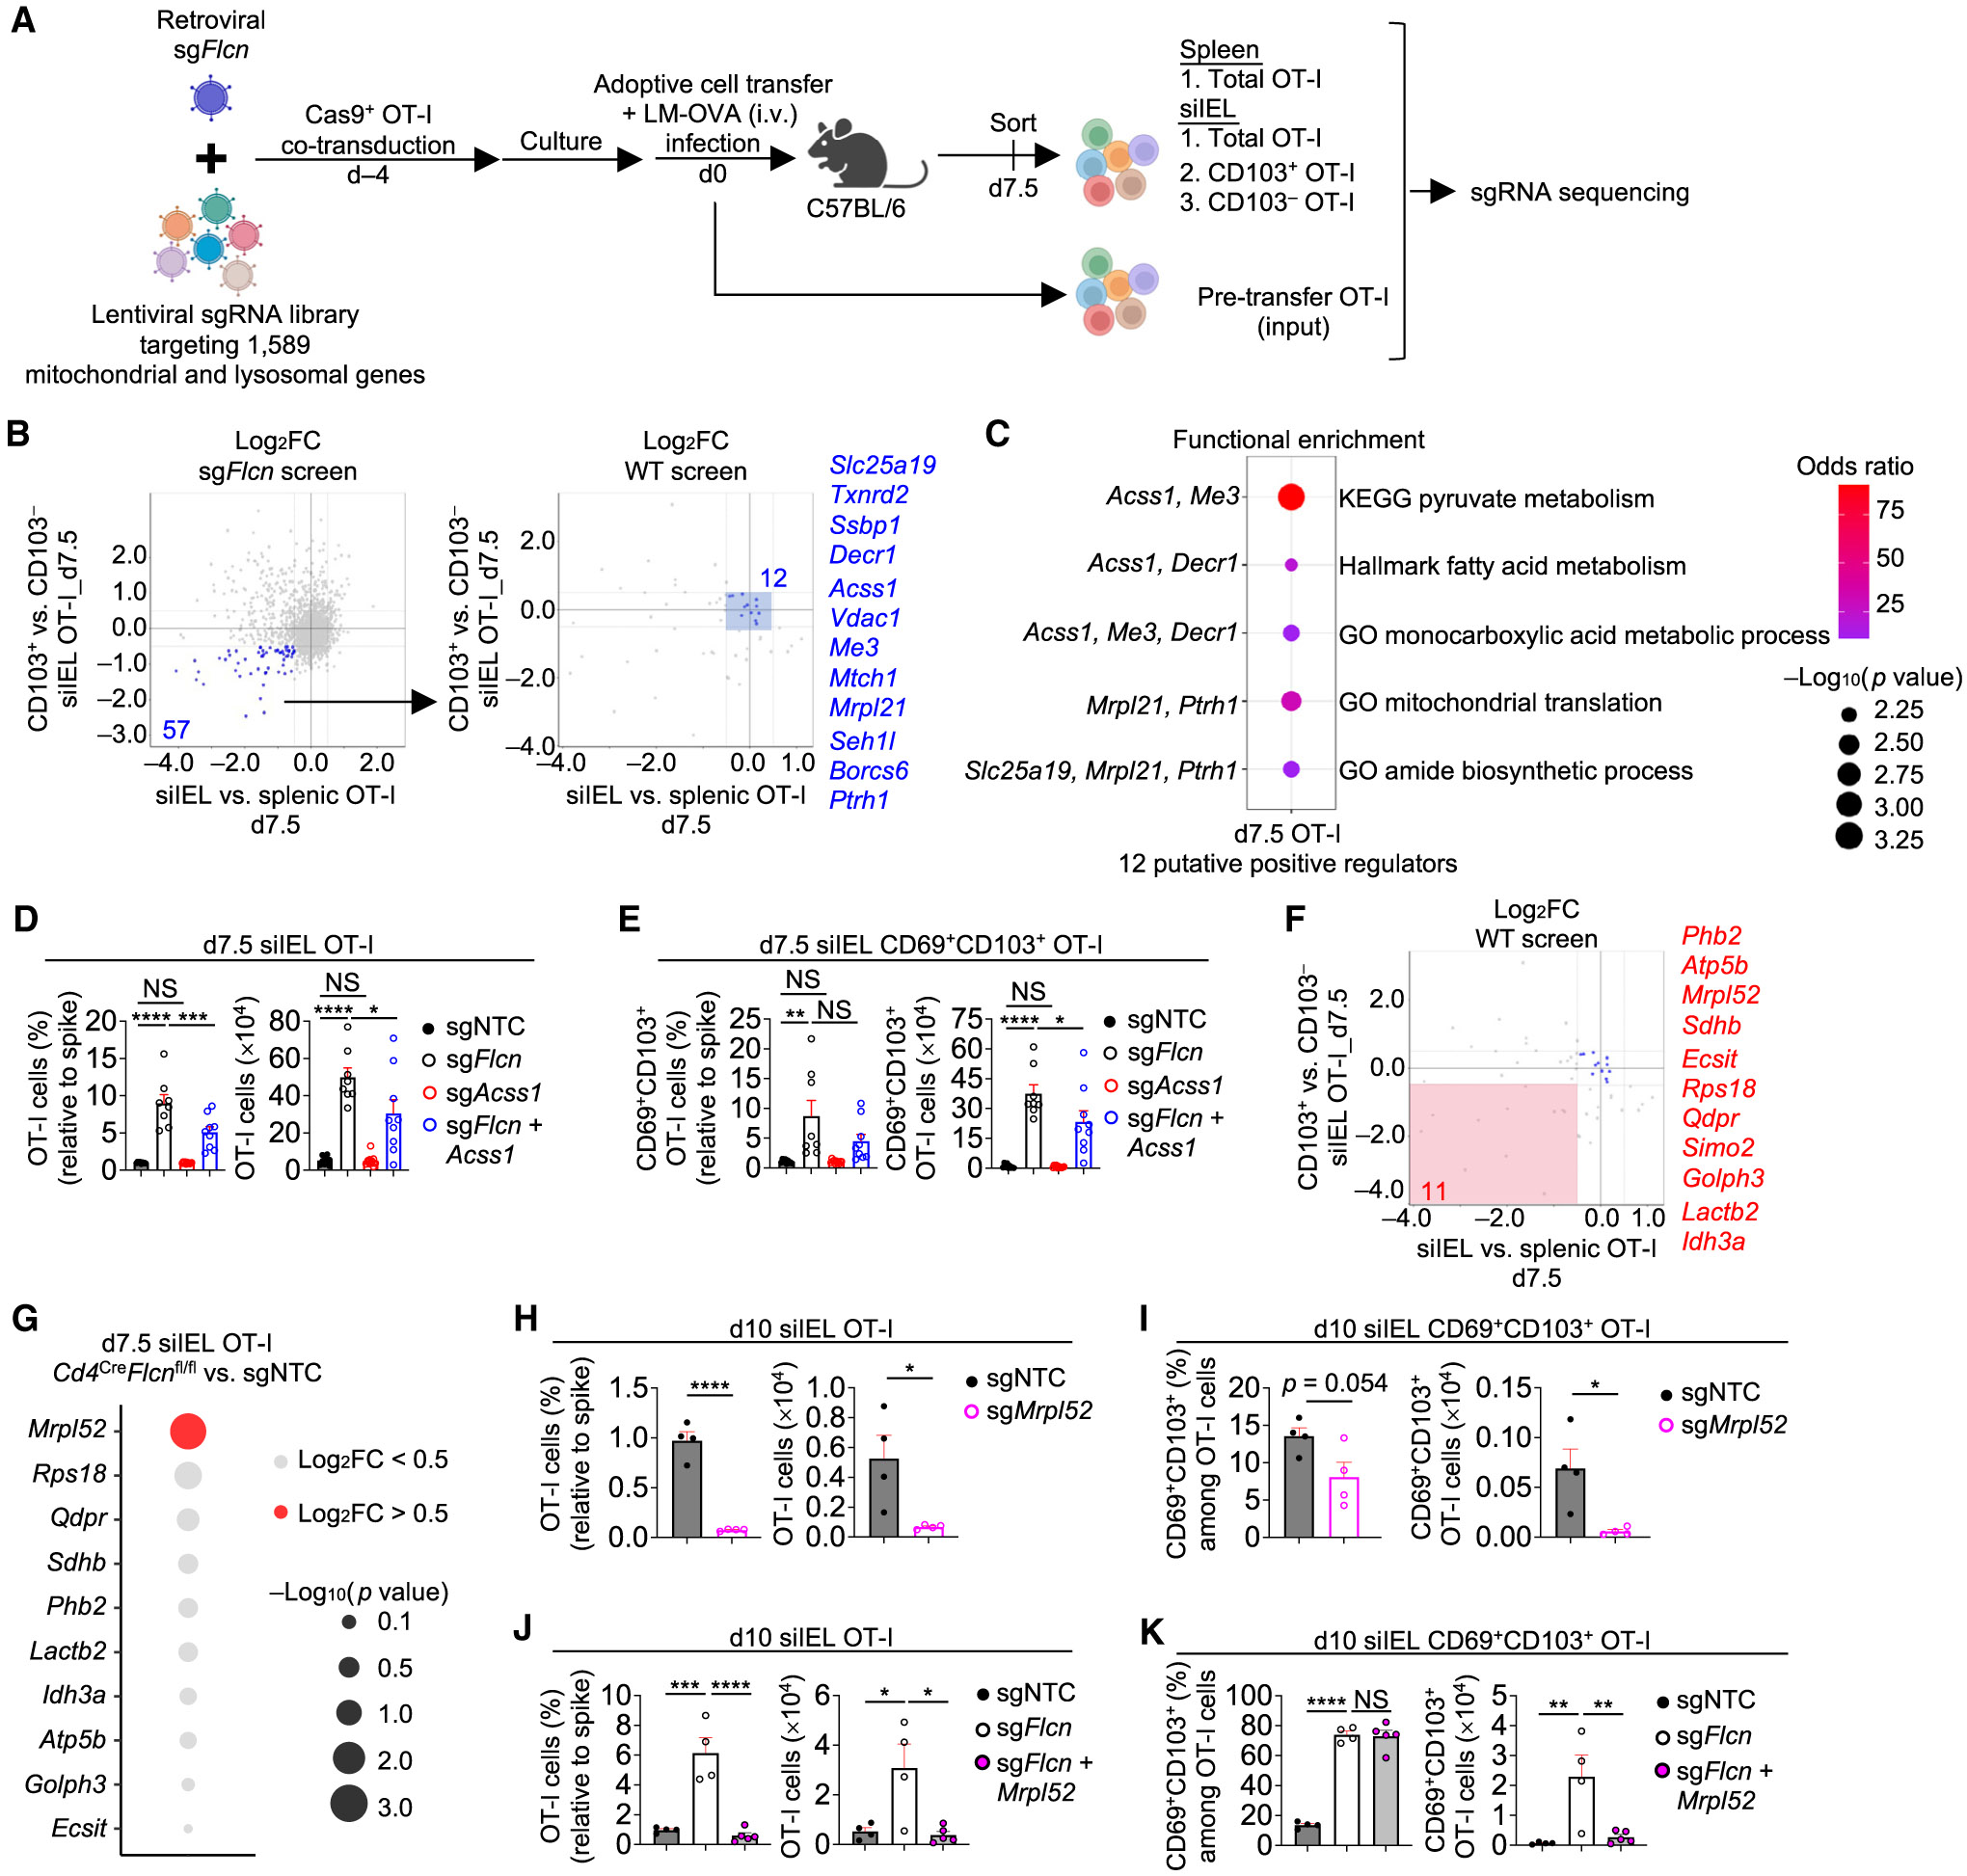
Nutrient availability and organelle biology direct tissue homeostasis and cell fate, but how these processes orchestrate tissue immunity remains poorly defined. Here, using in vivo CRISPR-Cas9 screens, we uncovered organelle signaling and metabolic processes shaping CD8+ tissue-resident memory T (TRM) cell development. TRM cells depended on mitochondrial translation and respiration. Conversely, three nutrient-dependent lysosomal signaling nodes-Flcn, Ragulator, and Rag GTPases-inhibited intestinal TRM cell formation. Depleting these molecules or amino acids activated the transcription factor Tfeb, thereby linking nutrient stress to TRM programming. Further, Flcn deficiency promoted protective TRM cell responses in the small intestine. Mechanistically, the Flcn-Tfeb axis restrained retinoic acid-induced CCR9 expression for migration and transforming growth factor β (TGF-β)-mediated programming for lineage differentiation. Genetic interaction screening revealed that the mitochondrial protein Mrpl52 enabled early TRM cell formation, while Acss1 controlled TRM cell development under Flcn deficiency-associated lysosomal dysregulation. Thus, the interplay between nutrients, organelle signaling, and metabolic adaptation dictates tissue immunity.

Keywords: CD8 T cell; adaptive immunity; dietary intervention; immunometabolism; lysosome; mitochondria; tissue-resident memory.


Conflict of interest statement

Declaration of interests H.C. consults or consulted for Kumquat Biosciences, Inc.; TCura Bioscience; Chugai Pharmaceuticals; and ONO Pharmaceutical Co and is a co-inventor on patents/patent applications in the fields of immunotherapy. A.W.G. serves on the scientific advisory boards of ArsenalBio and Foundery Innovations.

Figures

Figure 1.
Figure 1.. Lysosome-associated signaling nodes negatively regulate TRM development
(A) Schematic for in vivo CRISPR screen. Day (d) in all figures. (B) Indicated pairwise comparisons of sgRNA abundance between splenic and siIEL OT-I cells identified candidate genes with perturbation effects in at least one of the four comparisons, followed by hierarchical clustering into four gene clusters. (C) Functional enrichment analysis of cluster (C)1, C2, C3, and C4 genes identified in (B). (D) PPI networks of encoding C1 and C4 genes. Red dotted lines indicate known protein complexes. (E–G) OT-I cells transduced with sgRNAs targeting the indicated genes (Ametrine+ or GFP+) were co-transferred at a 1:1 ratio with OT-I cells transduced with sgNTC (‘‘spike’’; Ametrine+ or GFP+) into WT mice, followed by LM-OVA infection (dual-color transfer system). Flow cytometry analysis (E) and frequencies (relative to spike) and numbers of total (F) or CD69+CD103+ OT-I cells (G) in siIEL at day 21 p.i. (n ≥ 3 per group). Fold-change relative to sgNTC is indicated in (F). Fisher’s exact test (C), two-tailed unpaired Student’s t test (F and G). *p < 0.05, **p < 0.01, ***p < 0.001, ****p < 0.0001. Data (mean ± SEM) represent two experiments (F and G). See also Figure S1.
Figure 2.
Figure 2.. Targeting Flcn promotes functional TRM cell accumulation in small intestine
(A) Frequencies among sgRNA-transduced OT-I cells in indicated tissues at day >60 p.i. (n = 5 per group). Fold-change relative to sgNTC is indicated. (B and C) Violin plots showing activity scores of Flcn-suppressed and Flcn-activated signatures (see STAR Methods) in public scRNA-seq datasets of mouse (B) or healthy human (C) CD8+ T cells from indicated tissues. Asterisks indicate statistical significance in siIEL versus each tissue in (B). PBMCs, peripheral blood mononuclear cells; SG, salivary gland. (D) Frequency and number of CD69+CD103+ OT-I cells transduced with indicated sgRNAs in siIEL at day >40 p.i. (n = 4 per group). (E) Frequencies of CD8α-i.v.+ and CD8α-i.v. among indicated sgRNA-transduced OT-I cells in siIEL or spleen at day >40 p.i. (n = 4 per group). (F) Frequencies and numbers of TNF-α+IFN-γ+ OT-I cells transduced with indicated sgRNAs in siIEL or spleen at day >40 p.i. (n ≥ 4 per group). (G–I) Schematic for Yptb recall response (G). Total or CD69+CD103+ YopE-I cells in siIEL (H) and bacterial burden in spleen (I) on day 3 after secondary infection (n ≥ 6 per group). Colony-forming units (CFUs). Two-tailed paired Student’s t test (A and D–F), two-tailed unpaired Student’s t test (H), two-tailed Mann-Whitney test (I), Wilcoxon rank sum test (B and C). NS, not significant; *p < 0.05, **p < 0.01, ***p < 0.001, ****p < 0.0001. Data (mean ± SEM) are compiled from ≥2 (A, H, and I) or represent ≥3 (D–F) experiments. See also Figure S2.
Figure 3.
Figure 3.. Flcn, Ragulator, and Rag GTPase deficiencies or amino acid starvation activates Tfeb to promote siIEL TRM development
(A) sgNTC (Ametrine+)- and sgFIcn (GFP+)-transduced OT-I cells from indicated tissues of same host mice were profiled by ATAC-seq at day 7.5 p.i. Footprinting analysis in sgFIcn- versus sgNTC-transduced OT-I cells is shown. (B) Indicated sgRNA-transduced OT-I cells in siIEL at day 7.5 p.i. were profiled for transcriptome analysis. GSEA enrichment plot of Tfeb putative target genes comparing sgFIcn- versus sgNTC-transduced OT-I cells. FDR, false discovery rate; NES, normalized enrichment score. (C) Intracellular LAMP-1 expression (relative to spike; based on mean fluorescence intensity [MFI]) of indicated sgRNA-transduced OT-I cells in siIEL at days 4.5–5.5 p.i. (n ≥ 4 per group) (from dual-color transfer system). (D) GSEA enrichment plots of Tfeb-activated signature (see STAR Methods) in indicated sgRNA-transduced versus sgNTC-transduced spike siIEL OT-I cells that were profiled for transcriptome analysis at day 7.5 p.i. (from dual-color transfer system). (E) Nuclear Tfeb levels (based on MFI) in indicated sgRNA-transduced OT-I cells from siIEL or spleen at day 7.5 p.i. (from dual-color transfer system) (n > 140 cells per group). (F) Confocal imaging analysis of nuclear Tfeb levels (based on MFI) in pre-activated OT-I cells cultured in control RPMI medium (Ctrl) or RPMI medium lacking all amino acids (aa) for 20 h (see STAR Methods) (n > 160 cells per group). (G) Intracellular LAMP-1 expression (relative to cells in Ctrl medium; based on MFI) in pre-activated OT-I cells cultured in RPMI medium lacking indicated amino acids for 2.5 days, with fold-change (if >1.5) relative to Ctrl medium indicated (n = 3 technical replicates per group). (H) Intracellular LAMP-1 expression (relative to WT cells in Ctrl medium; based on MFI) in pre-activated WT or Cd4CreTfebfl/fl CD8+ T cells cultured in Ctrl and arginine-free (Arg) or glutamine-free (Gln) RPMI medium for 2.5 days (n = 3 technical replicates per group). (I) Frequencies of CD69+CD103+ pMIG (mCherry+) and pMIG-Tfeb (GFP+)-transduced OT-I cells in siIEL at day 14 p.i. (from dual-color transfer system) (n = 4 per group). (J and K) Frequencies (relative to spike) of total (J) or CD69+CD103+ siIEL OT-I cells (K) transduced with indicated sgRNAs at days 7.5 or 11 p.i. (from dual-color transfer system) (n ≥ 3 per group). One-way ANOVA (C, J, and K), two-tailed paired Student’s t test (E and I), two-tailed unpaired Student’s t test (F), two-way ANOVA (H). NS, not significant; *p < 0.05, **p < 0.01, ***p < 0.001, ****p < 0.0001. Data (mean ± SEM) are compiled from or represent ≥2 experiments (C and E–K). See also Figure S3.
Figure 4.
Figure 4.. Flcn deficiency enhances CCR9 expression and CD8+ T cell trafficking to small intestine
(A and B) Schematic for CD8+ T cell migration assay (A). Frequencies among transferred P14 cells in indicated tissues (B) (n = 3 per group). (C) Transcriptome profiling of indicated sgRNA-transduced OT-I cells in siIEL or spleen at day 7.5 p.i. (from dual-color transfer system). Heatmap depicts the top 10 increased (log2FC > 0.5, FDR < 0.05; ranked by log2FC) and decreased (log2FC < −0.5, FDR < 0.05; ranked by log2FC) genes in sgFIcn- versus sgNTC- transduced siIEL OT-I cells. (D) CCR9 expression (relative to spike; based on MFI) on indicated sgRNA-transduced OT-I cells in the blood at day 7.5 p.i. (from dual-color transfer system) (n = 5 per group). (E) Naive WT and Flcn-deficient (from Cd4CreFlcnfl/fl mice) OT-I cells were sort-purified and co-transferred into WT mice at a 1:1 ratio, followed by LM-OVA infection 1 day later. Quantification of CCR9 expression (based on MFI) on OT-I cells from the indicated tissues at day 9 p.i. (n = 5 per group). (F) CCR9 expression (based on MFI) on WT and Flcn-deficient (from Cd4CreFlcnfl/fl mice) CD8+ T cells cultured with retinoic acid (or vehicle) for 5 days (see STAR Methods) (n = 3 technical replicates per group). (G) WT (from Flcnfl/flCas9+ mice) or Flcn-deficient (from Cd4CreFlcnfl/flCas9+ mice) OT-I cells were transduced or co-transduced with indicated sgRNAs. Quantification of CCR9 expression (based on MFI) on siIEL OT-I cells at day 7.5 p.i. is shown (n = 3 per group). (H) Frequency (relative to spike) and number of indicated sgRNA-transduced OT-I cells in siIEL at day 9 p.i. (from dual-color transfer system) (n ≥ 3 per group). Two-tailed paired Student’s t test (B and E), two-tailed unpaired Student’s t test (D), two-way ANOVA (F), one-way ANOVA (G and H). NS, not significant; *p < 0.05, **p < 0.01, ****p < 0.0001. Data (mean ± SEM) represent ≥2 (B, D, E, G, and H) or three (F) experiments. See also Figure S4.
Figure 5.
Figure 5.. Flcn limits TGF-β signaling to control TRM programming
(A) sgNTC (Ametrine+)- and sgFlcn (GFP+)-transduced OT-I cells from siIEL of the same host were profiled by scRNA-seq at days 4.5 and 7.5 p.i. (n = 2 per group; pooled from 2 mice). UMAP plots depicting three clusters (cycling, Itgae, and Itgae+) and Itgae expression. (B) Violin plots showing activity scores of core TRM signature, core TCIRC signature, curated siIEL TRM signature, and curated TCM signature (see STAR Methods) among indicated 3 clusters. (C) UMAP plot showing Slingshot trajectory analysis and pseudotime plot of indicated sgRNA-transduced siIEL OT-I cells at days 4.5 and 7.5 p.i. (D) Plot depicting transcription factor motif enrichment analysis (including Smad3) comparing sgFlcn- versus sgNTC-transduced siIEL OT-I cells that were profiled by ATAC-seq at day 7.5 p.i. (E) Violin plots showing activity scores of TGF-β-activated and TGF-β-suppressed signatures (see STAR Methods) in indicated sgRNA-transduced siIEL OT-I cells from scRNA-seq profiling in (A). (F) pSmad2-Smad3 levels (relative to spike; based on MFI) in indicated sgRNA-transduced OT-I cells from siIEL or spleen on day 7.5 p.i. (n = 3 per group). (G) CD103 expression (based on MFI) on WT or Flcn-deficient (from Cd4CreFlcnfl/fl mice) CD8+ T cells cultured with rhTGF-β1 (or vehicle) for 5 days (see STAR Methods) (n = 3 technical replicates per group). (H) Real-time PCR analysis of Tgfbr1 and Tgfbr2 expression in indicated sgRNA-transduced OT-I cells from siIEL or spleen at day 7.5 p.i. (n ≥ 3 per group). (I and J) Frequencies (relative to spike) and numbers of total (I) or CD69+CD103+ siIEL OT-I cells (J) transduced with indicated sgRNAs at day 12 p.i. (from dual-color transfer system) (n ≥ 4 per group). (K) pSmad2-Smad3 levels (relative to spike; based on MFI) in indicated sgRNA-transduced OT-I cells from siIEL at day 9 p.i. (from dual-color transfer system) (n ≥ 3 per group). (L) WT (from Flcnfl/flCas9+ mice) or Flcn-deficient (from Cd4CreFlcnfl/flCas9+ mice) OT-I cells that were transduced or co-transduced with indicated sgRNAs. Frequency of CD103+ siIEL OT-I cells at day 7.5 p.i. is shown. Fold-change relative to sgNTC is indicated (n = 6 per group). (M) CD103 expression (based on MFI) on CD8+ T cells cultured with rhTGF-β1 (or vehicle) for 5 days (see STAR Methods) (n = 3 technical replicates per group). (N) Pre-activated OT-I cells were transferred into Ctrl RPMI medium or Arg RPMI medium containing rhTGF-β1 (or vehicle) for 2.5 days (see STAR Methods). Frequency of CD69+CD103+ OT-I cells is shown (n = 4 technical replicates per group). (O) GSEA enrichment plots showing the core TRM signature in cells cultured in Arg versus Ctrl medium, cells cultured in Ctrl medium plus rhTGF-β1 versus Ctrl medium, or cells cultured in Arg medium plus rhTGF-β1 versus Ctrl medium plus rhTGF-β1 (as in N). (P–R) Schematic for LM-OVA infection in mice fed control or low-protein diet (P). OT-I cell numbers in indicated tissues (Q) or frequency and number of CD69+CD103+ siIEL OT-I cells (R) at day 10 p.i. (n = 9–10 per group). (S) Nuclear Tfeb MFI in siIEL OT-I cells from mice fed indicated diets (n > 30 cells per group). Wilcoxon rank sum test (B and E), two-tailed unpaired Student’s t test (F and Q–S), one-way ANOVA (H–L and N), two-way ANOVA (G and M). NS, not significant; *p < 0.05, **p < 0.01, ***p < 0.001, ****p < 0.0001. Data (mean ± SEM) are compiled from two (K, L, Q, and R) or represent ≥2 (F), one (H–J and S), or three (G, M, and N) experiments. See also Figure S5.
Figure 6.
Figure 6.. Mitochondria- and lysosome-scale genetic interactions for TRM development
(A) Schematic for in vivo genetic interaction CRISPR screen in sgFlcn-transduced Cas9-expressing OT-I cells. (B) Sectored scatterplots of gene-level log2FC from CRISPR screens using sgFlcn-transduced OT-I cells (described in A) or WT (Flcn-sufficient) OT-I cells (described in Figure 1A). 12 of 57 genes were nominated as positive regulators of Flcn-deficient total and CD103+ siIEL OT-I cell accumulation without effects on WT OT-I cells (see STAR Methods). (C) Functional enrichment analysis of the 12 genes defined in (B). (D and E) Frequencies (relative to spike) and numbers of total (D) or CD69+CD103+ (E) siIEL OT-I cells transduced with indicated sgRNAs at day 7.5 p.i. (from dual-color transfer system) (n ≥ 8 per group). (F) Sectored scatterplot of gene-level log2FC in WTOT-I cells from the CRISPR screen as described in (B). 11 of 57 genes were nominated as positive regulators of both Flcn-deficient and WT total and CD103+ siIEL OT-I cell accumulation (see STAR Methods). (G) Bubble plot depicting log2FCs and p values of the 11 genes from (F), comparing Flcn-deficient versus sgNTC-transduced siIEL OT-I cells that were profiled for transcriptome analysis at day 7.5 p.i. (see also Figure S3J). (H–K) Frequencies (relative to spike) and numbers of total (H and J) or CD69+CD103+ (I and K) siIEL OT-I cells transduced with indicated sgRNAs at day 10 p.i. (from dual-color transfer system) (n ≥ 4 per group). Fisher’s exact test (C), one-way ANOVA (D, E, J, and K), or two-tailed unpaired Student’s t test (H and I). NS, not significant; *p < 0.05, **p < 0.01, ***p < 0.001, ****p < 0.0001. Data (mean ± SEM) are compiled from two (D and E) or represent two (H–K) experiments. See also Figure S6.

Comment in

References

    1. Chi H, Pepper M, and Thomas PG (2024). Principles and therapeutic applications of adaptive immunity. Cell 187, 2052–2078. 10.1016/j.cell.2024.03.037. - DOI - PMC - PubMed
    1. Sasson SC, Gordon CL, Christo SN, Klenerman P, and Mackay LK (2020). Local heroes or villains: tissue-resident memory T cells in human health and disease. Cell. Mol. Immunol 17, 113–122. 10.1038/s41423-019-0359-1. - DOI - PMC - PubMed
    1. Jameson SC, and Masopust D (2018). Understanding Subset Diversity in T Cell Memory. Immunity 48, 214–226. 10.1016/j.immuni.2018.02.010. - DOI - PMC - PubMed
    1. Masopust D, and Soerens AG (2019). Tissue-Resident T Cells and Other Resident Leukocytes. Annu. Rev. Immunol 37, 521–546. 10.1146/annurev-immunol-042617-053214. - DOI - PMC - PubMed
    1. Okła K, Farber DL, and Zou W (2021). Tissue-resident memory T cells in tumor immunity and immunotherapy. J. Exp. Med 218, e20201605. 10.1084/jem.20201605. - DOI - PMC - PubMed

Publication types

MeSH terms

Substances