. 2024 Oct 29;34(10):1661-1673.
doi: 10.1101/gr.279449.124.

Seamless, rapid, and accurate analyses of outbreak genomic data using split k-mer analysis

Affiliations

Seamless, rapid, and accurate analyses of outbreak genomic data using split k-mer analysis

Romain Derelle et al. Genome Res. .

Abstract

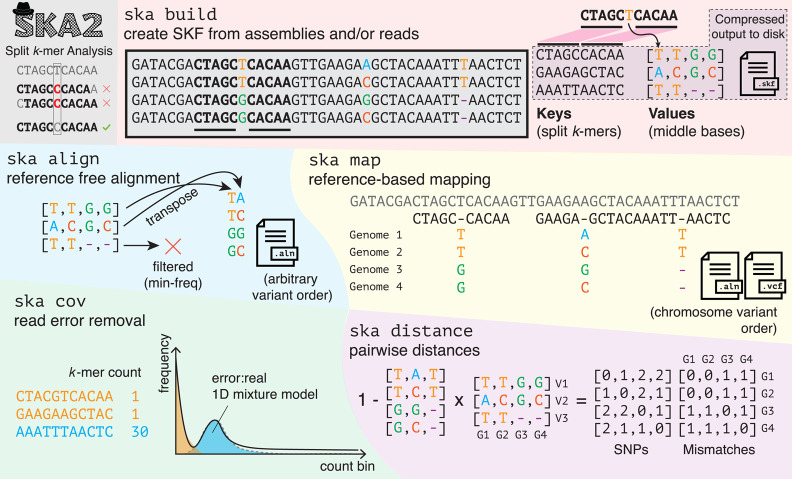
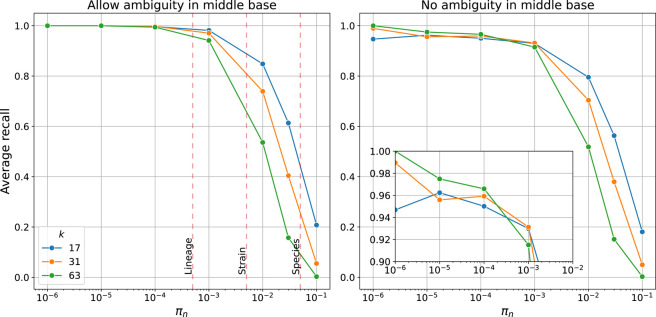
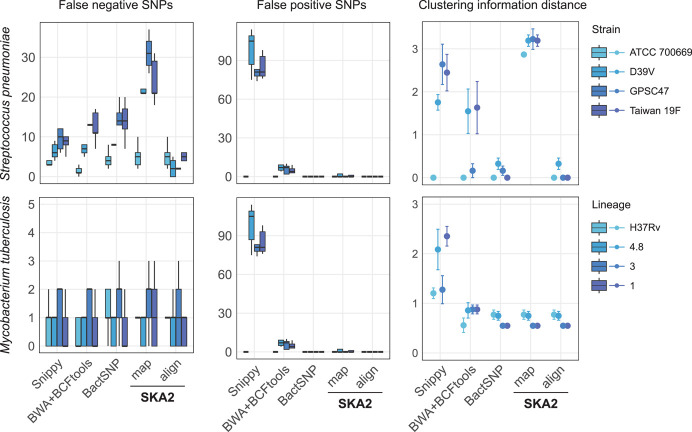
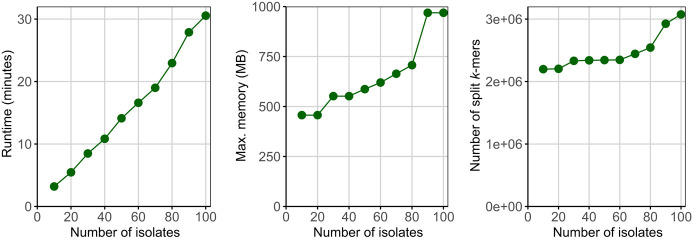
Sequence variation observed in populations of pathogens can be used for important public health and evolutionary genomic analyses, especially outbreak analysis and transmission reconstruction. Identifying this variation is typically achieved by aligning sequence reads to a reference genome, but this approach is susceptible to reference biases and requires careful filtering of called genotypes. There is a need for tools that can process this growing volume of bacterial genome data, providing rapid results, but that remain simple so they can be used without highly trained bioinformaticians, expensive data analysis, and long-term storage and processing of large files. Here we describe split k-mer analysis (SKA2), a method that supports both reference-free and reference-based mapping to quickly and accurately genotype populations of bacteria using sequencing reads or genome assemblies. SKA2 is highly accurate for closely related samples, and in outbreak simulations, we show superior variant recall compared with reference-based methods, with no false positives. SKA2 can also accurately map variants to a reference and be used with recombination detection methods to rapidly reconstruct vertical evolutionary history. SKA2 is many times faster than comparable methods and can be used to add new genomes to an existing call set, allowing sequential use without the need to reanalyze entire collections. With an inherent absence of reference bias, high accuracy, and a robust implementation, SKA2 has the potential to become the tool of choice for genotyping bacteria. SKA2 is implemented in Rust and is freely available as open-source software.


Figures

Figure 1.
Figure 1.
Overview of functions and methods in SKA2. Split k-mers allow matching variant positions, whereas contiguous k-mers mismatch any variation. ska build creates split k-mer dictionaries from input sequence data. The example shows four sequences that are aligned and on the same strand for clarity, but in real input data, neither is necessary. Split k-mers are used as keys, and their middle bases are stored in lists. This dictionary is compressed using snappy to make split k-mer files (SKFs). ska align makes reference-free alignments with no coordinate system by writing out the middle bases, applying filters on the frequency of missing data, constant sites, and ambiguous sites. ska map makes reference-based mappings as ALN or VCF, with the same coordinate system as the reference. In both modes, the conserved sites are also written out but are not shown for clearer visualization. ska cov counts k-mers and fits a mixture model to find a threshold for count when using reads as input to ska build. ska distance calculates SNP distances and mismatches between samples by multiplying the middle base matrix by its transpose. The cluster_dists.py script can be run on this distance matrix to make phylogeny, single-linkage clusters with a provided threshold, and a Microreact visualization. Operations to merge, delete samples and split k-mers, and write out the contents of SKFs are also implemented but are not shown.
Figure 2.
Figure 2.
Average recall of SKA2 in simulations across increasing sequence divergence between a pair of sequences (πn or SNPs per site). Lines show recall using different split k-mer lengths k. (Left) Recall when allowing ambiguous bases, showing typical divergence thresholds used to define species, strain, and lineage boundaries. (Right) Recall when requiring exact matches of the middle base, with inset showing recall over the within-lineage range.
Figure 3.
Figure 3.
Results obtained from the analyses of simulated outbreaks showing recall (false negatives), false positives, and clustering information distance from the four different tools. “map” and “align” refer to the SKA2 functions used to generate SNP alignments. References of increasing distance (darker blue) from the source of the outbreak were used to evaluate reference bias. The error bars in the CI distance plots correspond to the 95% confidence interval calculated from 10 values (two phylogenies were obtained from each SNP alignment using two independent maximum-likelihood runs). The numbers 4.8, 3, and 1 in the legend correspond to the names of M. tuberculosis lineages.
Figure 4.
Figure 4.
Empirical scaling of SKA2 computational efficiency using increasing block sizes from 100 isolates of the S. pneumoniae IC1 cluster. The numbers of split k-mers represent the total numbers of split k-mers contained across all samples.
Figure 5.
Figure 5.
Online analyses of E.coli genomes. The three different genome addition strategies mentioned in the main text are displayed from left to right. Units of the x-axes (number of genomes) are identical across the six plots, and units of the y-axes (number of SNPs and SKF sizes) are identical within plots on the same line. “k-mer-based filtering” refers to the filtering based on missing split-k-mers, and “SNP-based filtering” refers to the filtering based on presence-absence of SNPs. Points corresponding to the number of SNPs (upper panels) obtained from default SKA2 analyses and after k-mer-based filtering were jittered to avoid overlapping.

Similar articles

Cited by

References

    1. Alanko JN, Vuohtoniemi J, Mäklin T, Puglisi SJ. 2023. Themisto: a scalable colored k-mer index for sensitive pseudoalignment against hundreds of thousands of bacterial genomes. Bioinformatics 39(Supplement_1): i260–i269. 10.1093/bioinformatics/btad233 - DOI - PMC - PubMed
    1. Allard MW, Strain E, Melka D, Bunning K, Musser SM, Brown EW, Timme R. 2016. Practical value of food pathogen traceability through building a whole-genome sequencing network and database. J Clin Microbiol 54: 1975–1983. 10.1128/JCM.00081-16 - DOI - PMC - PubMed
    1. Argimón S, Abudahab K, Goater RJE, Fedosejev A, Bhai J, Glasner C, Feil EJ, Holden MTG, Yeats CA, Grundmann H, et al. 2016. Microreact: visualizing and sharing data for genomic epidemiology and phylogeography. Microb Genom 2: e000093. 10.1099/mgen.0.000093 - DOI - PMC - PubMed
    1. Becker HEF, Jamin C, Bervoets L, Boleij A, Xu P, Pierik MJ, Stassen FRM, Savelkoul PHM, Penders J, Jonkers DMAE. 2021. Higher prevalence of Bacteroides fragilis in Crohn's disease exacerbations and strain-dependent increase of epithelial resistance. Front Microbiol 12: 598232. 10.3389/fmicb.2021.598232 - DOI - PMC - PubMed
    1. Bickhart DM, Kolmogorov M, Tseng E, Portik DM, Korobeynikov A, Tolstoganov I, Uritskiy G, Liachko I, Sullivan ST, Shin SB, et al. 2022. Generating lineage-resolved, complete metagenome-assembled genomes from complex microbial communities. Nat Biotechnol 40: 711–719. 10.1038/s41587-021-01130-z - DOI - PubMed

LinkOut - more resources