. 2024 Oct 16;9(1):273.
doi: 10.1038/s41392-024-01977-z.

Cardiomyocyte-specific knockout of ADAM17 alleviates doxorubicin-induced cardiomyopathy via inhibiting TNFα-TRAF3-TAK1-MAPK axis

Affiliations

Cardiomyocyte-specific knockout of ADAM17 alleviates doxorubicin-induced cardiomyopathy via inhibiting TNFα-TRAF3-TAK1-MAPK axis

Lin Xie et al. Signal Transduct Target Ther. .

Abstract

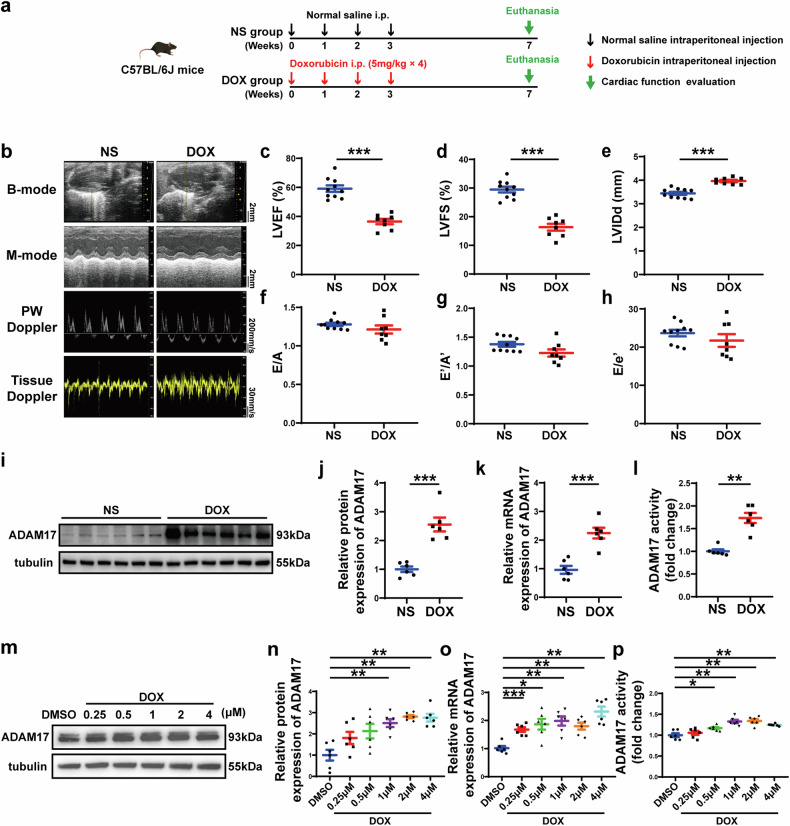
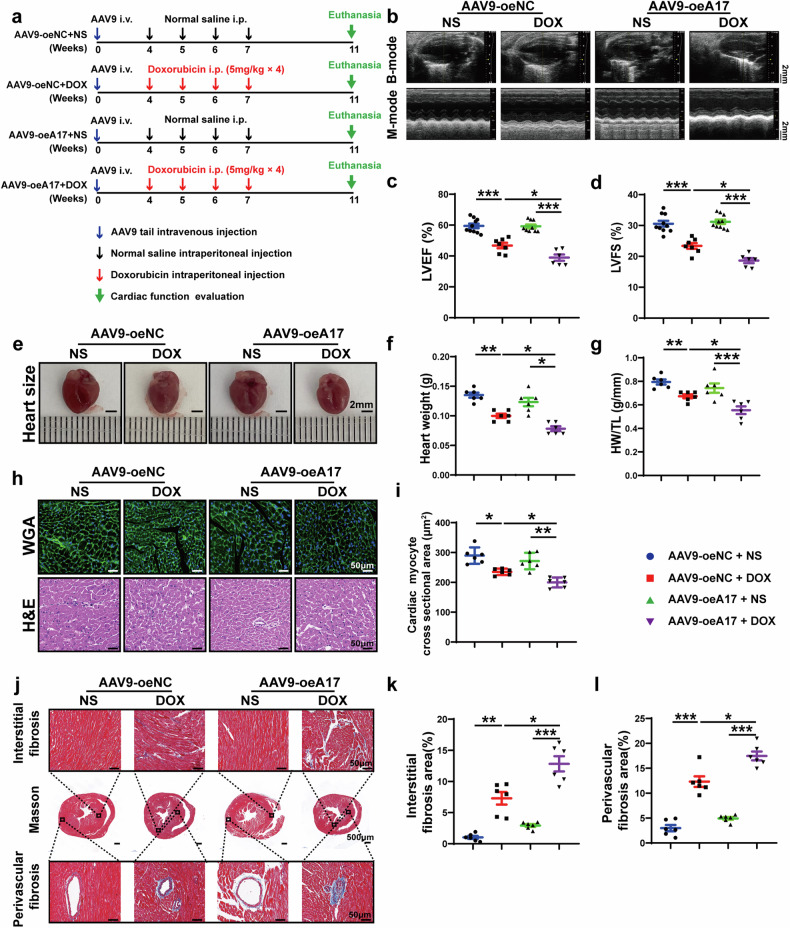
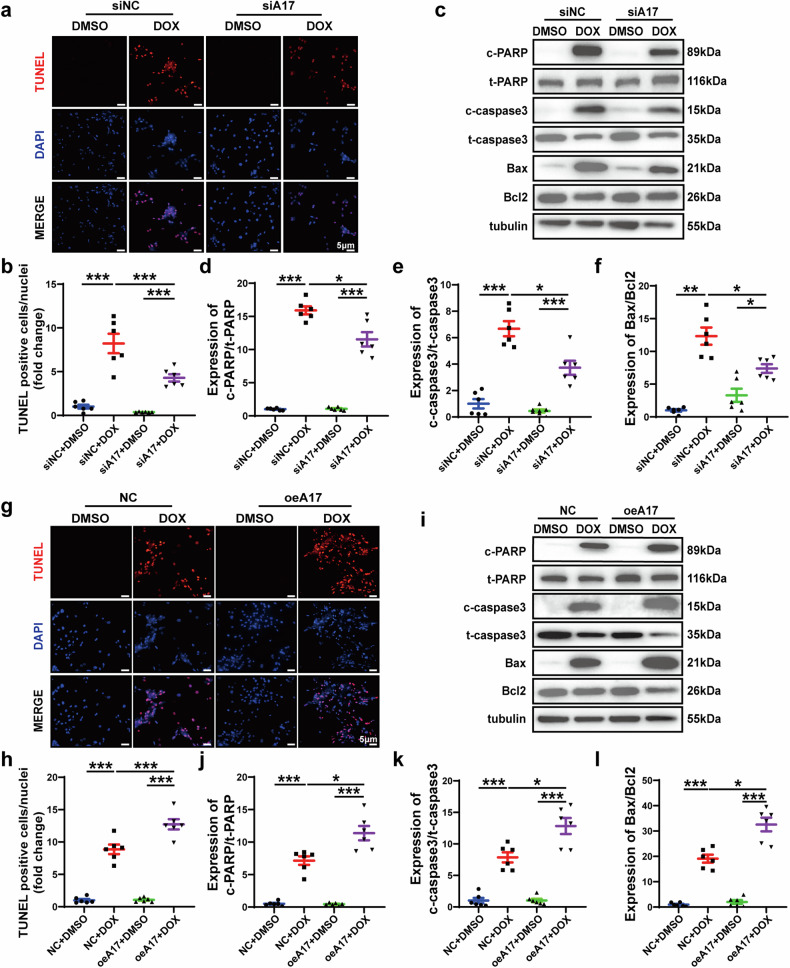
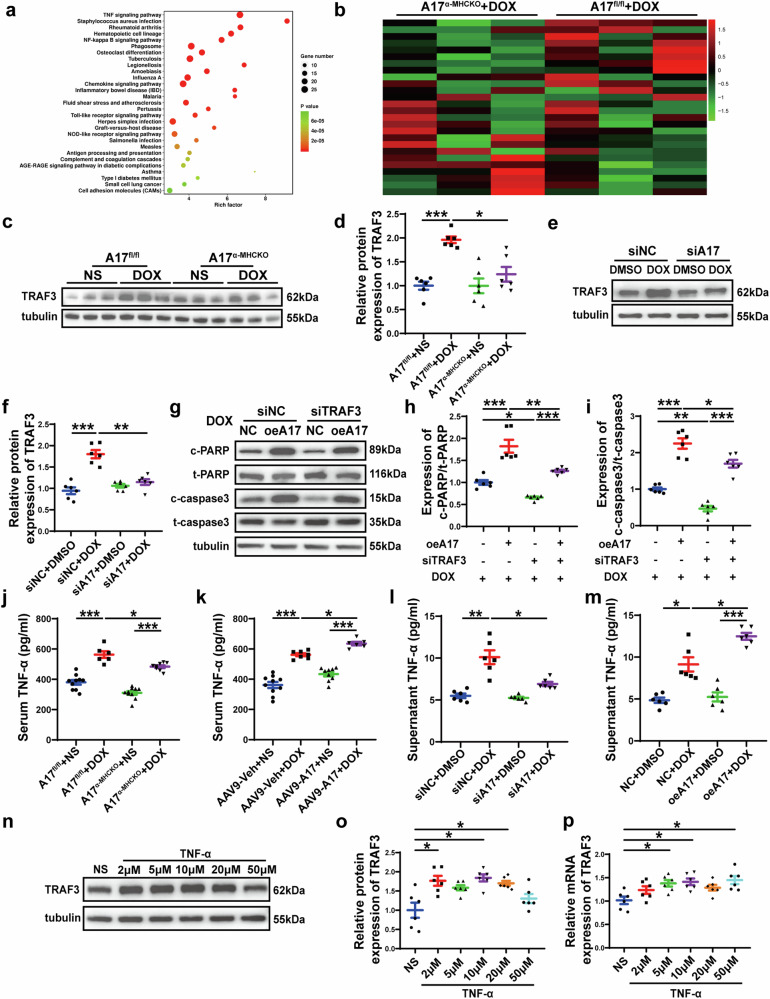
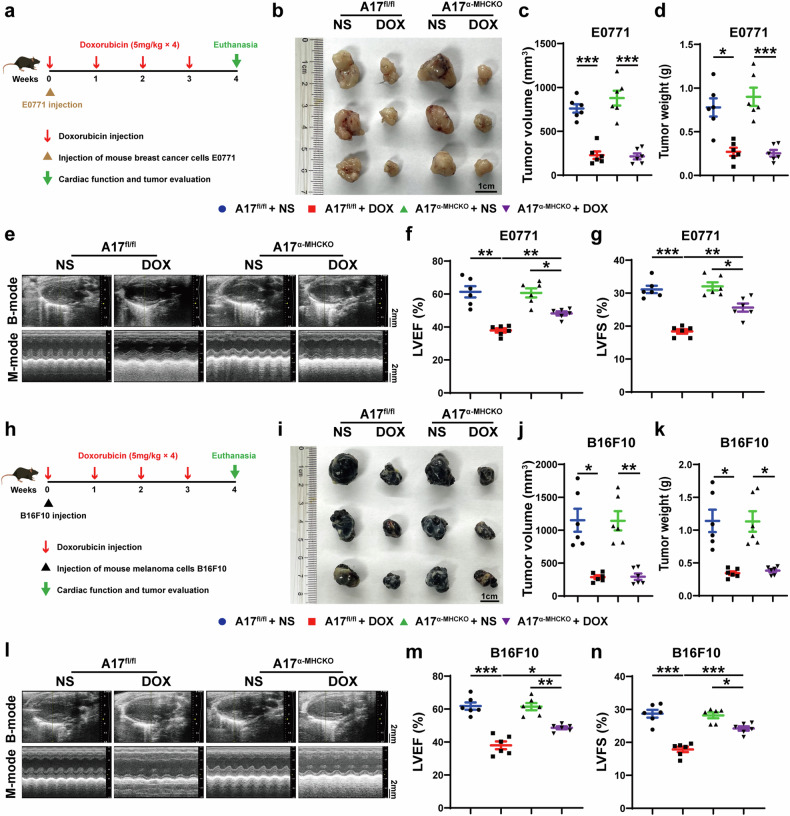
The pathogenesis of doxorubicin-induced cardiomyopathy remains unclear. This study was carried out to test our hypothesis that ADAM17 aggravates cardiomyocyte apoptosis induced by doxorubicin and inhibition of ADAM17 may ameliorate doxorubicin-induced cardiomyopathy. C57BL/6J mice were intraperitoneally injected with a cumulative dose of doxorubicin to induce cardiomyopathy. Cardiomyocyte-specific ADAM17-knockout (A17α-MHCKO) and ADAM17-overexpressing (AAV9-oeA17) mice were generated. In addition, RNA sequencing of the heart tissues in different mouse groups and in vitro experiments in neonatal rat cardiomyocytes (NRCMs) receiving different treatment were performed. Mouse tumor models were constructed in A17fl/fl and A17α-MHCKO mice. In addition, cardiomyocyte-specific TRAF3-knockdown and TRAF3-overexpressing mice were generated. ADAM17 expression and activity were markedly upregulated in doxorubicin-treated mouse hearts and NRCMs. A17α-MHCKO mice showed less cardiomyocyte apoptosis induced by doxorubicin than A17fl/fl mice, and cardiomyocyte ADAM17 deficiency did not affect the anti-tumor effect of doxorubicin. In contrast, AAV9-oeA17 mice exhibited markedly aggravated cardiomyocyte apoptosis relative to AAV9-oeNC mice after doxorubicin treatment. Mechanistically, doxorubicin enhanced the expression of transcription factor C/EBPβ, leading to increased expression and activity of ADAM17 in cardiomyocyte, which enhanced TNF-α shedding and upregulated the expression of TRAF3. Increased TRAF3 promoted TAK1 autophosphorylation, resulting in activated MAPKs pathway and cardiomyocyte apoptosis. ADAM17 acted as a positive regulator of cardiomyocyte apoptosis and cardiac remodeling and dysfunction induced by doxorubicin by upregulating TRAF3/TAK1/MAPKs signaling. Thus, targeting ADAM17/TRAF3/TAK1/MAPKs signaling holds a promising potential for treating doxorubicin-induced cardiotoxicity.


Conflict of interest statement

The authors declare no competing interests.

Figures

Fig. 1
Fig. 1
Echocardiographic measurements and ADAM17 protein expression in mice receiving different treatment. a Experiment timeline in vivo. b Representative echocardiographic images in mice showing B-mode echocardiogram (scale bar = 2 mm), M-mode echocardiogram (scale bar = 2 mm), pulse-wave Doppler tracing (PW) (scale bar = 200 mm/s), and tissue Doppler tracing (scale bar = 30 mm/s). c Comparison of left ventricular ejection fraction (LVEF) between mice treated with normal saline (NS) and doxorubicin (DOX) (n = 8–10 in each group). d Comparison of left ventricular fractional shortening (LVFS) between mice treated with normal saline (NS) and doxorubicin (DOX) (n = 8–10 in each group). e Comparison of left ventricular end-diastolic diameter (LVIDd) between mice treated with normal saline (NS) and doxorubicin (DOX) (n = 8–10 in each group). f Comparison of the ratio of early to late diastolic mitral flow velocities (E/A) between mice treated with normal saline (NS) and doxorubicin (DOX) (n = 8–10 in each group). g Comparison of the ratio of early to late diastolic mitral annular velocities (E′/A′) between mice treated with normal saline (NS) and doxorubicin (DOX) (n = 8–10 in each group). h Comparison of the ratio of early diastolic mitral flow to early diastolic mitral annulus velocity (E/E′) between mice treated with normal saline (NS) and doxorubicin (DOX) (n = 8–10 in each group). i Representative western blot images of ADAM17 protein expression in the myocardium of NS- and DOX-treated mice. j Comparison of ADAM17 protein expression in the myocardium of NS- and DOX-treated mice (n = 6 in each group). k Comparison of ADAM17 mRNA expression in the myocardium of NS- and DOX-treated mice (n = 6 in each group). l Comparison of ADAM17 activity in the myocardium of NS- and DOX-treated mice (n = 6 in each group). m Representative western blot images of ADAM17 protein expression in NRCMs treated with DMSO, or DOX at different concentrations, respectively, for 24 h. n Comparison of ADAM17 protein expression in NRCMs treated with DMSO, or DOX at different concentrations, respectively, for 24 h (n = 6 in each group). o Comparison of ADAM17 mRNA expression in NRCMs treated with DMSO, or DOX at different concentrations, respectively, for 24 h (n = 6 in each group). p Comparison of ADAM17 activity in the NRCMs treated with DMSO, or DOX at different concentrations, respectively, for 24 h (n = 6 in each group). Values shown were mean and SEM. Unpaired two-tailed Student’s t-tests were applied in (cf, h, and jl). Mann–Whitney U test was applied in (g). One-way ANOVA were applied in (np). *p < 0.05; **p < 0.01; ***p < 0.001
Fig. 2
Fig. 2
Echocardiographic measurements and histological staining in ADAM17fl/fl and ADAM17α-MHCKO mice treated with NS or DOX. a Experiment timeline in vivo. b Representative echocardiographic images (scale bar = 2 mm) showing B-mode and M-mode echocardiograms in four groups of mice. c Comparison of left ventricular ejection fraction (LVEF) among four groups of mice (n = 6–10 in each group). d Comparison of left ventricular fractional shortening (LVFS) among four groups of mice (n = 6–10 in each group). e Representative anatomical images of heart size (scale bar = 2 mm) in four groups of mice. f Comparison of heart weight among four groups of mice (n = 6 in each group). g Comparison of heart weight/tibial length (HW/TL) ratio among four groups of mice (n = 6 in each group). h Representative WGA and H&E staining of myocardial cross-sections (scale bar = 50 μm) in four groups of mice. i Comparison of cardiac myocyte cross-sectional area measured by WGA staining (n = 6 in each group). j Representative Masson’s trichrome staining of myocardial interstitial and perivascular fibrosis in four groups of mice. k Comparison of interstitial fibrosis area among four groups of mice (n = 6 in each group). l Comparison of perivascular fibrosis area among four groups of mice (n = 6 in each group). Values shown were mean and SEM. One-way ANOVA were applied in (c, d, f, g, i, k and l). *p < 0.05; **p < 0.01; ***p < 0.001
Fig. 3
Fig. 3
Echocardiographic measurements and histological staining in negative control and ADAM17-overexpressing mice treated with NS or DOX. a Experiment timeline in vivo. b Representative echocardiographic images (scale bar = 2 mm) showing B-mode and M-mode echocardiograms in four groups of mice. c Comparison of left ventricular ejection fraction (LVEF) among four groups of mice (n = 6–10 in each group). d Comparison of left ventricular fractional shortening (LVFS) among four groups of mice (n = 6–10 in each group). e Representative anatomical images of heart size (scale bar = 2 mm) in four groups of mice. f Comparison of heart weight among four groups of mice (n = 6 in each group). g Comparison of heart weight/tibial length (HW/TL) ratio among four groups of mice (n = 6 in each group). h Representative WGA and H&E staining of myocardial cross-sections (scale bar = 50 μm) in four groups of mice. i Comparison of cardiac myocyte cross-sectional area measured by WGA staining (n = 6 in each group). j Representative Masson’s trichrome staining of myocardial interstitial and perivascular fibrosis in four groups of mice. k Comparison of interstitial fibrosis area among four groups of mice (n = 6 in each group). l Comparison of perivascular fibrosis area among four groups of mice (n = 6 in each group). Values shown were mean and SEM. One-way ANOVA were applied in (c, d, f, g, i, k and l). *p < 0.05; **p < 0.01; ***p < 0.001
Fig. 4
Fig. 4
Effects of ADAM17 knockout and overexpression on cardiomyocyte apoptosis in four groups of mice treated with NS or DOX. a Representative TUNEL-positive cardiomyocyte staining in four groups of mice (scale bar = 50 μm). b Comparison of TUNEL-positive cardiomyocyte in the myocardium among four groups of mice (n = 6 in each group). c Representative western blot images of PARP, cleaved PARP, caspase 3, cleaved caspase 3, Bax and Bcl2 expression in the myocardium of four groups of mice. d Comparison of cleaved PARP/PARP expression among four groups of mice (n = 6 in each group). e Comparison of cleaved caspase3/caspase3 expression among four groups of mice (n = 6 in each group). f Comparison of Bax/Bcl2 expression among four groups of mice (n = 6 in each group). g Representative TUNEL-positive cardiomyocyte staining in four groups of mice (scale bar = 50 μm). h Comparison of TUNEL-positive cardiomyocyte in the myocardium among four groups of mice (n = 6 in each group). i Representative western blot images of PARP, cleaved PARP, caspase 3, cleaved caspase 3, Bax and Bcl2 expression in the myocardium of four groups of mice. j Comparison of cleaved PARP/PARP expression among four groups of mice (n = 6 in each group). k Comparison of cleaved caspase3/caspase3 expression among four groups of mice (n = 6 in each group). l Comparison of Bax/Bcl2 expression among four groups of mice (n = 6 in each group). Values shown were mean and SEM. One-way ANOVA were applied in (b, df, h, and jl). *p < 0.05; **p < 0.01; ***p < 0.001
Fig. 5
Fig. 5
Effects of ADAM17 knockdown and overexpression on cardiomyocyte apoptosis in four groups of NRCMs treated with DMSO or DOX. a Representative TUNEL staining in four groups of NRCMs treated with siNC + DMSO, siNC + DOX, siA17 + DMSO and siA17 + DOX, respectively (scale bar = 5 μm). b Comparison of TUNEL-positive cells among four groups of NRCMs (n = 6 in each group). c Representative western blot images of PARP, cleaved PARP, caspase 3, cleaved caspase 3, Bax and Bcl2 expression in four groups of NRCMs. d Comparison of cleaved PARP/PARP expression among four groups of NRCMs (n = 6 in each group). e Comparison of cleaved caspase3/caspase3 expression among four groups of NRCMs (n = 6 in each group). f Comparison of Bax/Bcl2 expression among four groups of NRCMs (n = 6 in each group). g Representative TUNEL staining in four groups of NRCMs treated with NC + DMSO, NC + DOX, oeA17 + DMSO and oeA17 + DOX, respectively (scale bar = 5 μm). h Comparison of TUNEL-positive cells among four groups of NRCMs (n = 6 in each group). i Representative western blot images of PARP, cleaved PARP, caspase 3, cleaved caspase 3, Bax and Bcl2 expression in four groups of NRCMs. j Comparison of cleaved PARP/PARP expression among four groups of NRCMs (n = 6 in each group). k Comparison of cleaved caspase3/caspase3 expression among four groups of NRCMs (n = 6 in each group). l Comparison of Bax/Bcl2 expression among four groups of NRCMs (n = 6 in each group). Values shown were mean and SEM. One-way ANOVA were applied in (b, df, h, and j–l). *p < 0.05; **p < 0.01; ***p < 0.001
Fig. 6
Fig. 6
Transcriptome profiles of the myocardium in four groups of mice and the relation between ADAM17 and TRAF3 in the regulation of apoptosis-associated proteins in the NRCMs. a KEGG pathway enrichment analysis of differential expressing (DE) transcripts and bubble chart showing KEGG pathways enrichment in the heart of A17fl/fl + NS and A17fl/fl + DOX mice. b Heat map of 26 genes, which showed significant difference in the TNF signaling pathway between A17fl/fl + NS and A17fl/fl + DOX mouse hearts, were compared between A17α-MHCKO + DOX and A17fl/fl + DOX mouse hearts and the differences between the latter two groups were ranked by p values with the smallest p value on the top. c Representative western blot images of TRAF3 expression in the myocardium of four groups of mice. d Comparison of TRAF3 expression among four groups of mice (n = 6 in each group). e, f Representative western blot images and comparison of TRAF3 expression in four groups of NRCMs treated with siNC + DMSO, siNC + DOX, siA17 + DMSO and siA17 + DOX, respectively (n = 6 in each group). g Representative western blot images of PARP, cleaved PARP, caspase 3 and cleaved caspase 3 expression among four groups of NRCMs treated with NC + DOX, oe17 + DOX, siTRAF3 + DOX and oeA17 + siTRAF3 + DOX, respectively. h Comparison of cleaved PARP/PARP expression among four groups of NRCMs treated with NC + DOX, oe17 + DOX, siTRAF3 + DOX and oeA17 + siTRAF3 + DOX, respectively (n = 6 in each group). i Comparison of cleaved caspase3/caspase3 expression among four groups of NRCMs treated with NC + DOX, oe17 + DOX, siTRAF3 + DOX and oeA17 + siTRAF3 + DOX, respectively (n = 6 in each group). j Serum levels of TNF-α in A17fl/fl and A17α-MHCKO mice treated with NS or DOX (n = 6 in each group). k Serum levels of TNF-α in AAV9-oeNC and AAV9-oeA17 mice treated with NS or DOX (n = 6 in each group). l Supernatant levels of TNF-α in four groups of NRCMs treated with siNC + DMSO, siNC + DOX, siA17 + DMSO and siA17 + DOX, respectively (n = 6 in each group). m Supernatant levels of TNF-α in four groups of NRCMs treated with NC + DMSO, NC + DOX, oeA17 + DMSO and oeA17 + DOX, respectively (n = 6 in each group). n, o Representative western blot images and comparison of TRAF3 protein expression in the NRCMs treated with TNF-α at different concentrations for 24 h (n = 6 in each group). p Comparison of TRAF3 mRNA expression in NRCMs treated with TNF-α at different concentrations for 24 h (n = 6 in each group). Values shown were mean and SEM. One-way ANOVA were applied in (d, f, hm, o and p). *p < 0.05; **p < 0.01; ***p < 0.001
Fig. 7
Fig. 7
TNF-α enhanced TRAF3 expression in NRCMs treated with DOX, and interaction of TRAF3 and TAK1 leads to activation of MAPKs pathway. a, b Representative western blot images and comparison of protein expression of TRAF3 among three groups of NRCMs treated with NS, TNF-α and TNF-α + infliximab, respectively (n = 6 in each group). c Comparison of mRNA expression of TRAF3 among three groups of NRCMs treated with NS, TNF-α and TNF-α + infliximab, respectively (n = 6 in each group). d, e Representative western blot images and comparison of protein expression of TRAF3 among three groups of NRCMs treated with DMSO, DOX and DOX + infliximab, respectively (n = 6 in each group). f Comparison of mRNA expression of TRAF3 among three groups of NRCMs treated with DMSO, DOX, DOX + infliximab, respectively (n = 6 in each group). g Representative western blot images of cleaved PARP, PARP, cleaved caspase 3 and caspase 3 expression among three groups of NRCMs treated with DMSO, DOX and DOX + infliximab, respectively. h Comparison of cleaved PARP/PARP expression among three groups of NRCMs treated with DMSO, DOX and DOX + infliximab, respectively (n = 6 in each group). i Comparison of cleaved caspase3/caspase3 expression among three groups of NRCMs treated with DMSO, DOX, DOX + infliximab, respectively (n = 6 in each group). j, k Co-IP assay in NRCMs showing endogenous TRAF3 binding to TAK1. l, m Co-IP assay in HEK293T cells co-transfected with Myc-TRAF3 and Flag-TAK1 showing exogenous TRAF3 binding to TAK1. n Representative western blot images of phosphorylated TAK1, TAK1, phosphorylated JNK, JNK, phosphorylated P38 MAPK, P38 MAPK, phosphorylated ERK and ERK among four groups of NRCMs treated with siNC + DMSO, siNC + DOX, siTRAF3 + DMSO and siTRAF3 + DOX, respectively. o Comparison of protein expression of phosphorylated TAK1/TAK1 among four groups of NRCMs treated with siNC + DMSO, siNC + DOX, siTRAF3 + DMSO and siTRAF3 + DOX, respectively (n = 6 in each group). p Comparison of protein expression of phosphorylated JNK/JNK among four groups of NRCMs treated with siNC + DMSO, siNC + DOX, siTRAF3 + DMSO and siTRAF3 + DOX, respectively (n = 6 in each group). q Comparison of protein expression of phosphorylated P38 MAPK/P38 MAPK among four groups of NRCMs treated with siNC + DMSO, siNC + DOX, siTRAF3 + DMSO and siTRAF3 + DOX, respectively (n = 6 in each group). r Comparison of protein expression of phosphorylated ERK/ERK among four groups of NRCMs treated with siNC + DMSO, siNC + DOX, siTRAF3 + DMSO and siTRAF3 + DOX, respectively (n = 6 in each group). s Representative western blot images of phosphorylated TAK1, TAK1, phosphorylated JNK, JNK, phosphorylated P38 MAPK, P38 MAPK, phosphorylated ERK and ERK among three groups of NRCMs treated with DMSO, DOX and DOX + 5Z-7-ox, respectively. t Comparison of protein expression of phosphorylated TAK1/TAK1 among three groups of NRCMs treated with DMSO, DOX and DOX + 5Z-7-ox, respectively (n = 6 in each group). u Comparison of protein expression of phosphorylated JNK/JNK among three groups of NRCMs treated with DMSO, DOX and DOX + 5Z-7-ox, respectively (n = 6 in each group). v Comparison of protein expression of phosphorylated P38 MAPK/P38 MAPK among three groups of NRCMs treated with DMSO, DOX and DOX + 5Z-7-ox, respectively (n = 6 in each group). w Comparison of protein expression of phosphorylated ERK/ERK among three groups of NRCMs treated with DMSO, DOX and DOX + 5Z-7-ox, respectively (n = 6 in each group). x Representative western blot images of cleaved PARP, PARP, cleaved caspase 3 and caspase 3 expression among three groups of NRCMs treated with DMSO, DOX and DOX + 5Z-7-ox, respectively. y Comparison of cleaved PARP/PARP expression among three groups of NRCMs treated with DMSO, DOX and DOX + 5Z-7-ox, respectively (n = 6 in each group). z Comparison of cleaved caspase3/caspase3 expression among three groups of NRCMs treated with DMSO, DOX and DOX + 5Z-7-ox, respectively (n = 6 in each group). Values shown were mean and SEM. One-way ANOVA were applied in (b, c, e, f, h, i, or, tw, y and z). *p < 0.05; **p < 0.01; ***p < 0.001
Fig. 8
Fig. 8
Echocardiographic measurements in A17fl/fl and A17α-MHCKO tumor-bearing mice treated with NS or DOX. a Experiment timeline of breast cancer-bearing mice. b Representative anatomical images of tumor size (scale bar = 1 cm) in four groups of mice. c Comparison of tumor volume among four groups of mice (n = 6 in each group). d Comparison of tumor weight among four groups of mice (n = 6 in each group). e Representative echocardiographic images (scale bar = 2 mm) showing B-mode and M-mode echocardiograms in four groups of mice. f Comparison of left ventricular ejection fraction (LVEF) among four groups of mice (n = 6 in each group). g Comparison of left ventricular fractional shortening (LVFS) among four groups of mice (n = 6 in each group). h Experiment timeline of melanoma-bearing mice. i Representative anatomical images of tumor size (scale bar = 1 cm) in four groups of mice. j Comparison of tumor volume among four groups of mice (n = 6 in each group). k Comparison of tumor weight among four groups of mice (n = 6 in each group). l Representative echocardiographic images (scale bar = 2 mm) showing B-mode and M-mode echocardiograms in four groups of mice. m Comparison of left ventricular ejection fraction (LVEF) among four groups of mice (n = 6 in each group). n Comparison of left ventricular fractional shortening (LVFS) among four groups of mice (n = 6 in each group). Values shown were mean and SEM. One-way ANOVA were applied in (c, d, f, g, j, k, m and n). *p < 0.05; **p < 0.01; ***p < 0.001

References

    1. Wallace, K. B., Sardão, V. A. & Oliveira, P. J. Mitochondrial determinants of doxorubicin-induced cardiomyopathy. Circ. Res.126, 926–941 (2020). - PMC - PubMed
    1. Herrmann, J. Adverse cardiac effects of cancer therapies: cardiotoxicity and arrhythmia. Nat. Rev. Cardiol.17, 474–502 (2020). - PMC - PubMed
    1. Zhang, S. et al. Identification of the molecular basis of doxorubicin-induced cardiotoxicity. Nat. Med.18, 1639–1642 (2012). - PubMed
    1. Mukhopadhyay, P. et al. CB1 cannabinoid receptors promote oxidative stress and cell death in murine models of doxorubicin-induced cardiomyopathy and in human cardiomyocytes. Cardiovasc. Res.85, 773–784 (2010). - PMC - PubMed
    1. Wang, D. et al. USP36-mediated PARP1 deubiquitination in doxorubicin-induced cardiomyopathy. Cell. Signal.117, 111070 (2024). - PubMed

Publication types

MeSH terms