. 2024 Oct 15;15(10):749.
doi: 10.1038/s41419-024-07136-0.

USP7 depletion potentiates HIF2α degradation and inhibits clear cell renal cell carcinoma progression

Affiliations

USP7 depletion potentiates HIF2α degradation and inhibits clear cell renal cell carcinoma progression

Rongfu Tu et al. Cell Death Dis. .

Abstract

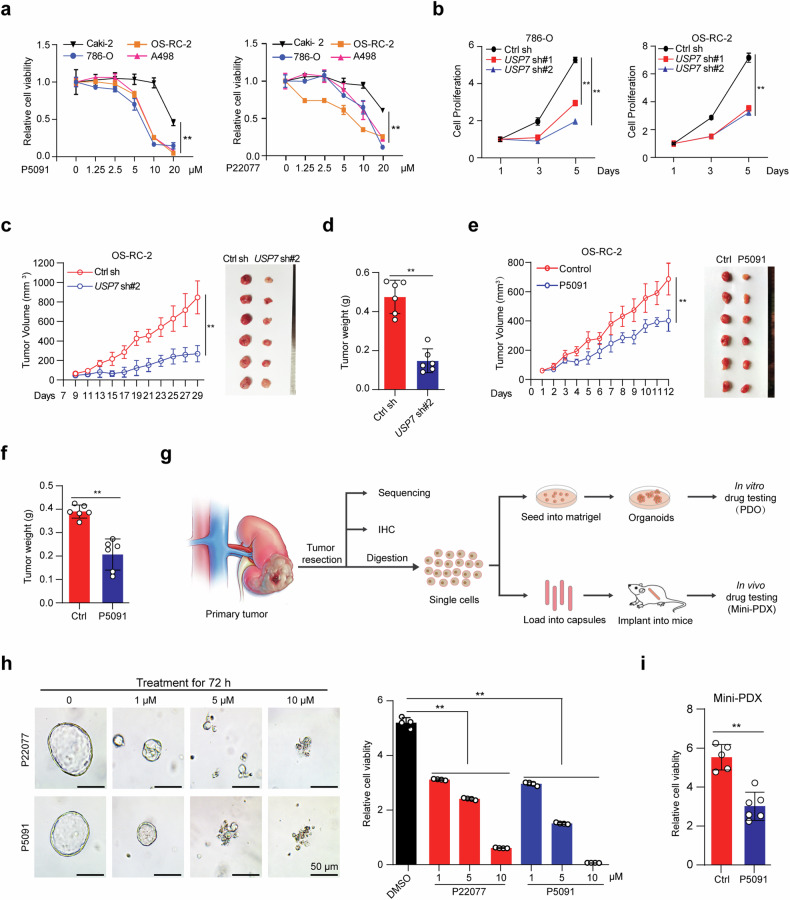
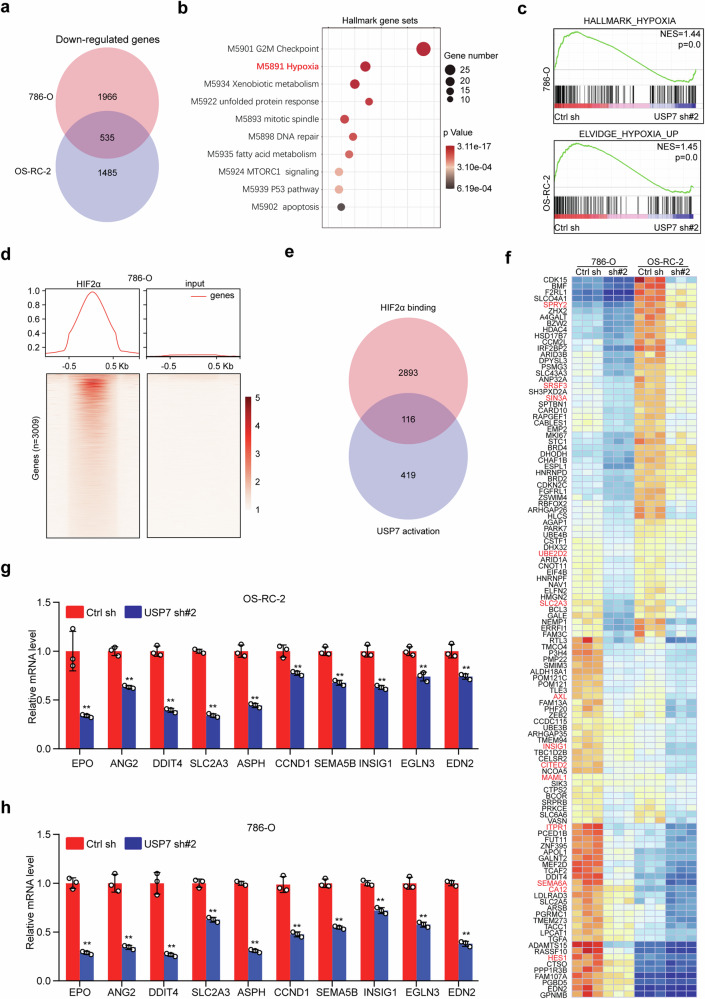
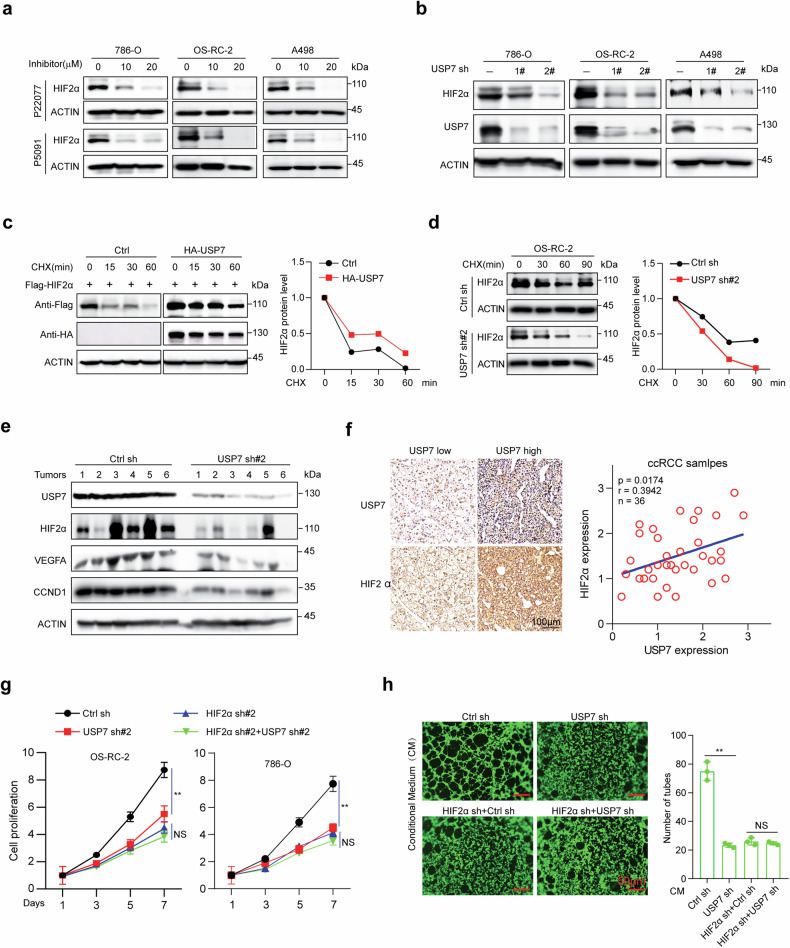
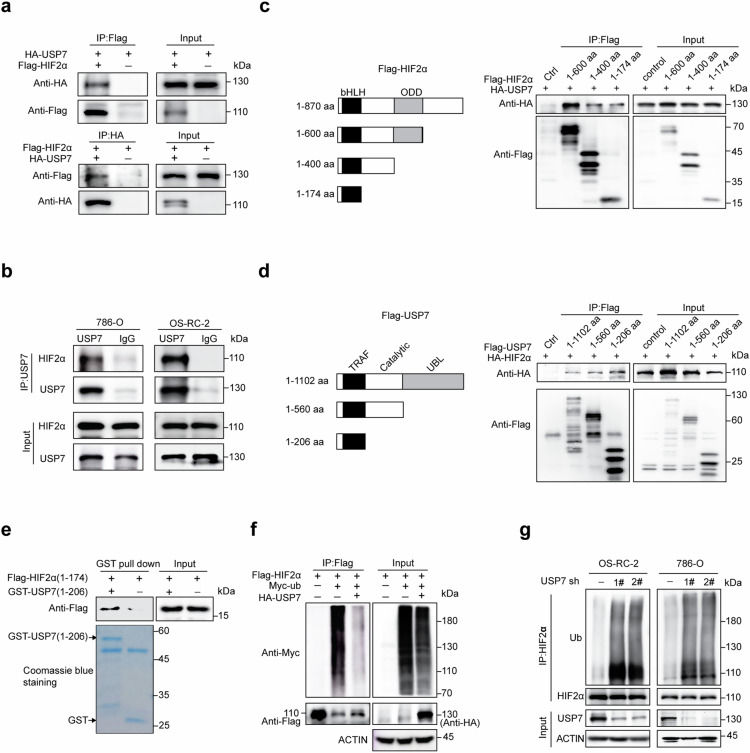
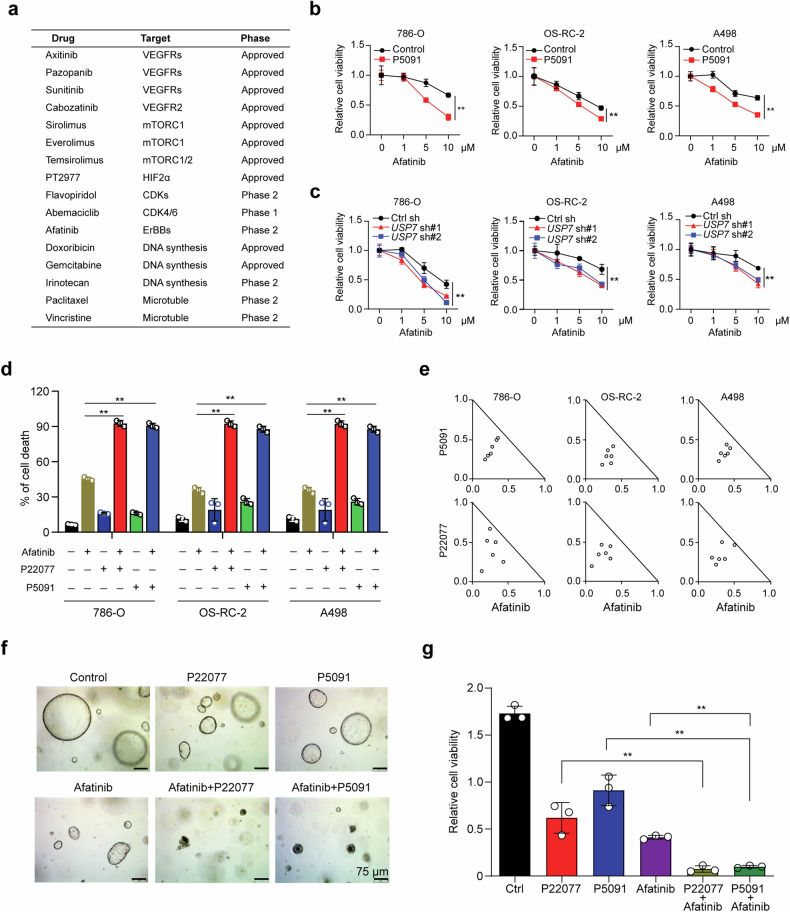
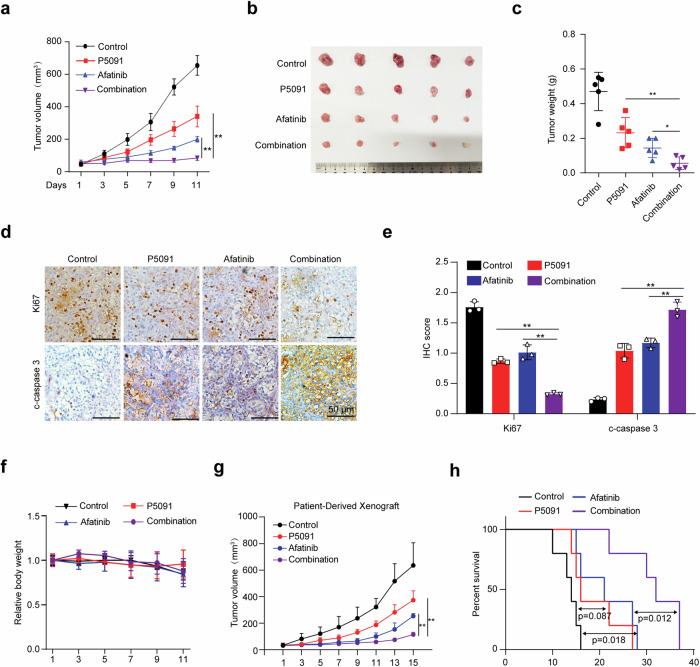
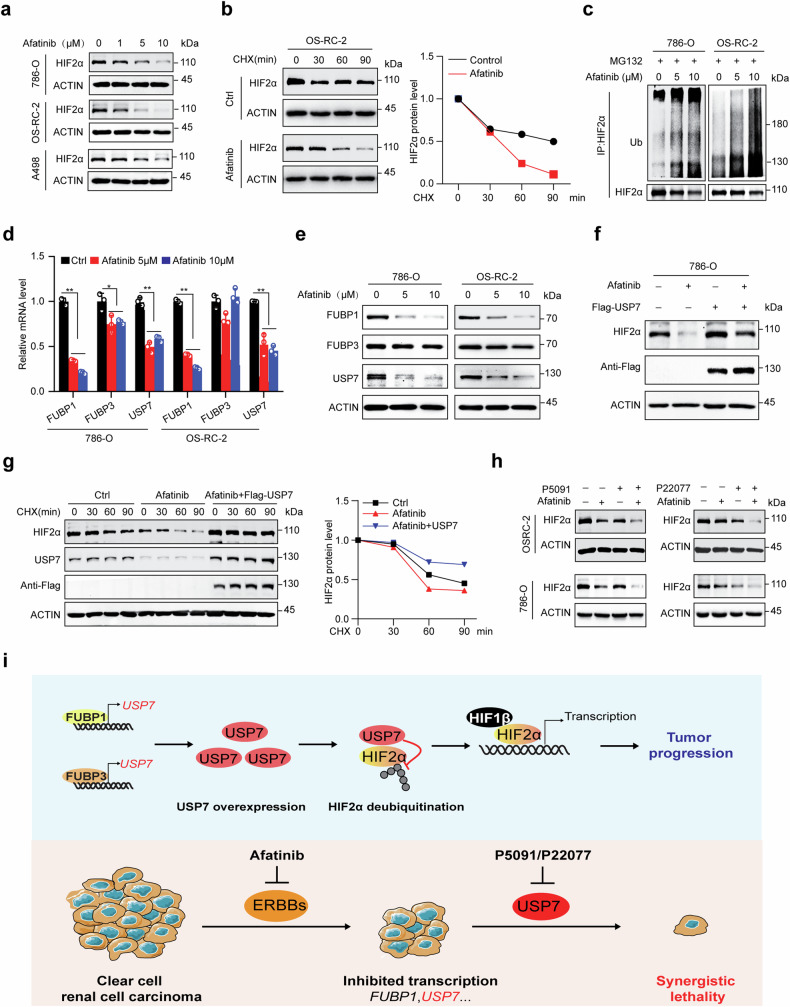
Clear cell renal cell carcinoma (ccRCC) is characterized by Von Hippel Lindau (VHL) gene loss of function mutation, which leads to the accumulation of hypoxia-inducible factor 2α (HIF2α). HIF2α has been well-established as one of the major oncogenic drivers of ccRCC, however, its therapeutic targeting remains a challenge. Through an analysis of proteomic data from ccRCCs and adjacent non-tumor tissues, we herein revealed that Ubiquitin-Specific Peptidase 7 (USP7) was upregulated in tumor tissues, and its depletion by inhibitors or shRNAs caused significant suppression of tumor progression in vitro and in vivo. Mechanistically, USP7 expression is activated by the transcription factors FUBP1 and FUBP3, and it promotes tumor progression mainly by deubiquitinating and stabilizing HIF2α. Moreover, the combination of USP7 inhibitors and afatinib (an ERBB family inhibitor) coordinately induce cell death and tumor suppression. In mechanism, afatinib indirectly inhibits USP7 transcription and accelerates the degradation of HIF2α protein, and the combination of them caused a more profound suppression of HIF2α abundance. These findings reveal a FUBPs-USP7-HIF2α regulatory axis that underlies the progression of ccRCC and provides a rationale for therapeutic targeting of oncogenic HIF2α via combinational treatment of USP7 inhibitor and afatinib.


Conflict of interest statement

The authors declare no competing interests.

Figures

Fig. 1
Fig. 1. USP7 is transcriptionally activated by FUBP1 and FUBP3 in ccRCCs.
a Venn diagrams showing up-regulated deubiquitinases in ccRCCs compared to adjacent normal tissues in two independent studies. The red diagram was identified in PMID: 35440542, and the blue one was identified in PMID: 36563681. b Comparison of five overlapped candidate protein levels in ccRCCs containing one of seven high-grade morphologic features and tumors without any of the aforementioned seven high-grade features, “+” represents the upregulation in certain subgroups, “−” represents no upregulation in certain subgroups. c The mRNA expression of USP7 and USP47 in 534 ccRCC samples was shown, and the data was obtained from the Cancer Genome Atlas Program (TCGA database, https://www.cancer.gov/). d USP7 protein expression in 13 ccRCCs and paired non-cancerous tissues were analyzed using Western blot. e Analysis of relative USP7 mRNA level in normal kidney (Normal) and ccRCC (Tumor) tissues using R2 genomics analysis and visualization platform (https://hgserver1.amc.nl/). f The mRNA correlation between FUBP1/FUBP3 and USP7 in 534 ccRCC samples was shown, the data was obtained from the Cancer Genome Atlas Program (TCGA database, https://www.cancer.gov/). g Cells were infected with control or FUBP1 shRNAs, FUBP1 and USP7 expression were analyzed using qRT-PCR and Western Blot. h Cells were infected with control or FUBP3 shRNAs, FUBP3 and USP7 expression were analyzed using qRT-PCR and Western Blot. i Schematic presentation of two potential FUBP1 binding sites proximal to the USP7 transcription initiation site, uFUSE: the binding sequence of FUBP1 within the USP29 promoter. j ChIP analysis of FUBP1 binding to the USP7 promoter in OS-RC-2 or 786-O cells. The binding signal was normalized to ACTIN and averages of fold enrichment between the FUBP1 antibodies and IgG are shown. k USP7 promoter sequence P1 (-5041bp - -4682bp) or P2 (-1860bp - -1501bp) was cloned into the pGL3-basic vector, Luciferase assays were carried out, and reporter activities are presented as average fold induction. The experiments were independently repeated three times with similar results, and the Graph shows mean ± SD from triplicates in one experiment (g, h, j, and k).
Fig. 2
Fig. 2. USP7 depletion suppresses VHL mutant ccRCC progression in vitro and in vivo.
a ccRCC cells were seeded in 96-well plates, 12 h later, the cells were treated with the indicated concentration of P5091 or P22077 for 24 h, and cell viability was measured using CCK-8. b ccRCC cells with or without USP7 knockdown were seeded in 96-well plates, and cell proliferation was measured using CCK-8. c and d OS-RC-2 cells with or without USP7 knockdown were resuspended in 200 μL PBS containing 50% matrigel and subcutaneously injected into nude mice (n = 6 for each group), the tumor growth (c) and tumor weight (d) were analyzed. e and f OS-RC-2 xenograft tumor with or without treatment of P5091 (i.p. 25 mg/kg), tumor growth curve and tumor images (e), and tumor weight (f) from mice subjected to indicated treatments were shown (n = 6 for each group). g Diagram of the process of establishing VHL mutant ccRCC PDO and mini-PDX model from patient tumors for in vitro and in vivo drug treatment. h ccRCC PDOs were seeded in 96 well plates, 48 h later, PDOs were treated with the indicated concentration of P5091 or P22077 for 72 h, Representative PDO images were shown (left) and the cell viability was analyzed using CellTiter-Glo® Luminescent Cell Viability Assay (right). Scale bar, 50 μm. i Primary ccRCC cells were loaded into capsules and implanted into nude mice for constructing the mini-PDX model, mice were administered with saline or P5091(i.p. 25 mg/kg) for 7 days, relative tumor viability was detected using the CellTiter-Glo® Luminescent Cell Viability Assay. The experiments were independently repeated three times with similar results (a, b, and h). Data are shown in mean ± SD, **p < 0.01.
Fig. 3
Fig. 3. USP7 knockdown impairs the HIF2α transcriptional program.
a Venn diagram of downregulated genes resulting from USP7 knockdown in OS-RC-2 and 786-O cells. Downregulated genes were identified as those with p < 0.05, and FPKM > 1 using edgeR software. b Pathway enrichment analysis of 535 overlapped genes using the Hallmark Gene Sets database (https://metascape.org). c Gene set enrichment analysis (GSEA) of hypoxia-induced gene sets in the differential expression profile of 786-O and OS-RC-2 cells upon USP7 depletion (https://www.gsea-msigdb.org/gsea/index.jsp). d HIF2α ChIP-seq signal in 786-O is plotted for the promoters (TSS ± 1 kb, n = 3009) of the genes shown, where red indicates higher enrichment, GSE34871. e Venn diagram of 3009 HIF2α binding genes and 535 USP7-activated genes. f Heatmap presentation of 116 overlapped genes as shown in (e), the published HIF2α targets were marked in red. g and h. Downstream genes of HIF2α were analyzed by qRT-PCR in OS-RC-2 (g) and 786-O (h) cells with or without USP7 depletion. Graph shows mean ± SD from triplicates (g and h). **p < 0.01.
Fig. 4
Fig. 4. USP7 enhances HIF2α stability and oncogenic roles.
a ccRCC cell lines were treated with the indicated concentration of P5091 or P22077 for 12 h, and the endogenous HIF2α protein level was analyzed by immunoblot using ACTIN as the loading control. b ccRCC cell lines were infected with control shRNA or USP7 shRNAs, and the endogenous USP7 and HIF2α protein levels were analyzed by immunoblot using ACTIN as the loading control. c 293T cells were transfected with indicated plasmids for 24 h and treated with cycloheximide (CHX, 100 μg/ml) for the indicated time, Flag-HIF2α level was analyzed and quantified by immunoblot with ACTIN as a loading control. d OS-RC-2 cells with or without USP7 knockdown were treated with CHX (100 μg/ml) for the indicated time, and endogeneous HIF2α level was analyzed and quantified by immunoblot with ACTIN as a loading control. e Immunoblots showing USP7, HIF2α, VEGFA, and CCND1 in xenograft tumors with or without USP7 knockdown by shRNA, six tumors were used per group, and ACTIN was used as a loading control. f IHC analysis of USP7 and HIF2α expression in a tissue microarray containing 36 ccRCC samples, representative images were shown (left) and the correlation between USP7 and HIF2α was analyzed (right). Scale bar, 100 μm. g Cells were infected with shRNAs targeting USP7 and/or HIF2α, and cell proliferation was assessed using CCK8. h Tube formation ability of HUVEC cultivated for 4 h in the conditional medium from infected OS-RC-2 cells, cells were treated with Calcein- AM. Scale bar, 50 μm. Pictures were taken with a fluorescence microscope, and tube numbers were counted. The experiments were independently repeated three times with similar results (ad, g and h). Data are shown in mean ± SD. **p < 0.01, NS means no significant difference.
Fig. 5
Fig. 5. USP7 interacts with and deubiquitinates HIF2α.
a 293T cells were co-transfected with Flag-HIF2α, HA-USP7, and/or the indicated vectors, the cell lysates were immunoprecipitated using anti-Flag or anti-HA antibodies and analyzed by immunoblotting with the indicated antibodies. b Lysates from OS-RC-2 or 786-O cells were subjected to immunoprecipitation using antibodies against USP7, and HIF2α protein was detected by immunoblots. c HEK293T cells were transfected with plasmids expressing Flag-HIF2α truncations and HA-USP7. The cell lysates were immunoprecipitated with an anti-Flag antibody and analyzed by immunoblotting with the indicated antibodies. d 293T cells were transfected with plasmids expressing Flag-USP7 or its truncations with HA-HIF2α, the cell lysates were immunoprecipitated with an anti-Flag antibody and analyzed by immunoblotting with the indicated antibodies. e GST pull-down assays were performed with the indicated GST-USP7 (1–206 aa) and cell lysates from 293T cells expressing Flag-HIF2α (1-174 aa), the immunoprecipitated Flag- HIF2 (1–174 aa) was analyzed by immunoblot. f 293T cells were co-transfected with the indicated plasmids. After 24 h, the cells were treated with 20 μM MG132 for 6 h and then subjected to denaturing immunoprecipitation using an anti-HA antibody followed by immunoblot analysis using the indicated antibodies. g ccRCC cells with or without USP7 depletion were treated with 20 μM MG13, 6 h later, cells were subjected to denaturing immunoprecipitation using HIF2α antibodies followed by immunoblot analysis using the indicated antibodies. The experiments were independently repeated three times with similar results (ag).
Fig. 6
Fig. 6. USP7 depletion synergizes with afatinib in VHL mutant ccRCC cells.
a List of drugs used for combined drug screening. b Cells were seeded in 96-well plates with 1*104 cells per well, 24 h later, cells were subjected to indicated concentration of afatinib with or without the combination of P5091 (10 μM) for 24 h, and cell viability was analyzed using CCK-8. c Cells with or without USP7 depletion were seeded in 96-well plates with 1*104 cells per well, 24 h later, cells were treated with the indicated concentration of afatinib for another 24 h and then cell viability was measured using CCK-8. d ccRCC cells were treated with USP7 inhibitor and/or Afatinib for 48 h before cell death analysis (right) by Annexin V–PI staining. e Combination Index (CI) of P5091/P22077 and Afatinib was analyzed in ccRCC cells using the CompuSyn software (Biosoft). f ccRCC PDOs were seeded in 96-well plates, 48 h later, the PDOs were subjected to the single or combinational treatment of P22077 (1 μM), P5091 (1 μM), and Afatinib (1 μM) for 10 days, representative images of PDOs were shown. Scale bar, 75 μm. g PDO cell viability in (f) was measured by CellTiter-Glo® Luminescent Cell Viability Assay. The experiments were independently repeated three times with similar results and the graph shows mean ± SD from triplicates (bd and f). **p < 0.01.
Fig. 7
Fig. 7. P5091 and afatinib synergistically suppress tumor progression in vivo.
a–c Xenograft tumor growth (a), tumor image (b) and tumor weight (c) of OS-RC-2 cells after 11 days of treatment with saline, P5091 (IP, 25 mg/kg), afatinib (IG, 20 mg/kg), and P5091/afatinib combination. n = 5 for each group. d and e Representative histological images of Ki67 and cleaved caspase 3 staining in tumors with different treatments (d) and the histological stain was quantified using ImageJ and plotted in (e). Scale bar, 50 μm. f Relative mouse body weight during treatment. g PDXs tumor growth with the treatment of saline, P5091 (IP, 25 mg/kg), afatinib (IG, 20 mg/kg), and P5091/afatinib combination, n = 5 for each group. h Kaplan–Meier survival curve of mice in (g). Data are shown in mean ± SD, **p < 0.01.
Fig. 8
Fig. 8. Afatinib degrades HIF2α by suppressing the FUBP1–USP7 regulatory axis.
a Cells were treated with the indicated concentration of Afatinib for 24 h, and HIF2α protein levels were analyzed by immunoblots with ACTIN as loading control. b Cells with or without the pretreatment of 5 μM Afatinib for 24 h were subjected to the administration of CHX (100 μg/ml) for the indicated time, and HIF2α levels were analyzed and quantified with ACTIN as control. c Cells were pretreated with the indicated concentration of Afatinib for 24 h, and then treated with 20 μM MG132 for 6 h, the polyubiquitination level of HIF2α was analyzed by denaturing immunoprecipitation and immunoblots. d and e Cells were treated with the indicated concentration of Afatinib for 24 h, and FUBP1, FUBP3, and USP7 expression levels were analyzed by qRT-PCR (d) and immunoblots (e). f 786-O cells with or without Flag-USP7 expression were treated with 10 μM Afatinib for 24 h, and protein expression was analyzed using immunoblots. g 786-O cells with or without USP7 expression were pretreated with 5 μM Afatinib for 24 h, and then subjected to the administration of CHX (100 μg/ml) for the indicated time, HIF2α levels were analyzed and quantified with ACTIN as control. h Single or combinational treatment of P5091 (5 μM), P22077 (5 μM), and Afatinib (5 μM) for 24 h, HIF2α protein levels were analyzed by immunoblots with ACTIN as loading control. i Proposed a mechanism for the action of FUBP1/3-USP7-HIF2α regulatory axis in ccRCC tumor progression and the mechanism-based targeted strategy. The experiments were independently repeated three times with similar results (ah), and the Graph shows mean ± SD from triplicates in one experiment (d). **p < 0.01, *p < 0.05.

References

    1. Bray F, Ferlay J, Soerjomataram I, Siegel RL, Torre LA, Jemal A. Global cancer statistics 2018: GLOBOCAN estimates of incidence and mortality worldwide for 36 cancers in 185 countries. CA Cancer J Clin. 2018;68:394–424. - PubMed
    1. Hsieh JJ, Purdue MP, Signoretti S, Swanton C, Albiges L, Schmidinger M, et al. Renal cell carcinoma. Nat Rev Dis Primers. 2017;3:17009. - PMC - PubMed
    1. Jonasch E, Gao J, Rathmell WK. Renal cell carcinoma. BMJ. 2014;349:g4797. - PMC - PubMed
    1. Jaakkola P, Mole DR, Tian YM, Wilson MI, Gielbert J, Gaskell SJ, et al. Targeting of HIF-alpha to the von Hippel–Lindau ubiquitylation complex by O2-regulated prolyl hydroxylation. Science. 2001;292:468–72. - PubMed
    1. Ivan M, Kondo K, Yang H, Kim W, Valiando J, Ohh M, et al. HIFalpha targeted for VHL-mediated destruction by proline hydroxylation: implications for O2 sensing. Science. 2001;292:464–8. - PubMed

MeSH terms

Substances