. 2024 Oct 15;15(1):8895.
doi: 10.1038/s41467-024-53039-1.

Targeting IRE1α reprograms the tumor microenvironment and enhances anti-tumor immunity in prostate cancer

Affiliations

Targeting IRE1α reprograms the tumor microenvironment and enhances anti-tumor immunity in prostate cancer

Bilal Unal et al. Nat Commun. .

Abstract

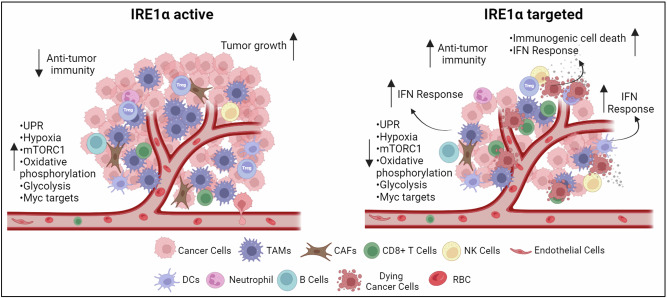
Unfolded protein response (UPR) is a central stress response pathway that is hijacked by tumor cells for their survival. Here, we find that IRE1α signaling, one of the canonical UPR arms, is increased in prostate cancer (PCa) patient tumors. Genetic or small molecule inhibition of IRE1α in syngeneic mouse PCa models and an orthotopic model decreases tumor growth. IRE1α ablation in cancer cells potentiates interferon responses and activates immune system related pathways in the tumor microenvironment (TME). Single-cell RNA-sequencing analysis reveals that targeting IRE1α in cancer cells reduces tumor-associated macrophage abundance. Consistently, the small molecule IRE1α inhibitor MKC8866, currently in clinical trials, reprograms the TME and enhances anti-PD-1 therapy. Our findings show that IRE1α signaling not only promotes cancer cell growth and survival but also interferes with anti-tumor immunity in the TME. Thus, targeting IRE1α can be a promising approach for improving anti-PD-1 immunotherapy in PCa.


Conflict of interest statement

JBP is employee and shareholder of Fosun Orinove. The remaining authors declare no competing interests.

Figures

Fig. 1
Fig. 1. IRE1α signaling is activated in human PCa.
A IRE1α expression was examined by IHC in normal prostate (n = 22) and PCa samples (n = 117); representative images, including low (n = 66) and high (n = 51) IRE1α expression are shown. Images are presented from Vancouver cohort. B IHC quantification from A. C IRE1α expression scores from B were stratified according to Gleason scores [Gleason 6 (n = 31) and 7–10 (n = 65)] as indicated. Among the 64 grade 7 to 10 tumor samples analyzed, approximately 47% (30 samples) exhibited high IRE1α expression (H-score > 5). D IRE1α IHC analysis results from the Oslo cohort (n = 20) matched to adjacent normal tissue (n = 20). E UPR gene expression is dysregulated in PCa. Hallmark UPR gene expression score in primary (n = 499), castration resistant PCa (CRPC) (n = 183), or neuroendocrine PCa (NEPC) (n = 23) samples compared with normal prostate tissue from the GTEX (n = 119) or tumor adjacent normal TCGA (n = 52) datasets. Data analyzed by One-way Anova. F TCGA PCa samples were split into two groups as low (N = 200) or high (N = 200) based on normalized XBP1s splicing read counts and used in GSEA and immune cell infiltration analyzes. G GSEA plots for Hallmark UPR and protein secretion in the TCGA PCa dataset, where samples were split based on XBP1s read counts. H As in G, but different Hallmarks are interrogated. Mean ± standard error by unpaired two-tailed Mann Whitney t-test is presented for figure (B, C), C (p = 0.0235), E (p = 0.0001), and F; two-tailed paired Wilcoxon signed-rank test was used for D (p = 0.0002). *p < 0.05, ***p < 0.001, ****p < 0.0001.
Fig. 2
Fig. 2. Loss of IRE1α inhibits PCa tumor growth and activates the expression of anti-tumor immunity-related genes in the TME.
A, B Myc-CaP IRE1α KO cell lines were generated by CRISPR-Cas9 genome editing. Cells were subcutaneously injected into two flanks of FVB mice. A Tumor sizes were measured at the indicated time points for WT (n = 4 mice, 7 tumors) and three independent IRE1α KO clones - KO1 (n = 4 mice, 7 tumors), KO2 (n = 5 mice, 10 tumors) and KO3 (n = 5 mice, 10 tumors). B Same as in (A) but tumor weights were measured at the end of the experiment. C IRE1α WT (n = 3 mice, 5 tumors) or KO clones 1–3 (n = 3 mice, 6 tumors per KO clone) of Myc-CaP cells grown as xenografts in nude mice. D, E Tumor samples were collected at the end of the experiment presented in Fig. 2A, RNA was isolated and subjected to RNA-seq analysis. KO clones (n = 3 mice, 3 tumors per KO clone) were compared with WT (n = 4 mice, 4 tumors) samples. GSEA for (D) downregulated or (E) upregulated genes in IRE1α KO tumors is presented. Note that for several processes, the q-value equals 3; this is because the GSEA tool computes 3 as the maximum possible q-value. F, G Enrichment plots for the indicated datasets enriched in GSEA analysis related to (F) innate or (G) adaptive immunity are presented. Mean ± standard error for two-tailed student’s t-test is presented for Figure (A) (IRE1α WT vs KO #1 (p = 0.0008), vs KO #2 (p = 0.0007), vs KO #3 (p = 0.003), for Figure (B) (IRE1α WT vs KO #1 (p = 3.4E-05), KO #2 (p = 0.001), vs KO #3 (p = 0.008), and for Figure C (WT vs KO #3, p = 0.87); **p < 0.01, ***p < 0.001, n.s, non-significant.
Fig. 3
Fig. 3. IRE1α loss in cancer cells augments the IFN signaling response in PCa tumors.
The RNA-seq data from Fig. 2 was analyzed in further detail. A Volcano plot indicating the up- and down-regulated genes in tumors from the three independent Myc-CaP IRE1α KO clones (based on average gene expression); the most prominent gene sets, Hallmark UPR and IFN-γ response genes are color coded in blue and red, respectively. B GSEA plots show the enrichment of IFN-γ and IFN-α responses in IRE1α KO vs WT comparison. C The heatmap displays genes differentially expressed in WT and IRE1α KO (#1-3) tumor samples, as well as their expression in the RNA-seq data from in vitro grown cells. UPR and IFN-γ response genes are indicated. D Expression of specific genes from tumors of WT (n = 4 tumors, except for p58IPK and Pkr genes (n = 3 tumors), and IRE1α KO clones (n = 9 tumors, except for genes Pdia6, Atf3, and Pkr (n = 6 tumors), Mthfd2 and Herpud1 (n = 5 tumors), p58IPK and Irf9 (n = 7 tumors), and Klrk4 (n = 8 tumors)) were analyzed by qRT-PCR analysis.Source data and exact p-values are provided as a Source Data for this figure. E, F Tumor samples collected at the end of the experiment from Fig. 2A were analyzed by proteomics. E Volcano plot shows upregulated (red) and downregulated (blue) proteins in IRE1α KO tumors (n = 3 mice, 3 tumors) compared to WT (n = 4 mice, 4 tumors) counterparts. F Enrichr results of selected pathways for up- and down-regulated proteins are indicated. G RNA-seq and proteomics data were compared in a Venn diagram. H Scatter plot shows high correlation between proteomics and RNA-seq results for IRE1α KO vs WT comparison. Genes with significantly altered expression (p < 0.05) in both experiments are indicated in red. Mean ± standard error by two-tailed student’s t-test is presented for figure (D). Two-tailed student’s t-test is used for figure A, E, and H. Two-sided Fisher’s exact test is used for figure F. *p < 0.05, **p < 0.01. r represents Spearman correlation where indicated.
Fig. 4
Fig. 4. scRNA-seq analysis reveals changes in the TME landscape upon loss of IRE1α in PCa cells.
A, B scRNA-seq was performed from WT and IRE1α KO (clone #2) tumors (six tumor samples per group were pooled for scRNA-seq) and cell types were clustered and annotated based on the marker genes expressed in each cell type. A The dot plot displays the marker genes that define each cell type that were annotated. The color intensity and size of the dots represent average gene expression and percentage expression of the specified marker genes within the respective cell type population, respectively. B UMAP plots show clustering of single cells from WT (11,071 cells) and IRE1α KO (8,434 cells) single cells, with cell types represented by different colors. C The table shows the percentage abundance of each indicated cell type within the TME, along with the observed percentage changes between WT and IRE1α KO tumors. D The UMAP plots demonstrate subtypes of TAMs in WT and IRE1α KO tumors. Different TAM subtypes are represented by distinct colors, based on the markers presented in Supplementary Fig. 6A. The fifth cluster, exhibiting cancer cell markers (likely resulting from doublets), was excluded from the further analysis. E Percentage abundance of the TAM subtypes is indicated, along with the observed percentage changes in IRE1α KO compared to WT tumors. The percentage of each TAM sub-type in the total TAM population in WT tumors are indicated in parentheses. F The dot plot illustrates the results of the GSEA conducted on the indicated cell types using scRNA-seq data. It represents the normalized enrichment score (NES), with up- and down-regulated pathways color-coded in red and blue, respectively. The size of each dot corresponds to the -log10 (p-value) of the indicated pathway for the respective cell types. For the details of statistical test used for figure (F).
Fig. 5
Fig. 5. MKC8866 inhibits PCa tumor growth in syngeneic PCa mouse models.
AC Myc-CaP cells were subcutaneously injected into FVB mice. A Schematic view of MKC8866 treatment. Mice were randomized and treated orally with vehicle (n = 7 mice, 14 tumors) or MKC8866 (300 mg/kg) (n = 7 mice, 14 tumors) once every two days. B Tumor volumes at indicated days and (C) tumor weights at the end of experiment. DF Validation of Myc-CaP PTEN KO cell line by western analysis (inset). WT and PTEN KO cells were subcutaneously injected into FVB mice. D Tumor volumes are presented for WT and PTEN KO tumors (n = 5 mice each, 9 tumors per each group). E PTEN KO tumor weights were measured at day 16–18 when WT tumors were maximum 0.1 g, as indicated. F Myc-CaP WT and PTEN KO (n = 2 biological replicates per group) cells were subjected to qRT-PCR. G Association of PD-L1 and B7-H3 mRNA expression with IRE1α mRNA low (n = 160) and high (n = 129) samples in the TCGA PCa dataset. H MKC8866 treatment strategy for Myc-CaP PTEN KO or RM-1 models. Tumor volume for (I) Myc-CaP PTEN KO (vehicle and MKC8866, n = 8 mice each, 16 tumors per group) and (J) RM-1 (vehicle and MKC8866, n = 7 mice each, 14 tumors per group) models. Same as in (I and J), but tumor weights were measured at the end of the experiment for (K) Myc-CaP PTEN KO and (L) RM-1 models. Mean ± standard error by two-tailed student’s t test is presented for figure (B, C), C (p = 0.007), D (p = 1-06E-05 for day 16), E (p = 8.7E-07), I, K (p = 0.005), J, and L (p = 1.4E-05); unpaired two-tailed Mann Whitney t-test is used for figure (G); **p < 0.01, ***p < 0.001, ****p < 0.0001. Source data and exact p values are provided as a Source Data for figures (B, I, and J). In box-plots, whiskers represent 10–90 percentile and middle lines indicate median of the data. Figures 5A and 5H were created in BioRender. Unal, B. (2023) BioRender.com/u75i711.
Fig. 6
Fig. 6. MKC8866 synergizes with anti-PD-1 immunotherapy in syngeneic PCa mouse models.
AC MKC8866 synergizes with anti-PD-1 treatment in Myc-CaP model. A Schematic representation of the experiment in the Myc-CaP mouse model. B Tumor volumes were measured at the indicated days for Vehicle + anti-IgG or Vehicle + anti-PD-1 (n = 4 mice, 7 tumors) and MKC8866 + anti-IgG or MKC8866 + anti-PD-1 (n = 4 mice, 8 tumors). C Same as in (B), but tumor weights were measured at the end of the experiment. DF MKC8866 synergizes with anti-PD-1 treatment in Myc-CaP PTEN KO model. D Schematic representation of the experiment. E Tumor volumes measured at the indicated days are shown for Vehicle + anti-IgG (n = 6 mice, 11 tumors), Vehicle + anti-PD-1 (n = 8 mice, 15 tumors), MKC8866 + anti-IgG (n = 9 mice, 18 tumors), and MKC8866 + anti-PD-1 (n = 8 mice, 16 tumors). F Same as in (E) but tumor weights at the end of the experiment are presented. GI MKC8866 enhances the efficacy of anti-PD-1 treatment in the RM-1 model. G Schematic representation of the experiment. H Tumor volumes measured at the indicated days are shown for Vehicle + anti-IgG (n = 6 mice, 11 tumors), Vehicle + anti-PD-1 (n = 7 mice, 14 tumors), MKC8866 + anti-IgG (n = 7 mice, 14 tumors), and MKC8866 + anti-PD-1 (n = 6 mice, 12 tumors). I Same as in (H), but tumor weights at the end of the experiment are presented. J Body weights of the mice from (B, E, and H) with the specified treatments for Myc-CaP, Myc-CaP PTEN KO, and RM-1 models respectively. Mean ± standard error by two-tailed student’s t test is presented for figure B, E, F, H, I, and J; unpaired two-tailed Mann Whitney t-test is used for C; *p < 0.05, **p < 0.01, ***p < 0.001, ****p < 0.0001, n.s, non-significant. Source data and exact p values are provided as a Source Data for figures (B, C, E, F, H, I, and J). Figures 6A, 6D and 6G were created in BioRender. Unal, B. (2023) BioRender.com/u75i711.
Fig. 7
Fig. 7. MKC8866 + anti-PD-1 combination therapy reprograms the TME landscape and enhances CD8+ T and NK cell infiltration.
scRNA-seq was performed on tumor samples from the experiment presented in Fig. 6D and E (six tumor samples per group were pooled for scRNA-seq). A Different colors in the UMAP plot represent the assigned cell types identified based on the marker genes in Supplementary Fig. 7 A. B The table displays the percentage abundance of each cell type within the TME and the observed percentage changes for the different treatments compared to vehicle. C Volcano plot indicates the up- and down-regulated genes in the CD8+ T cell cluster in the scRNA-seq data from tumor samples of mice treated with MKC8866 + anti-PD-1 compared with vehicle. Notable up- and down-regulated genes were highlighted as red and blue, respectively. D The dot plot displays selected GSEA results (for hallmark gene sets) from scRNA-seq data for the different treatments compared to vehicle. Significantly up- or down-regulated pathways are depicted in red and blue, respectively. Dot size corresponds to the -log10 (p-value) of each pathway for the respective cell type. E Volcano plots indicate the up- and down-regulated genes in the indicated TAM subtypes for combination therapy vs vehicle. Notable up- and down-regulated genes are highlighted as red and blue, respectively. F) Chord plot displaying the result from CellChat analyzes showing the MHC-I signaling pathway interaction between indicated cell types from tumor samples of mice treated with combination therapy. G The Venn diagram summarizes the differentially expressed genes (p < 0.05) that were significantly altered in the CD8+ T cell cluster from tumors of combination therapy compared to the differentially expressed genes (p < 0.05) in the scRNA-seq data from the CD8+ T cell cluster in pembrolizumab + enzalutamide responsive versus non-responsive mCRPC patient samples as reported previously. H The heatmap indicates the log2 fold-change expression of overlapping genes from Figure G in the CD8+ T cell cluster from tumors of mice for the indicated treatments compared to vehicle treatment. The Wilcoxon rank-sum test implemented in Seurat was used for Figures (C, E, and G).
Fig. 8
Fig. 8. A TAM gene signature derived from scRNA-seq data is strongly associated with poor prognosis in patients with PCa.
A Representative images are shown for IREα and CD68 IHC staining in human PCa specimens. B Quantification of CD68+ tumor infiltrating macrophages [IRE1α low (n = 54) and high (n = 49)] is presented for human PCa tumor samples. C Xcell macrophage and M2 macrophage infiltration scores of TCGA PCa tumors divided according to XBP1s low (n = 200) and high (n = 200) expression similar to in Fig. 1F. D Volcano plot indicates the up-and down-regulated genes in the main macrophage (TAMs) cluster in the scRNA-seq data that was shown in Fig. 4B–E. E TAM gene signature expression in the indicated PCa patients from the publicly available datasets. Normal prostate tissue (GTEX): n = 119; Tumor adjacent normal (TCGA): n = 52; Primary PCa (TCGA): n = 499; CRPC: n = 183; NEPC: n = 23. F PCa patients with high Gleason score [Gleason 6 (n = 45), 7 (n = 247), 8 (n = 64), 9 (n = 137), and 10 (n = 4)] exhibit an elevated TAM gene signature score in the TCGA PCa dataset. G Kaplan-Meier plots illustrate a positive correlation between increased expression of the TAM signature (depicted as blue) and significantly shorter progression free survival in the TCGA dataset, and shorter disease-free survival in MSKCC PCa datasets. Mean ± standard error by unpaired two-tailed Mann Whitney t-test is presented for B (p = 0.006), (C) (p = 0.002 for left and p = 0.0003 for right figures), and (E) (Adjacent Normal vs Primary PCa: p = 0.002); one-way Anova is used for figure (F) (source data and exact p values are provided as a Source Data); *p < 0.05, **p < 0.01, ***p < 0.001, ****p < 0.0001. In box-plots, whiskers represent 10–90 percentile and middle lines indicate median of the data. The Wilcoxon rank-sum test implemented in Seurat was used for D.
Fig. 9
Fig. 9. Schematic summary of the main findings of the study.
IRE1α activation in cancer cells inhibits the IFN responses and fosters the accumulation of immunosuppressive cells such as TAMs and Tregs within the TME. This hinders the ability to mount an effective anti-tumor immune response that results in tumor progression. IRE1α genetic targeting in cancer cells or combination therapy (MKC8866 + anti-PD-1) augments the IFN responses in antigen-presenting cells, such as TAMs and DCs, and also decreases the abundance of immunosuppressive cells within the TME. This facilitates robust anti-tumor immune responses, effectively impeding tumor growth. Created in BioRender. Unal, B. (2023) BioRender.com/u75i711.

References

    1. Walter, P. & Ron, D. The unfolded protein response: from stress pathway to homeostatic regulation. Science334, 1081–1086 (2011). - PubMed
    1. Hetz, C., Zhang, K. & Kaufman, R. J. Mechanisms, regulation and functions of the unfolded protein response. Nat. Rev. Mol. Cell Biol.21, 421–438 (2020). - PMC - PubMed
    1. Marciniak, S. J., Chambers, J. E. & Ron, D. Pharmacological targeting of endoplasmic reticulum stress in disease. Nat. Rev. Drug Discov.21, 115–140 (2022). - PubMed
    1. Sheng, X. et al. Divergent androgen regulation of unfolded protein response pathways drives prostate cancer. EMBO Mol. Med7, 788–801 (2015). - PMC - PubMed
    1. Sheng, X. et al. IRE1alpha-XBP1s pathway promotes prostate cancer by activating c-MYC signaling. Nat. Commun.10, 323 (2019). - PMC - PubMed

Publication types

MeSH terms

Associated data