. 2024 Oct 15;15(1):8889.
doi: 10.1038/s41467-024-53332-z.

Widespread mutagenesis and chromosomal instability shape somatic genomes in systemic sclerosis

Affiliations

Widespread mutagenesis and chromosomal instability shape somatic genomes in systemic sclerosis

Sriram Vijayraghavan et al. Nat Commun. .

Abstract

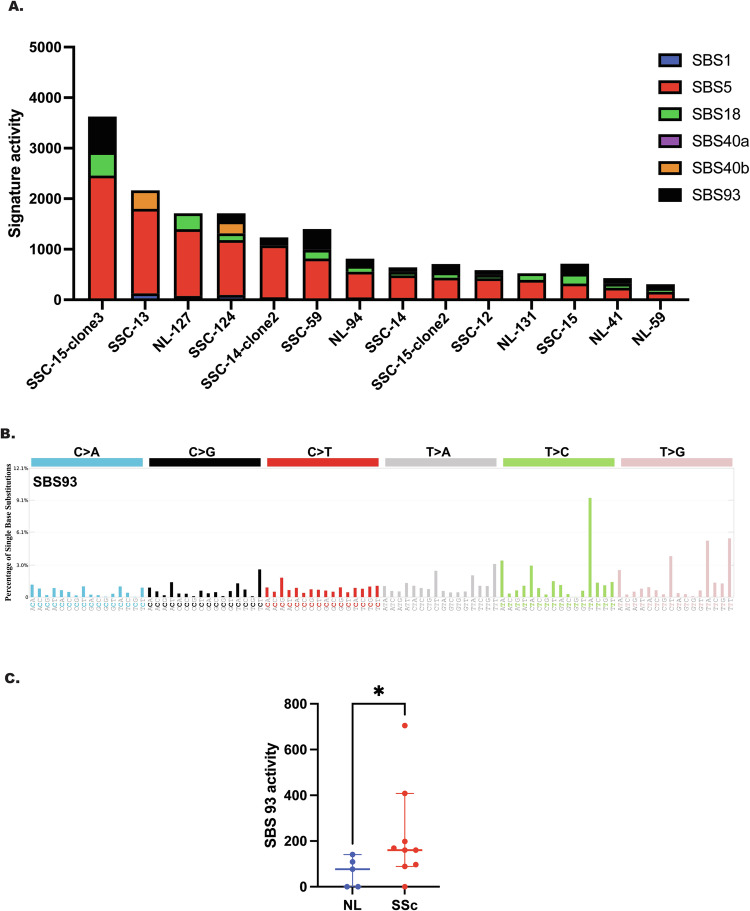
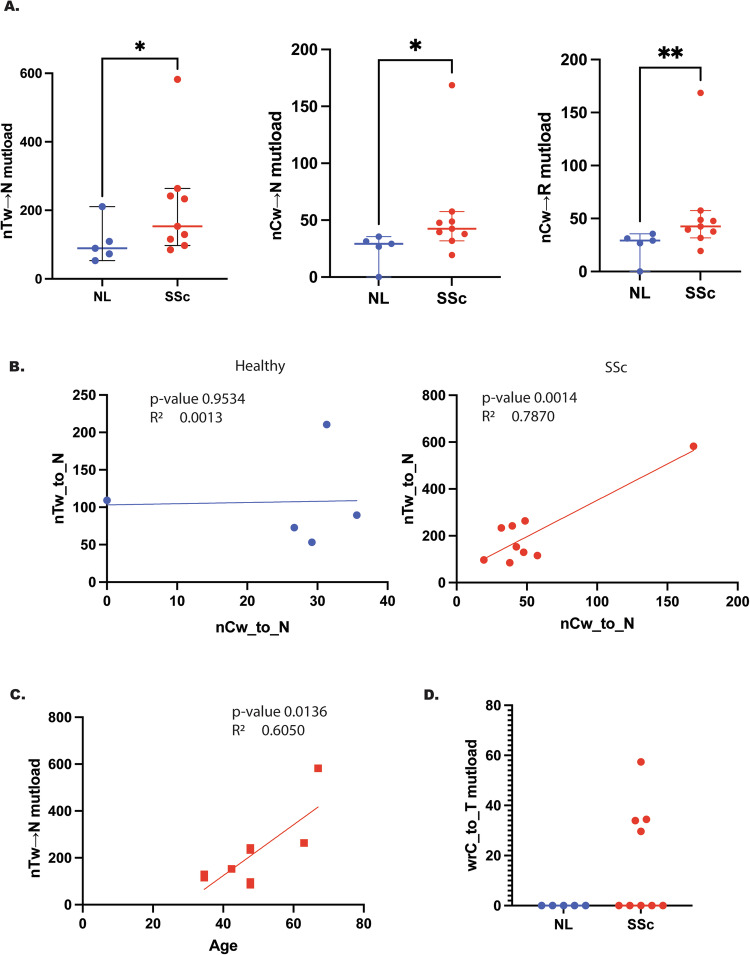
Systemic sclerosis is a connective tissue disorder characterized by excessive fibrosis that primarily affects women, and can present as a multisystem pathology. Roughly 4-22% of patients with systemic sclerosis develop cancer, which drastically worsens prognosis. However, the mechanisms underlying systemic sclerosis initiation, propagation, and cancer development are poorly understood. We hypothesize that the inflammation and immune response associated with systemic sclerosis can trigger DNA damage, leading to elevated somatic mutagenesis, a hallmark of pre-cancerous tissues. To test our hypothesis, we culture clonal lineages of fibroblasts from the lung tissues of controls and systemic sclerosis patients and compare their mutation burdens and spectra. We find an overall increase in all major mutation types in systemic sclerosis samples compared to control lung samples, from small-scale events such as single base substitutions and insertions/deletions, to chromosome-level changes, including copy-number changes and structural variants. In the genomes of patients with systemic sclerosis, we find evidence of somatic hypermutation or kategis (typically only seen in cancer genomes), we identify mutation signatures closely resembling the error-prone translesion polymerase Polη activity, and observe an activation-induced deaminase-like mutation signature, which overlaps with genomic regions displaying kataegis.


Conflict of interest statement

The authors declare no competing interests.

Figures

Fig. 1
Fig. 1. SBS levels are elevated in SSc samples.
A Schematic of somatic mutation analysis of healthy v SSc samples, starting with single-cell clone isolation from patient lung fibroblasts, whole genome sequencing, and variant analysis. B Mutation load of SBS in NL and SSc samples. Per sample mutations and aggregate mutations (healthy v SSc, accounting for the sample size) are shown for all samples. C Median NL vs SSc SNVs. Values based on 5 healthy (NL) and 9 SSc samples. D NL v SSc SNVs accounting for smoking status and age of donors. Usage of 1ppd (pack-per-day) for >20 years was considered heavy smoking status (See Supplementary Data 1). For both B and C, heavy smokers are indicated by open circles. Color schematic- Healthy (NL)-blue, SSc-red. Error bars represent 95% confidence intervals. Source data are provided as a Source Data file.
Fig. 2
Fig. 2. MSA-derived mutational signatures identified in SSc.
Signature assignments are based on COSMIC-derived signatures from the analysis of human whole genome sequenced cancers. A SBS signature assignment per sample B. Mutational profile of COSMIC SBS93. C Median SBS93 signature activity in cumulative healthy v SSc samples. Values based on 5 healthy (NL) and 9 SSc samples. Error bars represent 95% confidence intervals. Asterisk represents the significant statistical difference in median values of NL vs SSc mutation loads based on a p-value of 0.0270 from a one-tailed Mann-Whitney T-test. Color schematic- Healthy (NL)-blue, SSc-red. Source data are provided as a Source Data file.
Fig. 3
Fig. 3. Discrete POLH and AID-like mutation signatures in SSc samples.
A Comparisons of minimum mutation loads of POLH -associated mutation signatures between healthy and SSc samples from TriMS signature analysis. Error bars represent 95% confidence intervals. Values based on 5 healthy (NL) and 9 SSc samples. * represents statistically significant p-values based on a one-sided Mann-Whitney test comparing median mutation loads, with * denoting p-values < 0.05, ** denoting p-values < 0.005. p-values are as follows: nTw→N = 0.0466, nCw→N = 0.0148, nCw→R = 0.0095. B Correlation between the minimum mutation loads of nTw→N vs.nCw→N POLH signatures for SSc samples. n = A/T/G/C, w = A/T. C Correlation of nTw→N minimum mutation load with sample age in SSc samples. D Comparison of AID-like wrC→T mutation loads between NL (“healthy”) and SSc samples. Mutated residue is at the 3rd position in the trinucleotide, w = A/T, r = A/G. For panels B and C p-values are based on a simple linear regression, whereby R-squared values represent the goodness-of-fit, and p-values < 0.05 are deemed statistically significant. For all panels, the color schematic is as follows: Healthy (NL)-blue, SSc-red. Source data are provided as a Source Data file.
Fig. 4
Fig. 4. Other small mutational events in SSc.
A Comparison of overall DBS loads between healthy and SSc samples, heavy smokers are identified by open circles. Median mutation loads plotted and p-value = 0.1983 calculated based on a one-sided Mann Whitney test. B Comparisons of overall COSMIC DBS mutation signature activity in cumulative healthy v SSc samples. C Comparisons of overall COSMIC INDEL mutation signature activity in cumulative healthy v SSc samples. Median mutation loads plotted and p-value = 0.0789 calculated based on a one-sided Mann Whitney test. D Comparison of overall INDEL loads between healthy and SSc samples. Heavy smokers are identified by open circles. For A and C, error bars represent 95% confidence intervals. Values based on 5 healthy (NL) and 9 SSc samples. Color schematic- Healthy (NL)-blue, SSc-red. Source data are provided as a Source Data file.
Fig. 5
Fig. 5. Mutation clusters and chromosomal instability in SSc.
A Representative rainfall plot shown for sample SSc-14-clone 2. Inter-mutational distance was calculated, and mutations assigned as doublet base substitutions (DBS), kataegis (long strand coordinated clustered hypermutation), or omiklii (diffuse hypermutation) using parameters described in ref. . B Copy number variation in SSc. Representative segmented chromosome plots for SSc-12, showing large scale deletion at Chr 6 (inset). Plots were generated after smoothening and segmenting of the raw output from Varscan copynumber. log2 threshold was re-centered to 0.0 (neutral), with anything above the threshold counting as a “gain” (amplification), and anything below as a “loss“ (deletion) event. Red and blue represent numerically-ordered bins of chromosomes. C Circular chromosome plot of structural variants (SV) in SSc samples, showing the following SVs —SSc-59- inversion (orange line) in the pericentromeric region (red square in chromosome track) on Chr 2 and a deletion in Chr3 (purple line); SSc-14- deletion in Chr 14 (purple line); SSc-15-clone 1-deletion in Chr 1 (purple line), SSc-124- deletion in Chr 15 (purple line). Plots were generated using RCircos. Source data are provided as a Source Data file.

References

    1. Peoples, C., Medsger, T. A. Jr., Lucas, M., Rosario, B. L. & Feghali-Bostwick, C. A. Gender differences in systemic sclerosis: relationship to clinical features, serologic status and outcomes. J. Scleroderma Relat. Disord.1, 177–240 (2016). - PMC - PubMed
    1. Fan, Y., Bender, S., Shi, W. & Zoz, D. Incidence and prevalence of systemic sclerosis and systemic sclerosis with interstitial lung disease in the United States. J. Manag Care Spec. Pharm.26, 1539–1547 (2020). - PMC - PubMed
    1. Ferri, C. et al. Systemic sclerosis: demographic, clinical, and serologic features and survival in 1,012 Italian patients. Medicine81, 139–153 (2002). - PubMed
    1. Scussel-Lonzetti, L. et al. Predicting mortality in systemic sclerosis: analysis of a cohort of 309 French Canadian patients with emphasis on features at diagnosis as predictive factors for survival. Med. (Baltim.)81, 154–167 (2002). - PubMed
    1. Meier, F. M. et al. Update on the profile of the EUSTAR cohort: an analysis of the EULAR Scleroderma Trials and Research group database. Ann. Rheum. Dis.71, 1355–1360 (2012). - PubMed

Publication types

LinkOut - more resources