. 2024 Oct 15;15(1):8897.
doi: 10.1038/s41467-024-53211-7.

A genome-first study of sex chromosome aneuploidies provides evidence of Y chromosome dosage effects on autism risk

Affiliations

A genome-first study of sex chromosome aneuploidies provides evidence of Y chromosome dosage effects on autism risk

Alexander S F Berry et al. Nat Commun. .

Abstract

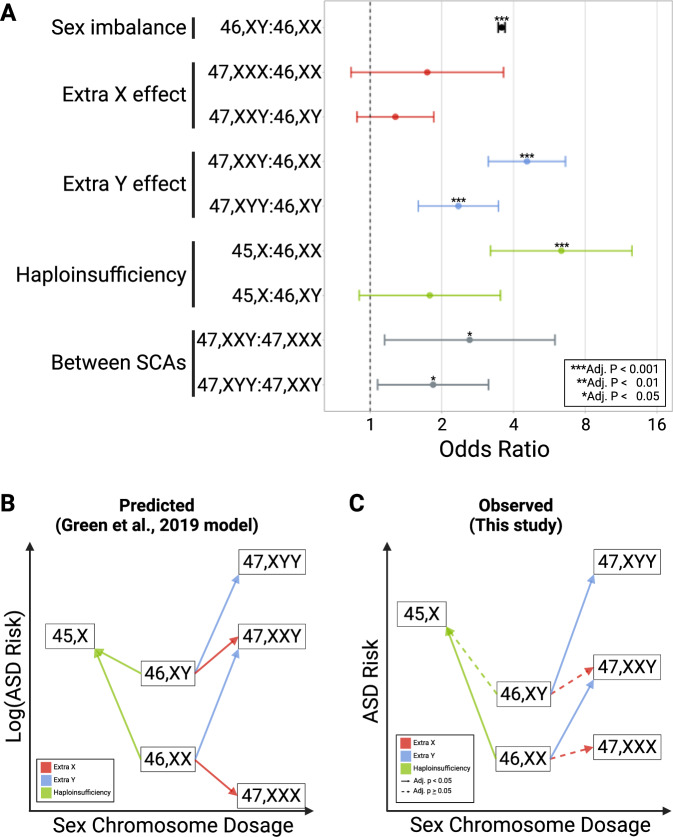
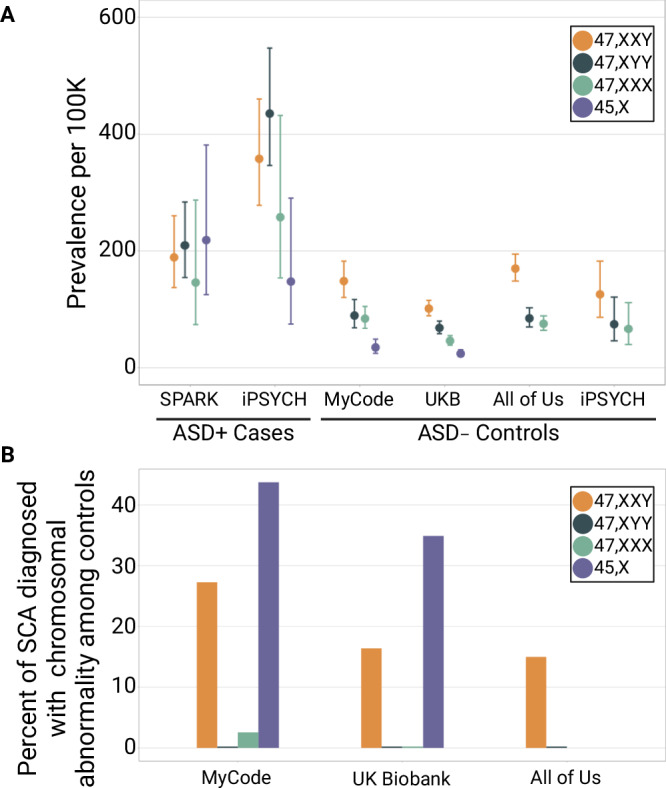
A female protective effect has long been postulated as the primary explanation for the four-fold increase of autism spectrum disorder (ASD) diagnoses in males versus females. However, genetic and epidemiological investigations of this hypothesis have so far failed to explain the large difference in ASD prevalence between the sexes. To address this knowledge gap, we examined sex chromosome aneuploidy in a large ASD case-control cohort to evaluate the relationship between X and Y chromosome dosage and ASD risk. From these data, we modeled three relationships between sex chromosome dosage and ASD risk: the extra Y effect, the extra X effect, and sex chromosome haploinsufficiency. We found that the extra Y effect increased ASD risk significantly more than the extra X effect. Among females, we observed a large association between 45, X and ASD, confirming sex chromosome haploinsufficiency as a strong ASD risk factor. These results provide a framework for understanding the relationship between X and Y chromosome dosage on ASD, which may inform future research investigating genomic contributors to the observed sex difference.


Conflict of interest statement

D.H. Ledbetter reported being a scientific consultant to Nest Genomics, MyOme, Singular Genomics, and X-Therma. No other disclosures were reported.

Figures

Fig. 1
Fig. 1. Sex chromosome aneuploidy identification in the SPARKMC-SCA cohort.
A Log R ratio (LRR) plots are shown for the SPARK Autism Spectrum Disorder (ASD)-positive case cohort and (B) the MyCode ASD-negative control cohort. LRR plots in panels (A and B) are composite images that were created by juxtaposing data across genotype batches and platforms for a cohort-wide visualization. LRR plots for each individual batch are shown in Figures S1 and S2. The x-axis shows the median LRR for the X chromosome and the y-axis shows the median LRR for the Y chromosome. Colors indicate each individual’s sex chromosome complement. Participants with sex chromosome aneuploidies excluded from the analysis: 45, X; 48, XXXX; 48, XXXY; and 48, XXYY are shown in gray. C An example of an X chromosome-wide B allele frequency (BAF) plot for each sex chromosome aneuploidy included in the analysis. The x-axis shows the position along the X chromosome in megabase pairs (Mbp). The y-axis shows the BAF of each genotype and ranges between 0 to 1. The 47, XXY karyotype can occur by inheriting an X chromosome from each parent, called heterodisomy (het) or by inheriting homologous X chromosomes, called uniparental isodisomy (iso). D The table shows the number of ASD-positive cases and ASD-negative controls (outcome) with each sex chromosome complement (exposure) in the SPARKMC-SCA cohort. Source data are provided as a Source Data file.
Fig. 2
Fig. 2. Risk of Autism Spectrum Disorder (ASD) by sex chromosome complement.
The risk of ASD was compared between sex chromosome complements in the SPARKMC-SCA cohort. A Forest plot shows the results of logistic regression for each comparison. Points denote calculated odds ratio and error bars represent 95% confidence intervals. The groupings on the Y-axis and colors indicate the central hypothesis from Green et al., tested in the comparison. Asterisks denote level of statistical significance for each 2-sided test, adjusted using Benjamini-Hochberg false discovery rate correction (Adj. p). Adjusted p-values for each comparison are as follows: 46, XY:46, XX, < 2.22 × 10−16; 47, XXX:46, XX, 0.18; 47, XXY:46, XY, 0.23; 47, XXY:46, XX, 9.2 × 10−15; 47, XYY:46, XY, 5.1 × 10−5; 45, X:46, XX, 4.9 × 10−7; 45, X:46, XY, 0.14; 47, XXY:47, XXX, 0.04; 47, XYY:47, XXY, 0.04. Sample sizes used to derive statistics for each sex chromosome complement are as follows: 46, XX, 98,277; 46, XY, 78,790; 47, XXY, 125; 47, XYY, 94; 47, XXX, 86; 45, X, 44. B Representation of the effects of sex chromosome dosage on autism risk in those with a sex chromosome aneuploidy relative to those with two sex chromosomes as shown in the Green et al. model which is based on the autism prevalence reported by clinical studies of sex chromosome aneuploidies. ASD risk is log-transformed to emphasize a consistent pattern between the Green et al. model and the observed results. C The plot summarizes the results of logistic regression analyses performed here in a large ASD case-control cohort. Solid lines indicate the association is statistically significant at adjusted P < 0.05 while dashed lines indicate adjusted P ≥ 0.05. All tests were 2-sided. P-values were not reported in the Green et al. model. Source data are provided as a Source Data file.
Fig. 3
Fig. 3. Meta-analysis of SPARKMC-SCA and iPSYCH-SCA.
The ASD risk estimates from the SPARKMC-SCA and iPSYCH-SCA studies were meta-analyzed for each comparison shown. A Forest plot shows ASD risk associated with 47,XXY or 47,XYY relative to a 46,XY reference. B Forest plot shows ASD risk associated with 47,XXX or 47,XXY relative to a 46,XX reference. Brackets indicate the results of comparisons between extra Y and extra X effect sizes from the meta-analysis. Colors identify whether the odds ratio resulted from analyses from the SPARKMC-SCA cohort alone (red), the iPSYCH-SCA cohort alone (blue), or from meta-analyzing both results together (black). Red and blue points denote odds ratio calculated from logistic regression analyses and error bars represent the associated 95% confidence intervals. Black points denote effect sizes calculated from each meta-analysis (Meta) using a fixed-effects model in metafor, and error bars represent the associated 95% confidence intervals. Asterisks denote level of statistical significance for each 2-sided test, adjusted using Benjamini-Hochberg false discovery rate correction (Adj. p), and are shown only for meta-analysis results. Adjusted p-values for all comparisons are shown in Tables S9 and S10 in the Supplement. Sample sizes used to derive statistics for each sex chromosome complement in the SPARKMC-SCA cohort are as follows: 46, XX, 98,277; 46, XY, 78,790; 47, XXY, 125; 47, XYY, 94; 47, XXX, 86. Sample sizes used to derive statistics for each sex chromosome complement in the iPSYCH-SCA cohort are as follows: 46, XX, 26,524; 46, XY, 38,114; 47, XXY, 87; 47, XYY, 89; 47, XXX, 28. Source data are provided as a Source Data file.
Fig. 4
Fig. 4. Prevalence and diagnosis rate of sex chromosome aneuploidies (SCAs) across cohorts.
A Forest plot shows the prevalence of each sex chromosome aneuploidy among Autism Spectrum Disorder (ASD)-positive cases from SPARK (n = 25,085) and iPSYCH (n = 22,200), and among ASD-negative controls from MyCode (n = 152,331), UK Biobank (n = 487,865), All of Us (n = 308,248), and iPSYCH (n = 42,654). Error bars represent 95% confidence intervals for binomial probabilities. B Bar plot shows the percent of individuals with a genetically-identified SCA who have a clinical diagnosis for a chromosomal abnormality among ASD-negative controls. SCA diagnosis data was not available for SPARK or iPSYCH participants. For visualization, a value of 0.25% in the plot corresponds to an actual percent diagnosed of 0%. 45, X prevalence and diagnosis rates are not shown for the All of Us cohort or for iPSYCH controls, and 47, XXX diagnosis rates are not shown for the All of Us cohort because no data or statistics can be reported that allow a participant count of 1 to 20 (All of Us) or 1 to 5 (iPSYCH) to be derived. Source data are provided as a Source Data file.
Fig. 5
Fig. 5. Household income, educational attainment, and cognitive measurements associated with sex chromosome aneuploidy (SCA).
A Forest plots show the results of ordinal regression analyses of the correlation between SCA and household income or educational attainment. Error bars indicate 95% confidence intervals. Household income and educational attainment data were only available for the UK Biobank (blue) and All of Us (green) ASD-negative control cohorts. B Stacked bar plots show the proportion of each SCA in each household income or educational attainment bracket in the UK Biobank and All of Us ASD-negative control cohorts. For the All of Us cohort, no data or statistics can be reported that allow a participant count of 1 to 20 to be derived, therefore only two household income brackets are shown (<$10 K per year and ≥ $10 K per year), and three educational attainment brackets are shown (did not complete 12th grade, completed 12th grade or GED, and completed at least one year beyond 12th grade). Bracket colors range from gray for the lowest household income or educational attainment bracket to yellow for highest household income or educational attainment bracket. C Fluid intelligence exam performance in the UK Biobank was measured by an exam given to participants. Forest plot shows the standard deviation and 95% confidence intervals of fluid intelligence exam performance for each comparison between sex chromosome complements, calculated using linear regression. Colors indicate the central hypothesis from Green et al., tested in the comparison. The density plot to the right shows the distribution of fluid intelligence exam performance z-scores for each SCA. Vertical dashed lines denote the mean fluid intelligence exam performance z-score for each SCA. Sample sizes used to derive statistics for fluid intelligence exam performance by sex chromosome complement are as follows: 46, XX, 128,942; 46, XY, 106,783; 47, XXY, 87; 47, XYY, 72; 47, XXX, 56; 45, X, 19. D) Forest plot shows the standard deviation (points) and 95% confidence intervals (error bars) of six additional cognitive tests (pairs matching (n = 472,378), reaction time (n = 482,486), digit span (n = 161,626), symbol digit (n = 131,797), numeric trail making (n = 119,731), and alphanumeric trail making (n = 119,131)) for sex-matched comparisons between SCAs and 46, XX or 46, XY, calculated using linear regression. Source data are provided as a Source Data file.

References

    1. American Psychiatric Association. Diagnostic and Statistical Manual of Mental Disorders, Fifth Edition. (American Psychiatric Publishing, Arlington, VA, 2013).
    1. Tsai, L. Y. & Beisler, J. M. The development of sex differences in infantile autism. Br. J. Psychiatry142, 373–378 (1983). - PubMed
    1. Robinson, E. B., Lichtenstein, P., Anckarsäter, H., Happé, F. & Ronald, A. Examining and interpreting the female protective effect against autistic behavior. Proc. Natl Acad. Sci. Usa.110, 5258–5262 (2013). - PMC - PubMed
    1. Falconer, D. S. The inheritance of liability to certain diseases, estimated from the incidence among relatives. Ann. Hum. Genet.29, 51–76 (1965).
    1. Antaki, D. et al. A phenotypic spectrum of autism is attributable to the combined effects of rare variants, polygenic risk and sex. Nat. Genet.54, 1284–1292 (2022). - PMC - PubMed

Publication types