. 2024 Oct 15;14(1):24182.
doi: 10.1038/s41598-024-73975-8.

Sall4 and Gata4 induce cardiac fibroblast transition towards a partially multipotent state with cardiogenic potential

Affiliations

Sall4 and Gata4 induce cardiac fibroblast transition towards a partially multipotent state with cardiogenic potential

Hong Gao et al. Sci Rep. .

Abstract

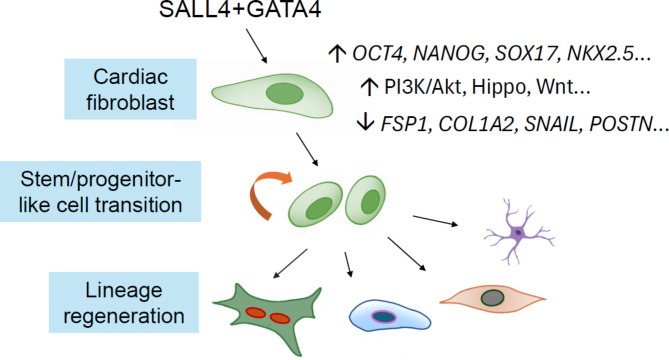
Cardiac cellular fate transition holds remarkable promise for the treatment of ischemic heart disease. We report that overexpressing two transcription factors, Sall4 and Gata4, which play distinct and overlapping roles in both pluripotent stem cell reprogramming and embryonic heart development, induces a fraction of stem-like cells in rodent cardiac fibroblasts that exhibit unlimited ex vivo expandability with clonogenicity. Transcriptomic and phenotypic analyses reveal that around 32 ± 6.4% of the expanding cells express Nkx2.5, while 13 ± 3.6% express Oct4. Activated signaling pathways like PI3K/Akt, Hippo, Wnt, and multiple epigenetic modification enzymes are also detected. Under suitable conditions, these cells demonstrate a high susceptibility to differentiating into cardiomyocyte, endothelial cell, and extracardiac neuron-like cells. The presence of partially pluripotent-like cells is characterized by alkaline phosphatase staining, germ layer marker expression, and tumor formation in injected mice (n = 5). Additionally, significant stem-like fate transitions and cardiogenic abilities are induced in human cardiac fibroblasts, but not in rat or human skin fibroblasts. Molecularly, we identify that SALL4 and GATA4 physically interact and synergistically stimulate the promoters of pluripotency genes but repress fibrogenic gene, which correlates with a primitive transition process. Together, this study uncovers a new cardiac regenerative mechanism that could potentially advance therapeutic endeavors and tissue engineering.

Keywords: Cardiac regeneration; Oct4; Partial reprogramming; Pluripotency; Protein interaction; Sox17.


Conflict of interest statement

The authors declare no competing interests.

Figures

Fig. 1
Fig. 1
Stem-like clusters induced by Gata4 and Sall4-based transcription factors. (A) Bright field and fluorescence images showing aggregated clusters following overexpression of indicated factors in RCFs for up to two weeks (from n ≥ 3 separate transduction experiments for each group). The GFP and GMT group cells served as controls. A phase/fluorescence overlay image is shown for the GS group cells. (B) Top: Images of GS cell colonies containing different numbers of cells in secondary cultures. Bottom: Expanding GS cell colonies at indicated passages. (C) Cell population doubling time data showing significantly accelerated GS cell growth compared to GFP control RCFs. Ns: not significant, ***p < 0.001; n = 3.
Fig. 2
Fig. 2
Expression of pluripotency and cardiac progenitor markers in GS cells. (A) Fold mRNA changes for indicated genes in GS cells (p9) versus GFP-treated RCFs. Data was normalized using β-actin as the reference gene; ***p < 0.001, **p < 0.01; n = 3 separate cultures. (B) Single and dual antibody IF staining depicting indicated marker proteins (in red) in GS cells (data collected from passages 6–12). Cell nuclei were counterstained with DAPI (in blue). (C) Flow cytometric dot plots showing indicated marker expressions in GS cells vs. GFP control RCFs, with bar graph percentage values presented separately. More than 8000 events were analyzed. *p < 0.05, **p < 0.01, ***p < 0.01; n = 3.
Fig. 3
Fig. 3
Differentiation of GS cells into cardiovascular cell types. (A) (i) Bright field image of aggregated GS cells in the ICG-001-based solution at day 3 (n > 12). (ii-iii) IF staining of GS-CMs with dual antibodies (n > 4 separate experiments), with bar graph showing the percentages of cTNT+ cells by high-throughput imaging analysis (iv; n = 3 staining/group). (B) Sarcomeric structures observed in cTNT+ and α-actinin+ cells (see 40× images). (C) Flow cytometric dot plots illustrating the distribution of cTNT+ cells in GS cells vs. GS-CMs, with bar graphs showing the percentage values separately (n ≥ 3 treatments). (D) Top: co-cultured GS-CM clusters, but not GMT or GFP treated RCFs, demonstrated contractility (images here, see Video Files). Bottom: representative cell length cycling for each group is displayed (n > 3). (E) Differentiated EC-like cells stained with indicated single or dual antibodies (i ~ ii). Multiple CD31+ cells formed a lumen structure (iii ~ iv; n ≥ 3). Percentages of cells expressing each cardiac trilineage marker protein are shown (n = 3 staining/group). (F) Differentiated GS-SMCs expressed indicated marker proteins with quantification analyses of trilineage markers (n = 3 staining/group).
Fig. 4
Fig. 4
Transcriptomic analysis of GS cells and following differentiation. (A) Heatmaps of RNA-seq data illustrating a list of differentially expressed genes in GS cells (p12), GSdiff1, GSdiff2, and RCF group cells (n = 3 preparations for each group). (B) KEGG pathway analysis revealed a total of 19 significantly enriched pathways in GS cells compared to control RCFs based on adjusted p values (padj). The numbers of differentially expressed genes are shown. (C) Venn diagram showing the total numbers of overlapping and differentially expressed genes among each GS cell treatment group and control RCFs.
Fig. 5
Fig. 5
Assessment of pluripotency and differentiation of extracardiac lineages. (A) Images of scattered and intensive alkaline phosphatase expression seen in clustered GS cells but not in the control RCFs (from n > 4 separate viral transduction experiments). (B) The GS cells were aggregated in an EB media and then detected for indicated gene expressions by RT-PCR and agarose gel electrophoresis. Images are cropped from two parts of raw gel data, outlined in red in Supplementary Figure S7; n ≥ 3 separate experiments. (C) The GS cells developed tumors in injected NSG mice. Representative H&E staining images of sectioned tumors showing differentiated glandular and cartilage tissues. Neuron-like cells were detected by IHC staining using a βIII-tubulin (TUJ-1) antibody. (D) Representative Tuj1 IF staining comparing parental fibroblasts with GS cell-derived neuron-like cells on day 6, n > 3 separate experiments.
Fig. 6
Fig. 6
Stem-like feature transitions in HCFs and cardiac differentiation. (A) Representative ALP staining in GS-overexpressed HCFs (GS-HCFs, 14-day and 21-day experiments), versus GFP control cells (n > 4). (B) qRT-PCR analysis of mRNA expressions in GS-HCFs (21-day) vs. non-infected mock HCFs. Data was normalized using GAPDH as the reference gene. ***p < 0.001, **p < 0.01; n = 3. UD: CT value undetected. 40/40: MOI numbers used for G and S vectors. (C) Single and dual antibody IF staining showing expression of indicated pluripotency and CPC marker proteins in enlarged GS-HCF at p2 (n > 3 separate experiments). (D) Representative flow cytometric dot plots and bar graph showing the proportions of positively stained cells in indicated groups (n = 3 separate experiments). (E) Single and dual antibody IF staining showing indicated marker expressions. Cells with sarcomeric structures in cTNT+ cells are presented (40image), with bar graph quantification estimated in indicated HCF groups. n ≥ 3 separate experiments. **p < 0.01.
Fig. 7
Fig. 7
Inefficient transition effects in skin fibroblasts. (A) A phase/fluorescence overlay image depicting G/S vector (GFP+) expression in infected RDFs (left), with negligible ALP staining after 3 weeks of culture (right); n > 3 experiments. (B) Fold mRNA changes for indicated genes in GFP vs. GS-overexpressed RDFs. ***p < 0.001, **p < 0.01; n = 3. (C) Representative GFP+ vector expression and ALP staining images in GS-overexpressed HDFs (n > 3). (D) Comparative qRT-PCR analysis of indicated mRNA expressions in HDFs versus HCFs overexpressed with GFP (mock) or G/S factors. ADV: adenovirus; 30/40: MOI numbers for G and S vectors, respectively (n > 2).
Fig. 8
Fig. 8
SALL4 and GATA4 interact to regulate cell transition related genes. (A) Relative fold induction of luciferase expression in transfected 293T cells, reflecting the activity of indicated promoters following SALL4 and/or GATA4 overexpression. Luciferase expression levels were normalized to mock treated conditions; ****p < 0.0001, ***p < 0.001, **p < 0.01, *p < 0.05, n = 3 separate transfection experiments. (B) 293T cells were transfected with indicated plasmids. Expression of HA-tagged proteins following pull-down was validated by Western blotting (i). Co-IP was performed using an anti-HA (ii) or anti-Gata4 antibody (iii) and detected by Western using an anti-Gata4 antibody. Images are cropped from two sets of raw blot data, as outlined in red in Supplementary Figure S9. (C) Representative IF images indicating overlapping distributions of SALL4 (red) and GATA4 (yellow) proteins within the nuclei of transduced RCFs and HCFs. Images were captured using EVOS M5000 microscope at 40× magnification. (D) The upper panels show SALL4-enriched bindings identified from ChIP-ChIP assays on promoter regions of the indicated genes, along with primer designs. Log2 values indicate enrichment of DNA by the target protein. The lower panels present qPCR-amplified DNA levels as relative percentages of input, correlating with the indicated antibodies. Data represent consistent patterns from two ChIP experiments conducted under different conditions.
Fig. 9
Fig. 9
A model for GATA4/SALL4-induced cardiac fibroblast fate transition and cardiac regeneration.

References

    1. Roth, G. A. et al. Global burden of cardiovascular diseases and risk factors, 1990–2019: Update from the GBD 2019 study. J. Am. Coll. Cardiol. 76, 2982–3021. 10.1016/j.jacc.2020.11.010 (2020). - PMC - PubMed
    1. Cahill, T. J., Choudhury, R. P. & Riley, P. R. Heart regeneration and repair after myocardial infarction: translational opportunities for novel therapeutics. Nat. Rev. Drug Discov. 16, 699–717. 10.1038/nrd.2017.106 (2017). - PubMed
    1. Garry, G. A., Bassel-Duby, R. & Olson, E. N. Direct reprogramming as a route to cardiac repair. Semin. Cell. Dev. Biol. 122, 3–13. 10.1016/j.semcdb.2021.05.019 (2022). - PMC - PubMed
    1. Patel, V., Mathison, M., Singh, V. P., Yang, J. & Rosengart, T. K. Direct cardiac cellular reprogramming for cardiac regeneration. Curr. Treat. Options Cardiovasc. Med. 18, 58. 10.1007/s11936-016-0480-8 (2016). - PMC - PubMed
    1. Perveen, S., Vanni, R., Lo Iacono, M., Rastaldo, R. & Giachino, C. Direct reprogramming of resident non-myocyte cells and its potential for in vivo cardiac regeneration. Cells. 12. 10.3390/cells12081166 (2023). - PMC - PubMed

MeSH terms