. 2024 Dec;31(12):1611-1624.
doi: 10.1038/s41418-024-01393-4. Epub 2024 Oct 15.

AKR1B1-dependent fructose metabolism enhances malignancy of cancer cells

Affiliations

AKR1B1-dependent fructose metabolism enhances malignancy of cancer cells

Qing Zhao et al. Cell Death Differ. 2024 Dec.

Abstract

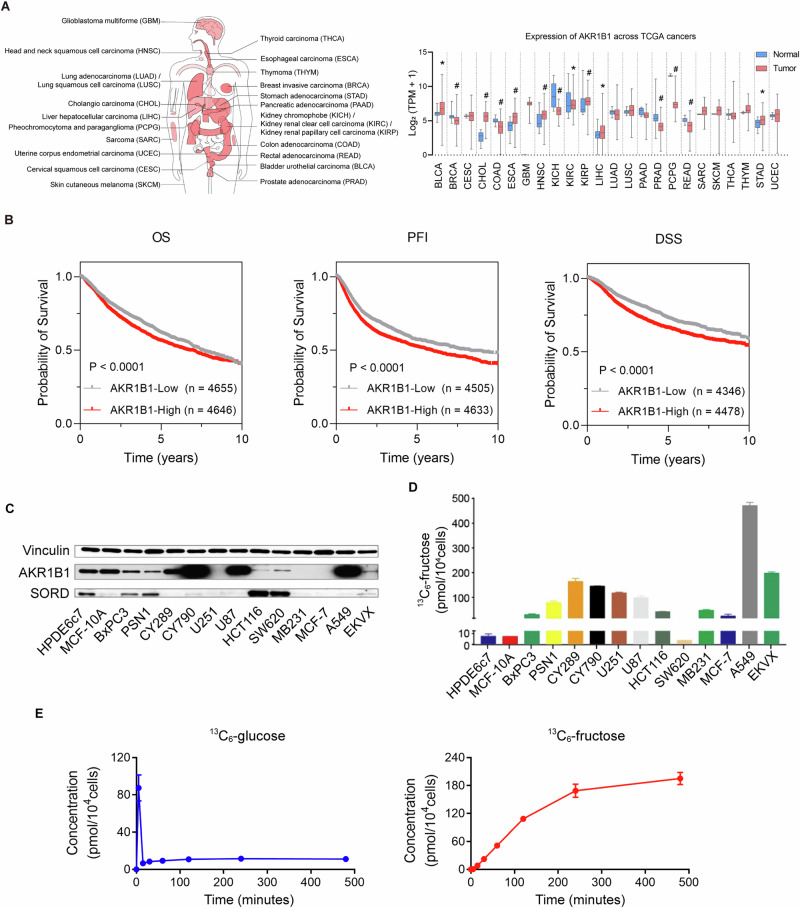
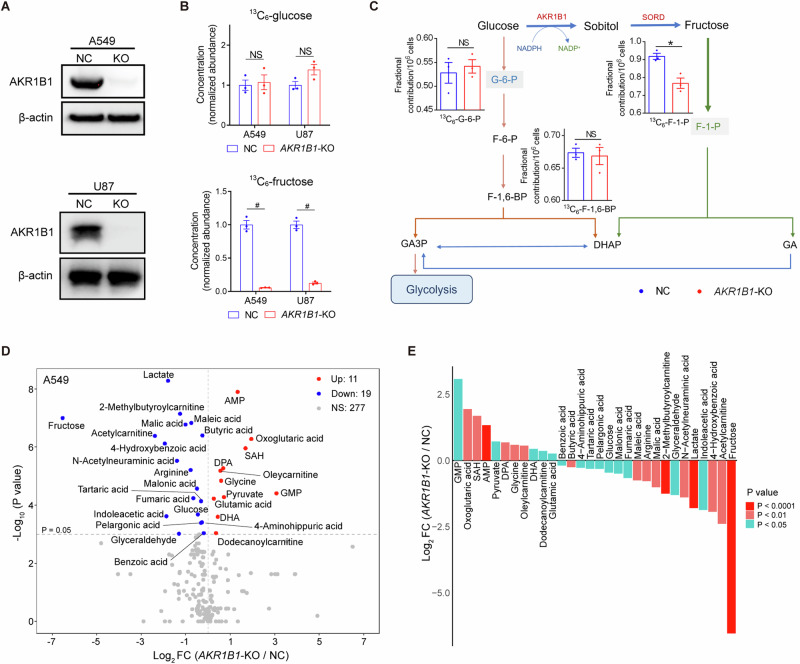
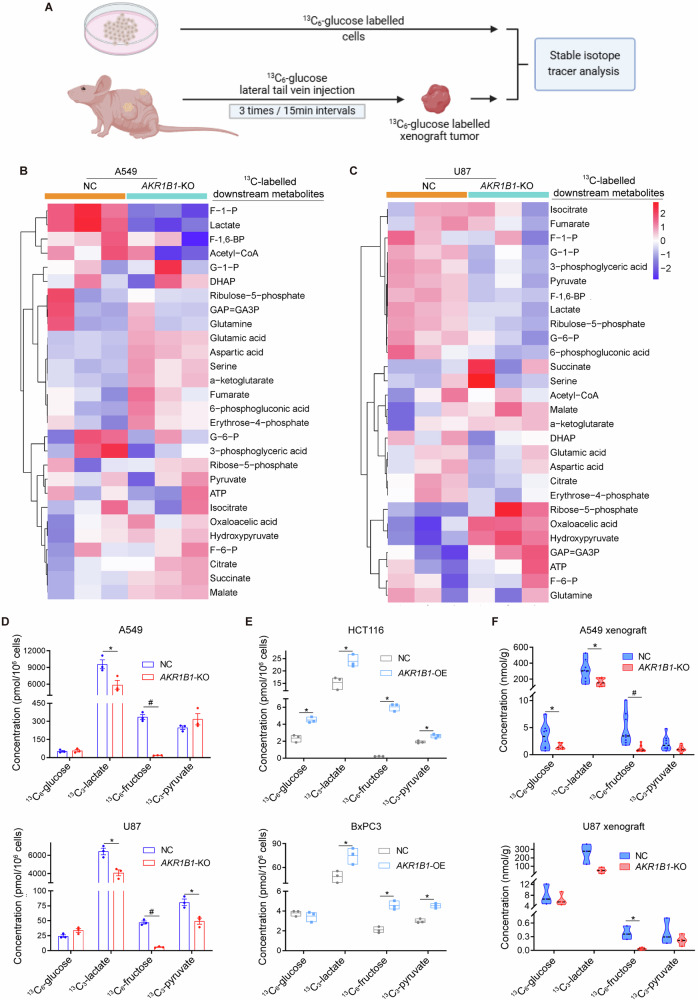
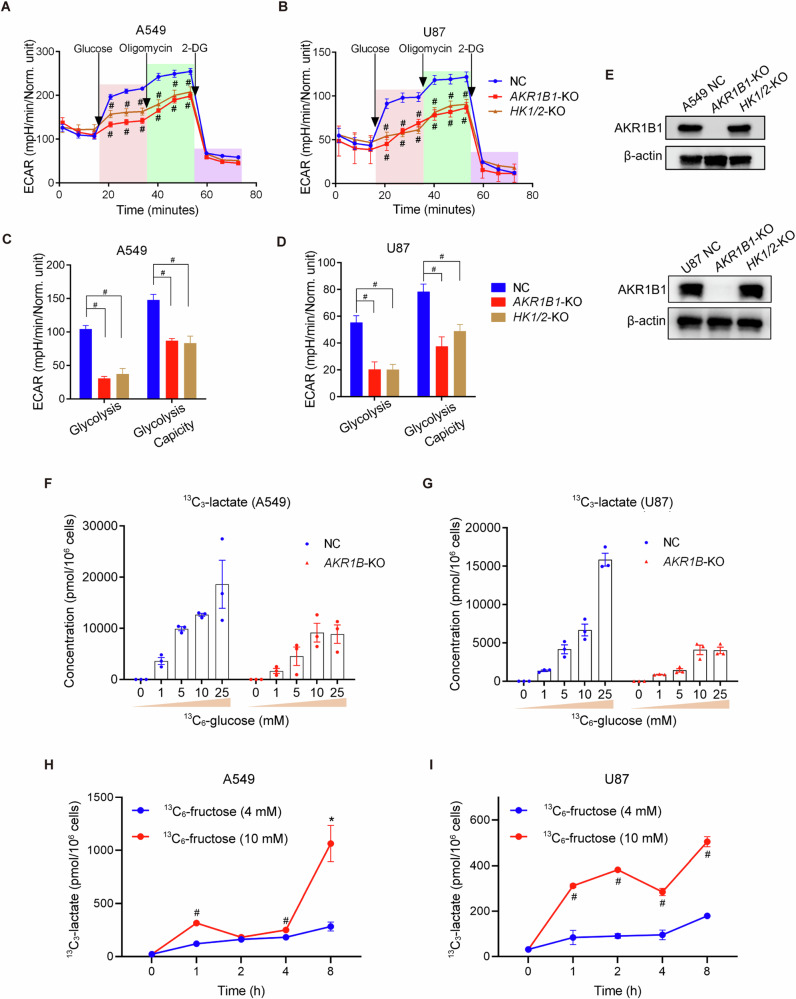
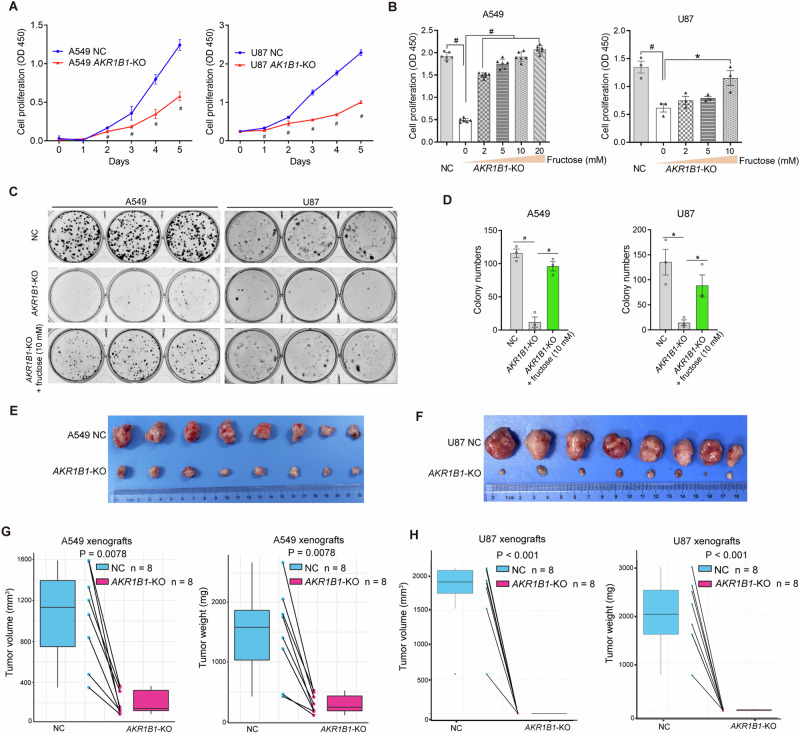
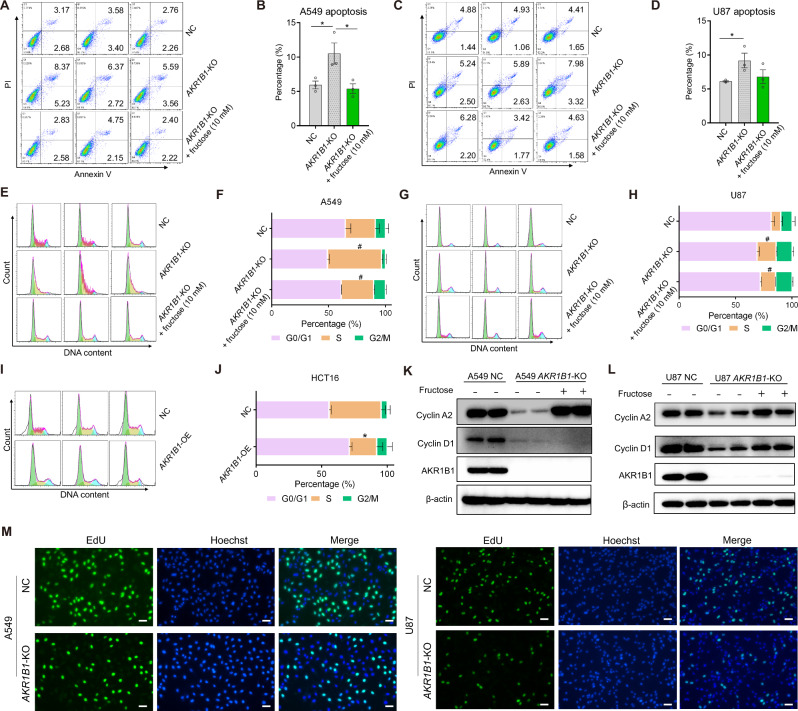
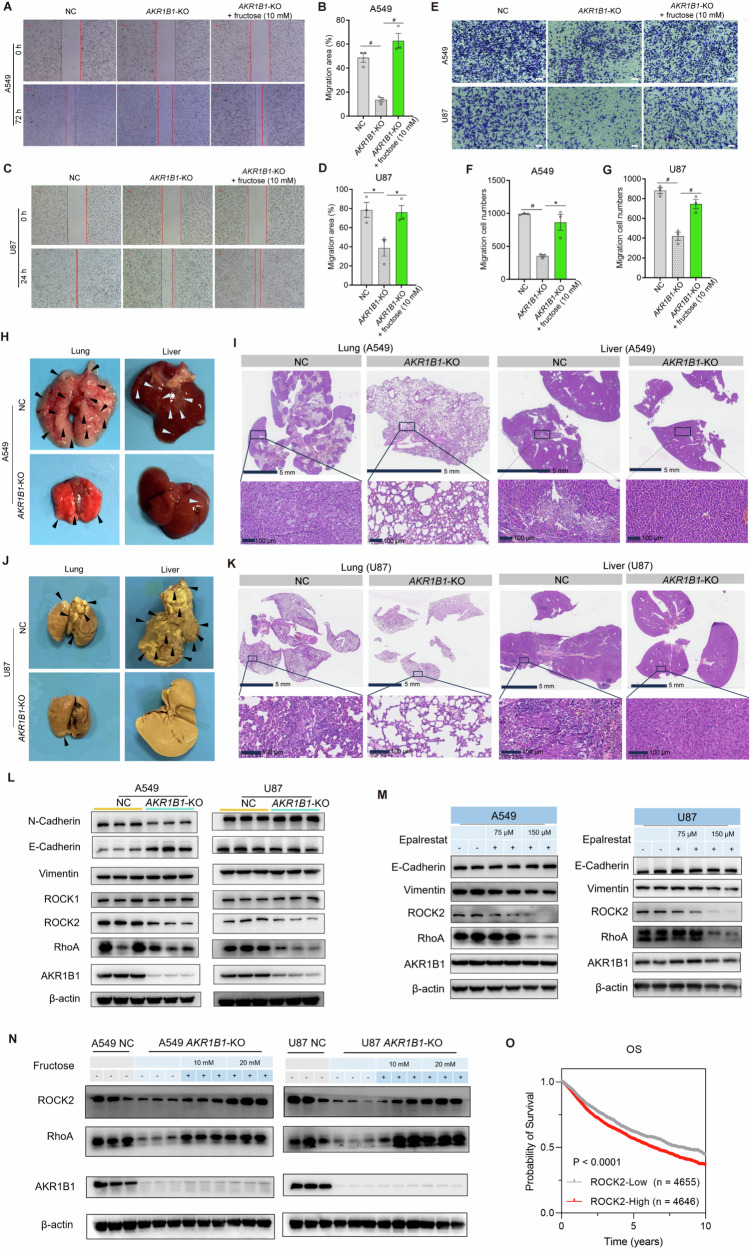
Fructose metabolism has emerged as a significant contributor to cancer cell proliferation, yet the underlying mechanisms and sources of fructose for cancer cells remain incompletely understood. In this study, we demonstrate that cancer cells can convert glucose into fructose through a process called the AKR1B1-mediated polyol pathway. Inhibiting the endogenous production of fructose through AKR1B1 deletion dramatically suppressed glycolysis, resulting in reduced cancer cell migration, inhibited growth, and the induction of apoptosis and cell cycle arrest. Conversely, the acceleration of endogenous fructose through AKR1B1 overexpression has been shown to significantly enhance cancer cell proliferation and migration with increased S cell cycle progression. Our findings highlight the crucial role of endogenous fructose in cancer cell malignancy and support the need for further investigation into AKR1B1 as a potential cancer therapeutic target.


Conflict of interest statement

Competing interests: The authors declare no competing interests.

Figures

Fig. 1
Fig. 1. AKR1B1 was widely expressed in multiple types of cancers and linked to active endogenous fructose biosynthesis in cancer cell lines.
A (Left panel) Cancer types involved in the pan-cancer AKR1B1 expression analysis of the right panel. (Right panel) AKR1B1 expression in multiple cancer tissues and matched normal tissues of cancer patients from TCGA database. B Kaplan-Meier curves depicting OS, PFI and DSS of pan-cancer patients from TCGA database classified by low and high AKR1B1 expression (RNA-seq). OS overall survival, PFI progression-free interval, DSS disease specific survival. C AKR1B1 and SORD were widely expressed in multiple cancer cell lines at protein level. D 13C- fructose production in different tumor cells. The cells were cultured in glucose-free DMEM medium containing 10% dialyzed FBS supplemented with 25 mM 13C-glucose for 24 h, harvested with cell scraping and followed by 13C-fructose quantification. E (Left panel) The 13C-glucose levels in A549 cells cultured in the same medium as (D) at distinct time points. (Right panel) The 13C-fructose production in A549 cells cultured in the same medium as (D) at distinct time points (n = 3). The error bars represent mean ± standard error of the mean (SEM). *: t test P < 0.05; #: t test P < 0.01.
Fig. 2
Fig. 2. AKR1B1-mediated polyol pathway supplied endogenous fructose for cancer cell metabolism.
A The comparison of AKR1B1 protein levels between control cancer cells and cancer cells with AKR1B1-KO. B (Upper panel) AKR1B1-KO had no significant influence on intracellular 13C-glucose content in tested cancer cells. (Lower panel) AKR1B1-KO blocked 13C-fructose production converted from exogenous 13C-glucose in tested cancer cells (n = 3). C A sketch illustrating the impact of AKR1B1-KO in A549 cells on glycolysis and polyol pathway. 13C-glucose was used as an isotope tracer (n = 3). D The volcano plot showing the perturbed metabolites by AKR1B1-KO in A549 cells (n = 3). E The bar graph displaying the differential metabolites triggered by AKR1B1-KO in A549 cells. These metabolites were ranked based on their fold change values and highlighted with different colors according to their P values. FC fold change. Data are represented as mean ± SEM. *: t test P < 0.05; #: t test P < 0.01; NS not significant.
Fig. 3
Fig. 3. AKR1B1-mediated endogenous fructose metabolism contributed to glycolysis in cancer cells both in vitro and in vivo.
A The strategy of establishment of in vitro and in vivo models and implementation of stable isotope tracer investigation in this study. Heatmaps showing the isotope tracing results by using13C-labeled glucose as a tracer in A549 (B) and U87 (C) cells with or without AKR1B1-KO. The cells were cultured in glucose-free DMEM medium containing 10% dialyzed FBS supplemented with 25 mM 13C-glucose for 24 h, harvested with trypsin and followed by metabolic flux analysis (n = 3). D Metabolite quantification for 13C-glucose, 13C-lactate, 13C-fructose, and 13C-pyruvate from A549 and U87 cells with or without AKR1B1-KO. The cell culture method is the same as described in (B) (n = 3). E Metabolite quantification for 13C-glucose, 13C-lactate, 13C-fructose, and 13C-pyruvate from HCT116 and BxPC3 cells with or without AKR1B1 overexpression. The cell culture method is the same as described in (B) (n = 3). F Isotope tracing analysis by using 13C-labeled glucose as a tracer in A549 (n = 8) and U87 (n = 4) xenograft tumors with or without AKR1B1-KO. Data are represented as mean ± SEM. *: t test P < 0.05; #: t test P < 0.01.
Fig. 4
Fig. 4. AKR1B1-mediated endogenous fructose metabolism fueled excessive stimulation of glycolysis.
The Seahorse Cell Glycolysis Stress test showed the compromised glycolysis in AKR1B1-KO cells as well as HK1/2-KO cells of A549 (A) (n = 8) and U87 (B) (NC and HK1/2-KO group: n = 11, AKR1B1-KO: n = 7). Analysis of the glycolysis and glycolysis capacity in A549 (C) and U87 (D) cells by using the data in (A, B). E The comparison of AKR1B1 levels among control, AKR1B1-KO, and HK1/2-KO cells. Measurement of 13C-lactate production under distinct 13C-glucose concentrations in NC and AKR1B1-KO cells of A549 (F) and U87 (G) (n = 3). 13C-lactate production in A549 (H) and U87 (I) cells. The cells were cultured in glucose-free DMEM medium containing 10% dialyzed FBS supplemented with 4 mM or 10 mM 13C-fructose and harvested at different time points (0/1/2/4/8 h) for 13C- lactate quantification (n = 3). Data are represented as mean ± SEM. *: t test P < 0.05; #: t test P < 0.01.
Fig. 5
Fig. 5. AKR1B1-mediated fructose production from glucose played an extremely important role in the proliferation of cancer cells both in vitro and in vivo.
A Impaired proliferation for AKR1B1-KO cells as relative to NC cells. Cells were cultured in high glucose DMEM medium containing 10% FBS (n = 3). B Fructose supplementation recovered the proliferation of AKR1B1-KO cells. Cells were cultured in glucose-free DMEM medium containing 10% dialyzed FBS and 5 mM of glucose, supplemented with the indicated concentration of fructose for 4 days (A549 group: n = 6, U87 group: n = 3). C, D The images showing compromised colony formation in AKR1B1-KO cells, which was rescued by exogenous provision of fructose at 10 mM (C). Bar plots on the right side revealing the quantitative and statistical results (D). Cells were cultured in glucose-free DMEM medium containing 20% dialyzed FBS and 5 mM of glucose. Every 48 h, as indicated, the spent medium was exchanged with fresh media. After 14 days, the cells were fixed by 4% paraformaldehyde and stained with crystal violet for colony formation analysis (n = 3). AKR1B1-KO retarding the expansion of A549 (E) and U87 (F) xenograft tumors (n = 8). The negative impact of AKR1B1-KO on tumor volume and tumor weight of A549 (G) and U87 (H). Data are represented as mean ± SEM. *: t test P < 0.05; #: t test P < 0.01.
Fig. 6
Fig. 6. Glucose-derived fructose mediated by AKR1B1 augmented cancer cell proliferation by hampering cell apoptosis and promoting S cell cycle progression.
AD AKR1B1-KO in A549 and U87 cells inducing cell apoptosis, while exogenous supplement of fructose reversing this phenotype. Quantitative and statistical analysis was exhibited by bar plots (B, D). Cells were cultured in glucose-free DMEM medium containing 10% dialyzed FBS and 5 mM of glucose for 48 h. Cells were then harvested for flow cytometry analysis (n = 3). EH AKR1B1-KO in A549 and U87 cells eliciting S phase arrest, while exogenous supplement of fructose restoring S phase progression. Quantitative and statistical analysis was displayed by stacked bar plots (F, H). A549 and U87 cells were treated as mentioned in (AD) and followed by flow cytometry for cell cycle analysis (n = 3). IJ AKR1B1 overexpression in HCT116 cells expediting S phase progression. Cells cultured in high glucose DMEM medium containing 10% FBS were harvested for cell cycle analysis by flow cytometry (n = 3). KL AKR1B1-KO in A549 and U87 cells downregulating the expression of cyclin A2 and cyclin D1, while exogenous supplement of fructose recovering the expression of these S phase marker proteins. A549 and U87 cells treated as described in (AD) were analyzed by immunoblotting with indicated antibodies. M The EdU incorporation assay showed impaired DNA replication in AKR1B1-KO A549 and U87 cells. Scale bar is 100 μm. Data are represented as mean ± SEM. *: t test P < 0.05; #: t test P < 0.01.
Fig. 7
Fig. 7. AKR1B1-mediated fructose production from glucose enhanced cancer cell migration via RhoA-ROCK2 pathway.
AD AKR1B1-KO in A549 and U87 cells slowing cell migration in the wound healing assay, while exogenous fructose restoring this behavior (n = 3). The wound healing assay was performed by using A549 and U87 cells cultured in glucose-free DMEM medium containing 2% dialyzed FBS and 5 mM of glucose. The spent medium was exchanged every day. EG AKR1B1-KO in A549 and U87 cells impairing cell migratory capability in the transwell assay, while exogenous fructose restoring this capability (E). Quantitative and statistical analysis was manifested by bar plots for A549 (F) and U87 (G). In the transwell assay, cells were seeded in the upper chambers in glucose-free DMEM medium. The lower chamber was filled with glucose-free DMEM medium containing 10% dialyzed FBS and 5 mM of glucose (n = 3). Scale bar is 100 μm. HK The negative influence of AKR1B1-KO on the formation of A549 (HI) and U87 (JK) metastatic nodules in the lungs and livers. The experimental metastasis mouse model was established through venous inoculation of corresponding cancer cells. The metastatic nodules of A549 (I) and U87 (K) cells were reflected by hematoxylin and eosin staining. L Comparative analysis of biomarker proteins involved in EMT and RhoA signal pathway between NC and AKR1B1-KO cells. M The impact of treatment of an AKR1B1 inhibitor, epalrestat, on the expression of biomarker proteins involved in EMT and RhoA signal pathway in A549 and U87 cells. N The rescue effect of exogenous fructose supplementation on the expression of biomarker proteins involved in EMT and RhoA signal pathway in AKR1B1-KO cells. O Kaplan-Meier curves of pan-cancer patients from TCGA database with low and high ROCK2 mRNA expression. Data are represented as mean ± SEM. *: t test P < 0.05; #: t test P < 0.01.

Similar articles

Cited by

References

    1. Goncalves MD, Lu C, Tutnauer J, Hartman TE, Hwang SK, Murphy CJ, et al. High-fructose corn syrup enhances intestinal tumor growth in mice. Science. 2019;363:1345–9. - PMC - PubMed
    1. Chen WL, Wang YY, Zhao A, Xia L, Xie G, Su M, et al. Enhanced fructose utilization mediated by SLC2A5 is a unique metabolic feature of acute myeloid leukemia with therapeutic potential. Cancer cell. 2016;30:779–91. - PMC - PubMed
    1. Chen WL, Jin X, Wang M, Liu D, Luo Q, Tian H, et al. GLUT5-mediated fructose utilization drives lung cancer growth by stimulating fatty acid synthesis and AMPK/mTORC1 signaling. JCI Insight. 2020;5:1–17. - PMC - PubMed
    1. Krause N, Wegner A. Fructose metabolism in cancer. Cells. 2020;9:1–17. - PMC - PubMed
    1. Nomura N, Verdon G, Kang HJ, Shimamura T, Nomura Y, Sonoda Y, et al. Structure and mechanism of the mammalian fructose transporter GLUT5. Nature. 2015;526:397–401. - PMC - PubMed

LinkOut - more resources