. 2024 Nov;16(11):2775-2794.
doi: 10.1038/s44321-024-00153-8. Epub 2024 Oct 15.

Transient CAR T cells with specificity to oncofetal glycosaminoglycans in solid tumors

Affiliations

Transient CAR T cells with specificity to oncofetal glycosaminoglycans in solid tumors

Nastaran Khazamipour et al. EMBO Mol Med. 2024 Nov.

Abstract

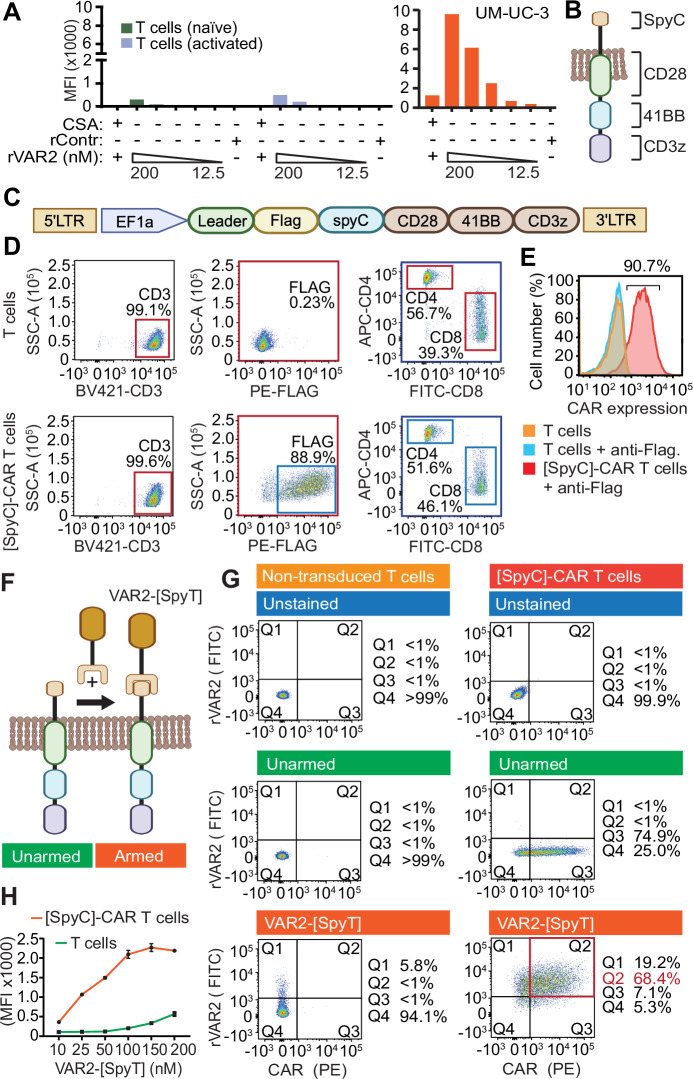
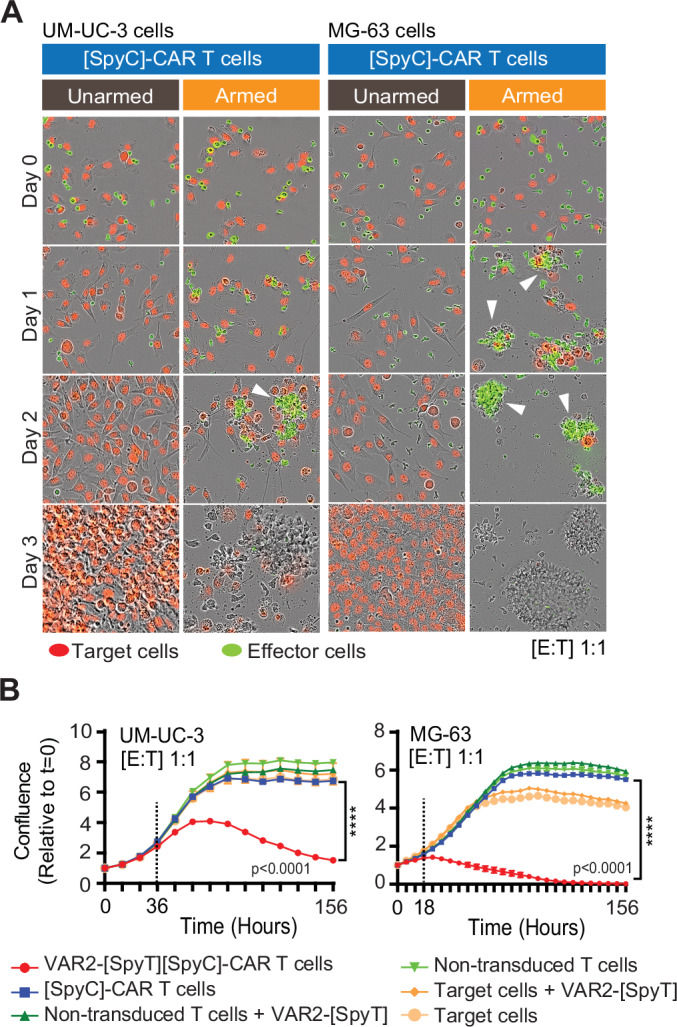
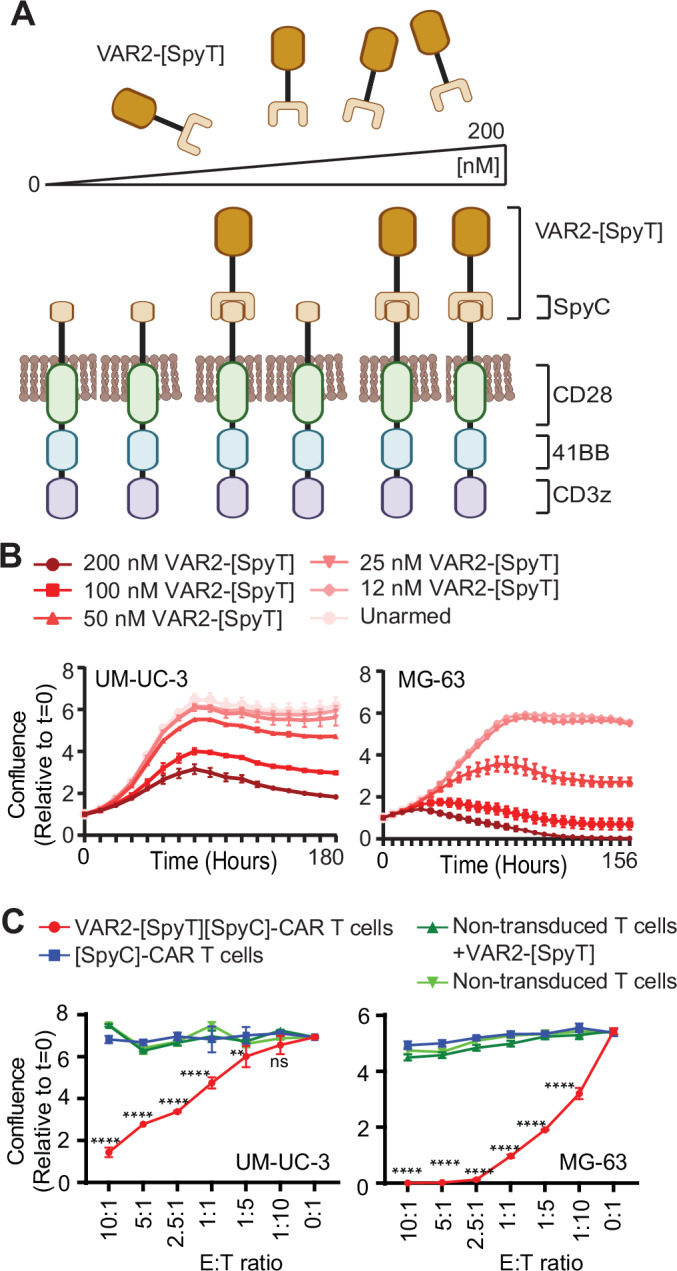
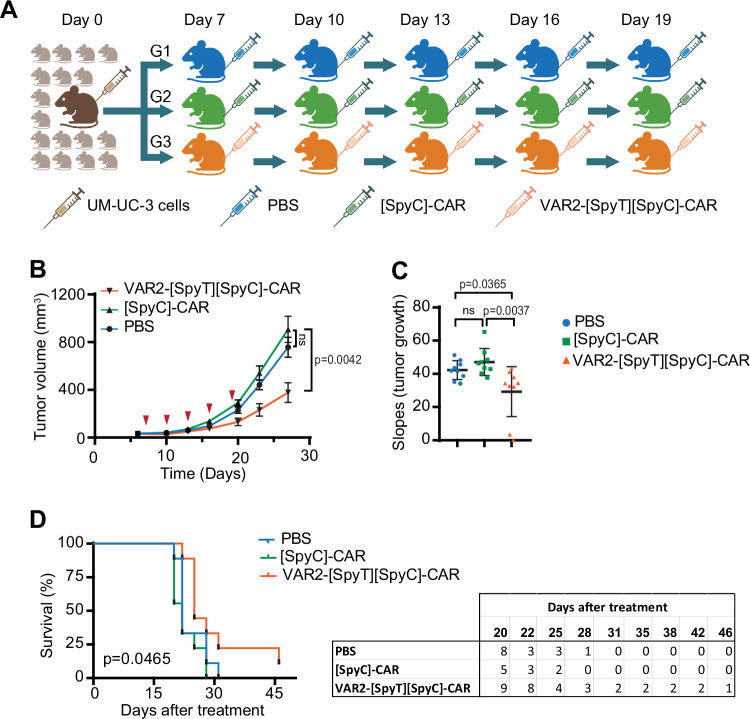
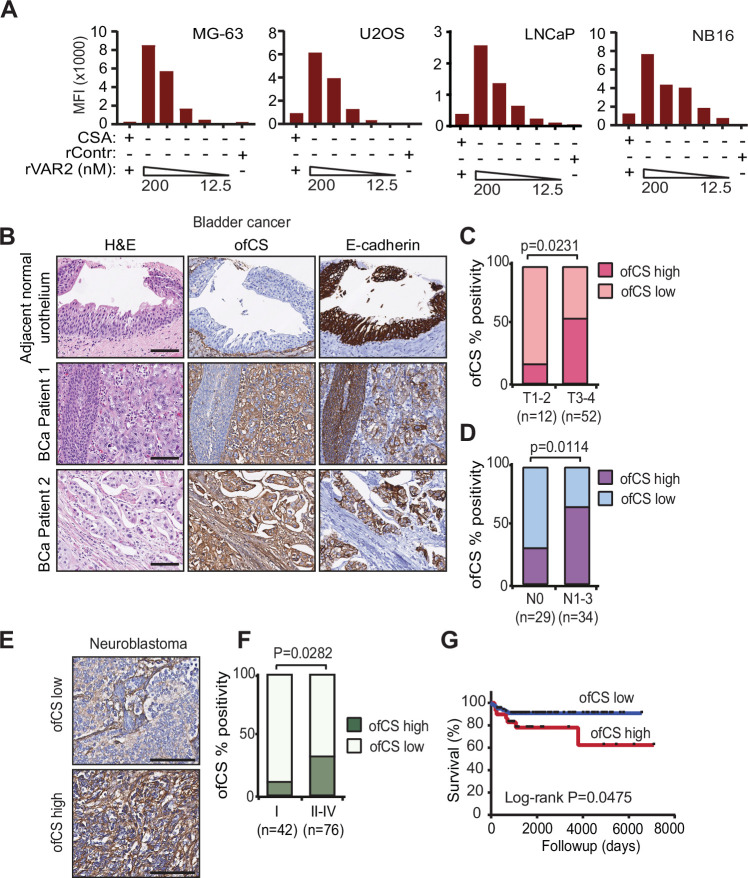
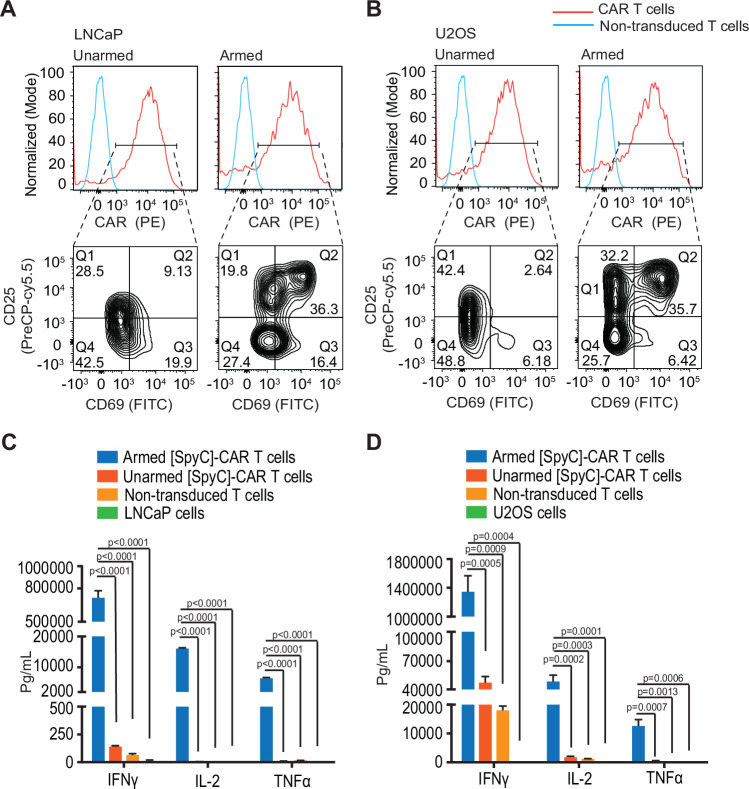
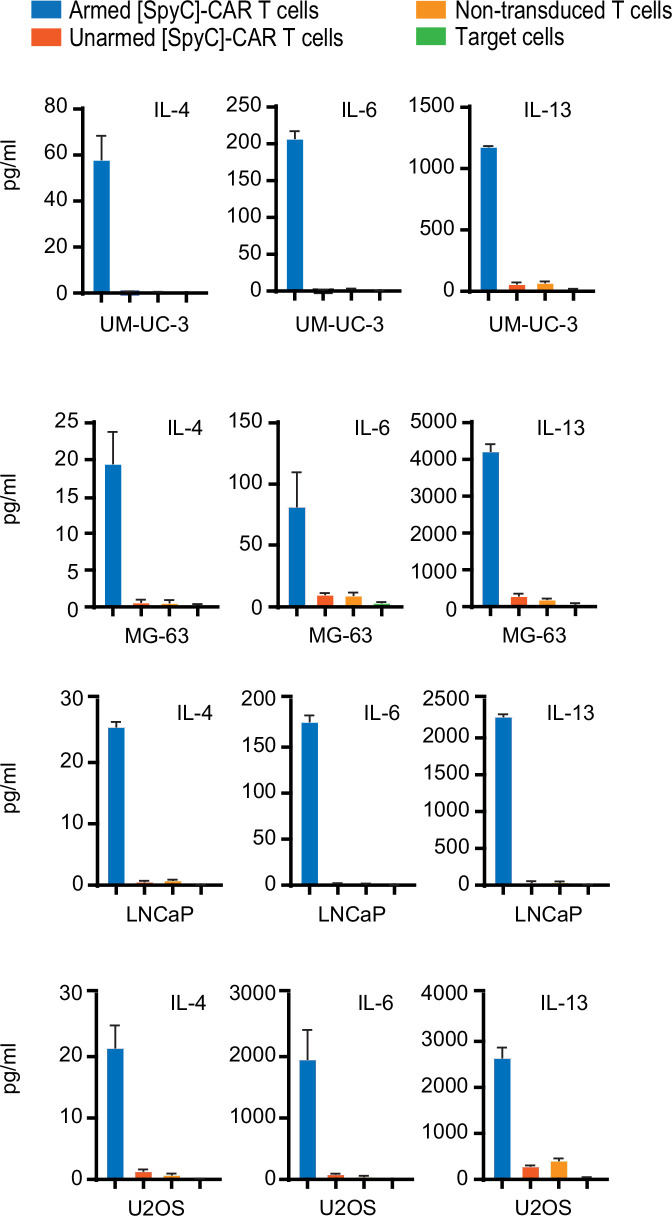
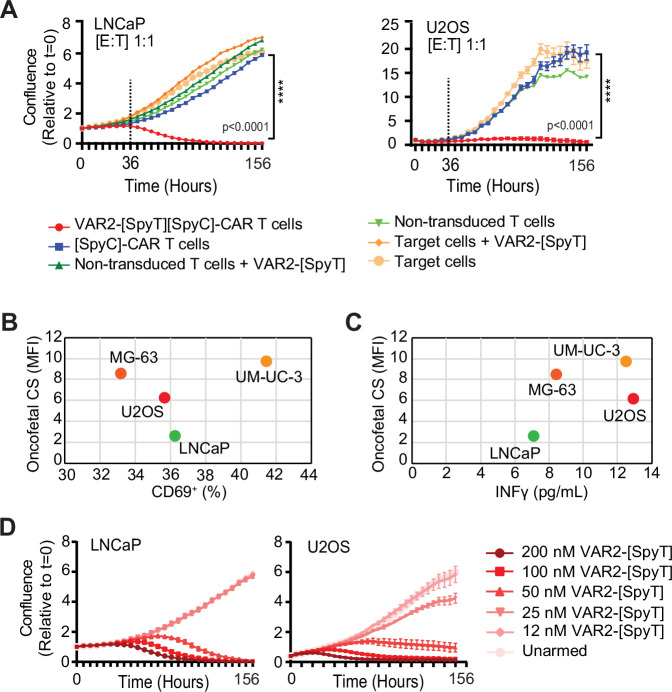
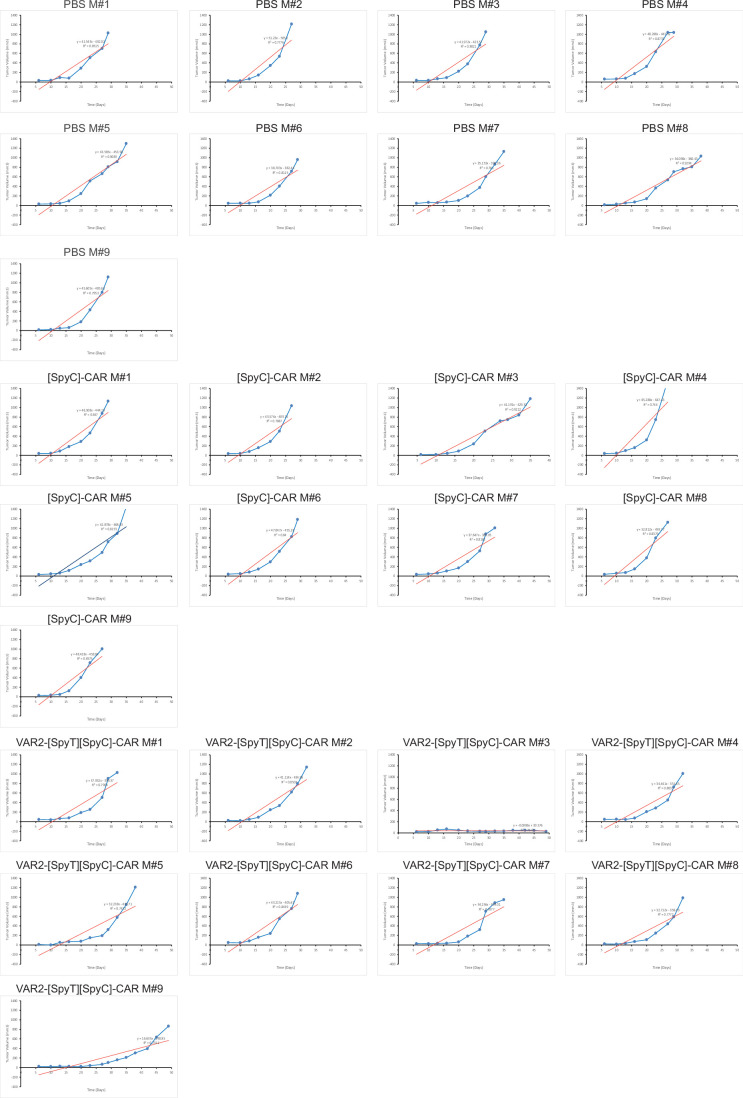
Glycosaminoglycans are often deprioritized as targets for synthetic immunotherapy due to the complexity of glyco-epitopes and limited options for obtaining specific subtype binding. Solid tumors express proteoglycans that are modified with oncofetal chondroitin sulfate (CS), a modification normally restricted to the placenta. Here, we report the design and functionality of transient chimeric antigen receptor (CAR) T cells with selectivity to oncofetal CS. Following expression in T cells, the CAR could be "armed" with recombinant VAR2CSA lectins (rVAR2) to target tumor cells expressing oncofetal CS. While unarmed CAR T cells remained inactive in the presence of target cells, VAR2-armed CAR T cells displayed robust activation and the ability to eliminate diverse tumor cell types in vitro. Cytotoxicity of the CAR T cells was proportional to the concentration of rVAR2 available to the CAR, offering a potential molecular handle to finetune CAR T cell activity. In vivo, armed CAR T cells rapidly targeted bladder tumors and increased the survival of tumor-bearing mice. Thus, our work indicates that cancer-restricted glycosaminoglycans may be exploited as potential targets for CAR T cell therapy.

Keywords: CAR T Cells; Chondroitin Sulfate; Immunotherapy; Oncofetal CS; Solid Tumor.


Conflict of interest statement

Disclosure and competing interests statement MD as the corresponding author certifies that all conflicts of interest, including specific financial interests and relationships and affiliations relevant to the subject matter or materials discussed in the manuscript (e.g., employment/affiliation, grants or funding, consultancies, honoraria, stock ownership or options, expert testimony, royalties, or patents filed, received, or pending), are the following: MD, AS, and PHS are co-founders of, and shareholders in, VAR2 Pharmaceuticals. NAN and TG are consultants for VAR2 Pharmaceuticals. VAR2 Pharmaceuticals is a biotechnology company that specializes in the therapeutic development of the VAR2CSA technology (www.var2pharma.com). The remaining authors declare no competing interests.

Figures

Figure 1
Figure 1. Design and validation of a transient CAR with selectivity to oncofetal CS glycosaminoglycans.
(A) Naive and activated human T cells, and UM-UC3 tumor cells, were incubated with control protein or different concentrations of V5-tagged VAR2 (12–200 nM) protein +/− purified CSA as indicated. Binding of rVAR2 was assessed by flow cytometry using anti-V5-FITC. (B) Illustration of the [SpyC]-CAR containing intracellular CD3zeta, 41BB, and CD28 domains fused with an extracellular split-intein SpyCatcher (SpyC) domain. (C) Schematic diagram of the [SpyC]-CAR DNA construct in a lentiviral plasmid. (D) Isolated human T cells with or without [SpyC]-CAR transduction were analyzed for CD4 and CD8 expression by flow cytometry. (E) [SpyC]-CAR T cells were incubated for 14 days post-transduction and expression of the [SpyC]-CAR (Flag +) was assessed by flow cytometry. The result is representative of three individual donors. (F) Schematic of [SpyC]-CAR T-cell arming with the recombinant VAR2-[SpyT] protein. (G) Expression of the [SpyC]-CAR and arming with VAR2-[SpyT] on T cells were assessed by incubating the cells with zero or 200 nM VAR2-[SpyT] in triplicate, staining for the Flag-tag on [SpyC]-CAR and the V5 tag present on (VAR2-[SpyT]), as detected by flow cytometry. [SpyC]-CAR T cells (right panel) were compared to the non-transduced T cells (left panel). The cells are shown in different conditions, unstained, unarmed and incubated with VAR2-[SpyT]. (H) T cells with or without [SpyC]-CAR transduction were incubated with indicated concentrations of VAR2-[SpyT] protein and analyzed for VAR2-[SpyT][SpyC]-CAR assembly by flow cytometry. Error bars shown are mean ± SEM of triplicate wells. All data are representative of three independent experiments. CSA Chondroitin Sulfate A, rContr recombinant control protein, MFI mean fluorescence intensity. Source data are available online for this figure.
Figure 2
Figure 2. VAR2-armed CAR T cells activate upon target cell engagement and produce robust cytokine responses.
(A, B) Armed and unarmed [SpyC]-CAR T cells were incubated in triplicate with (A) UM-UC-3 and (B) MG-63 cells at a 1:1 E:T ratio for 24 h before analysis for expression of Flag, CD69, and CD25 by flow cytometry. The results are representative of 3 independent experiments. (C, D) Armed and unarmed [SpyC]-CAR T cells were incubated with (C) UM-UC-3 and (D) MG-63 cells at a 10:1 E:T ratio in 100 μl media, for 48 h and concentrations of the indicated cytokines in the supernatants were quantified. Results are presented as mean ± SEM of three different wells. The statistical significance was determined using one-way ANOVA, Dunnett’s multiple comparison’s test. The P value was significant for all comparisons (P < 0.0001). E:T effector-to-target cell ratio. Source data are available online for this figure.
Figure 3
Figure 3. VAR2-[SpyT][SpyC]-CAR Tcell cytotoxicity is target cell type-dependent and does not directly reflect oncofetal CS content.
(A) [SpyC]-CAR T cells (green) +/− VAR2-[SpyT] protein were co-cultured with UM-UC-3 and MG-63 target cells (red) at a 1:1 E:T ratio in triplicate and monitored over 3 days. White arrowheads show the CAR Tcell expansion. (B) Red fluorescent expressing UM-UC-3 and MG-63 target cells were co-cultured with indicated formulations of T cells and the confluency of tumor cells monitored over time. Dashed lines indicate time to VAR2-[SpyT][SpyC]-CAR Tcell cytotoxicity. Error bars represent mean ± SEM of triplicate wells. Data from a representative donor of three individual donors are shown. Statistical analyses were performed at the final timepoint using one-way ANOVA with Dunnett’s multiple comparisons test. For comparisons of VAR2-[SpyT][SpyC]-CAR Tcell cytotoxicity against all other groups in both cell line, the P value was P < 0.0001. E:T effector-to-target cell ratio, MFI mean fluorescence intensity. Source data are available online for this figure.
Figure 4
Figure 4. [SpyC]-CAR T cells can be transiently armed with VAR2-[SpyT] to eliminate tumor cells.
(A) Illustration of the transient arming of [SpyC]-CAR T cells with increasing amounts of VAR2-[SpyT] protein. (B) UM-UC-3 and MG-63 target cells (red) were co-cultured with [SpyC]-CAR T cells at a 1:1 E:T ratio in triplicate with the indicated concentrations of VAR2-[SpyT] protein, and assessed for changes in confluence as a readout for tumor cell viability. Error bars represent mean ± SEM of triplicates. (C) UM-UC-3 and MG-63 target cells (red) were co-cultured with [SpyC]-CAR T cells +/− VAR2-[SpyT] in indicated E:T ratios and analyzed as in (B). Data from of three individual donors are shown. Results are presented as mean ± SEM of triplicates. Statistics were calculated using two-way ANOVA and Dunnett’s multiple comparisons test. CAR T cells killed UM-UC-3 cells at E:T ratios ranging from 10:1 to 1:1, with a P value of P < 0.0001, and at a 1:5 ratio with P < 0.0095. No significant difference was observed at the lower concentration (1:10). In MG-63 cells, statistical significance was observed for all E:T ratios from 10:1 to 1:10, with P < 0.0001. E:T effector-to-target cell ratio. Source data are available online for this figure.
Figure 5
Figure 5. VAR2-CAR T cells suppress solid tumor growth in vivo and prolong animal survival.
(A) Schematic outline of the experimental design. Nude mice were inoculated with 1 × 106 UM-UC-3 tumor cells in their right flank. At day 7, the mice were divided into three groups (n = 9). The groups subsequently received five doses of either PBS (G1), 2.5 million [SpyC]-CAR T cells (G2), and 2.5 million VAR2-[SpyT][SpyC]-CAR T cells (G3) by intravenous injection at the indicated time points post-tumor cell inoculation. (B) Tumor growth curves with the mean tumor volumes of mice in each group. Two-way ANOVA followed by a Tukey’s multiple comparisons test used to calculate the difference between groups. Data presented as mean ± SEM (n = 9 mice). (C) The slope of tumor growth curve for each individual mouse in each group was calculated using linear regression, and the tumor growth rate was compared between treatment groups. The statistical analysis was performed using ANOVA followed by a Tukey’s multiple comparison’s test. Error bars represent the mean ± standard deviation of the mean (SDM) for tumor slope data from 9 mice. (D) Kaplan–Meier plot (left) indicates morbidity as a proxy for overall survival of mice (numbers of mice) over time (right). Statistical differences between survival curves were analyzed using the log-rank (Mantel–Cox) test. Source data are available online for this figure.
Figure EV1
Figure EV1. Oncofetal CS expression in solid tumor cell lines and bladder cancer tissue.
(A) MG-63, U2OS, LNCaP, and NB16 tumor cell lines were incubated with indicated concentrations of rContr protein or VAR2 (12–200 nM) +/− purified CSA and analyzed by flow cytometry using anti-V5-FITC. (B) Representative H&E and IHC images of normal adjacent urothelium and bladder cancer tissues from two patients. Matched staining images of E-cadherin, as an epithelial marker, in parallel with oncofetal CS (ofCS) detection by VAR2 and anti-V5. (C) Bar plot of bladder cancer patient tumors (n = 64) indicating ofCS expression in relation to T stage. (D) Bar plot of bladder cancer patient tumors (n = 63) indicating ofCS expression in relation to N stage. (E) Representative IHC images of neuroblastoma tumors selected for high and low oncofetal CS expression. (F) Percent ofCS-positive neuroblastoma tumors related to tumor stage. (G) Kaplan–Meier plot indicating overall survival of neuroblastoma patients related to oncofetal CS expression. The scale bar represents 100 μm. MIBC: muscle-invasive bladder cancer; oncofetal CS: oncofetal chondroitin sulfate. For statistical analysis in the above panels (C: T stage; D: N stage and F: International Neuroblastoma Staging System (INSS)), two-tailed Fisher’s exact test was used. MFI Mean Fluorescence Intensity, CSA chondroitin sulfate A, OfCS Oncofetal Chondroitin Sulfate.
Figure EV2
Figure EV2. Activation of VAR2-[SpyT][SpyC]-CAR T cells upon tumor cell engagement.
(A, B) Armed and unarmed [SpyC]-CAR T cells were incubated with (A) LNCaP and (B) U2OS cells at a 1:1 E:T ratio for 24 h before analyzed for Flag, CD69, and CD25 expression by flow cytometry. The results are representative of 3 independent experiments. (C, D) Armed and unarmed [SpyC]-CAR T cells were incubated in triplicate, with (C) LNCaP and (D) U2OS cells at a 10:1 E:T ratio in 100 μl media, for 48 h and analyzed for the concentration of indicated cytokines in the culture supernatant. Results are presented as mean ± SEM of three different wells. The statistical significance was determined using one-way ANOVA followed by Dunnett’s multiple comparison’s test; P values for each comparison are indicated in the figure. E:T effector-to-target cell ratio.
Figure EV3
Figure EV3. Cytokine responses in co-cultures of effector and target cells.
The concentrations of the indicated cytokines in the culture supernatants were assessed after 48 h of co-culturing between effector T cells formulations and different target cells (i.e., UM-UC3, MG-63, LNCaP, and U2OS), at a 10:1 E:T ratio. Data was analyzed with the Discovery Workbench software. Error bars represent mean ± SEM of three different wells. E:T effector-to-target cell ratio.
Figure EV4
Figure EV4. Activity of VAR2-[SpyT][SpyC]-CAR T cells after target cell engagement.
(A) LNCaP and U2OS target cells (red) were co-cultured in triplicate with indicated formulations of T cells and monitored for one week. Dashed lines indicate time to VAR2-[SpyT][SpyC]-CAR T-cell cytotoxicity. Error bars represent mean ± SEM of triplicate wells. Data from a representative donor of three individual donors is shown. Statistical analyses were performed at the final timepoint using one-way ANOVA with Dunnett’s multiple comparisons test. The cytotoxicity of VAR2-[SpyT][SpyC]-CAR T cells compared to all other groups in both target cell lines showed a P value of P < 0.0001. (B) Percent CD69-positive VAR2-[SpyT][SpyC]-CAR T cells plotted against oncofetal CS expression in indicated target cells. (C) IFNγ production (pg/ml) in co-cultures of VAR2-[SpyT][SpyC]-CAR T cells and indicated target cells plotted against oncofetal CS expression of the target cells. All data was analyzed by GraphPad Prism Software. (D) LNCaP and U2OS target cells (red) were co-cultured with [SpyC]-CAR T cells at a 1:1 E:T ratio with indicated concentrations of VAR2-[SpyT] protein and analyzed for viability using confluence as the readout. Error bars represent mean ± SEM of triplicate wells. E:T effector-to-target cell ratio, MFI Mean Fluorescence Intensity.
Figure EV5
Figure EV5. Linear regression analysis of tumor growth.
Individual tumor growth curve (blue line) and the slope of the curve (red line) is shown for each mouse treated with PBS, [SpyC]-CAR T cells or VAR2-[SpyT][SpyC]-CAR T cells.

Similar articles

References

    1. Abbas Y, Turco MY, Burton GJ, Moffett A (2020) Investigation of human trophoblast invasion in vitro. Hum Reprod Update 26:501–513 - PMC - PubMed
    1. Agerbaek MO, Bang-Christensen SR, Yang MH, Clausen TM, Pereira MA, Sharma S, Ditlev SB, Nielsen MA, Choudhary S, Gustavsson T et al (2018) The VAR2CSA malaria protein efficiently retrieves circulating tumor cells in an EpCAM-independent manner. Nat Commun 9:3279 - PMC - PubMed
    1. Agerbaek MO, Pereira MA, Clausen TM, Pehrson C, Oo HZ, Spliid C, Rich JR, Fung V, Nkrumah F, Neequaye J et al (2017) Burkitt lymphoma expresses oncofetal chondroitin sulfate without being a reservoir for placental malaria sequestration. Int J Cancer 140:1597–1608 - PMC - PubMed
    1. Albelda SM (2024) ‘CAR T cell therapy for patients with solid tumours: key lessons to learn and unlearn’. Nat Rev Clin Oncol 21:47–66 - PubMed
    1. Al-Nakouzi N, Wang CK, Oo HZ, Nelepcu I, Lallous N, Spliid CB, Khazamipour N, Lo J, Truong S, Collins C et al (2022) Reformation of the chondroitin sulfate glycocalyx enables progression of AR-independent prostate cancer. Nat Commun 13:4760 - PMC - PubMed

MeSH terms

LinkOut - more resources