

Appearance time of blood in the brain as a possible indicator of oxygen extraction fraction: a feasibility study
- PMID: 39406936
- PMCID: PMC11480264
- DOI: 10.1186/s13550-024-01160-z
Appearance time of blood in the brain as a possible indicator of oxygen extraction fraction: a feasibility study
Abstract
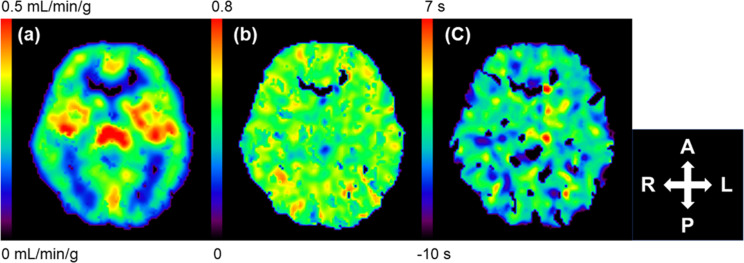
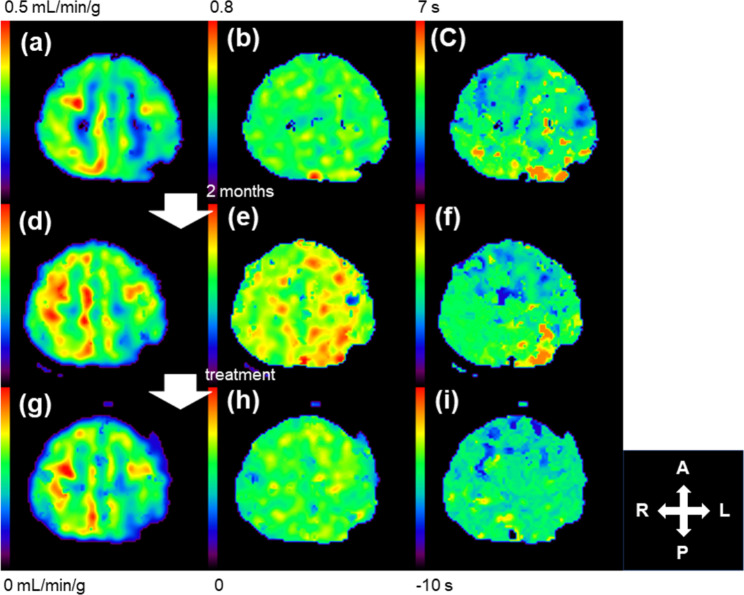
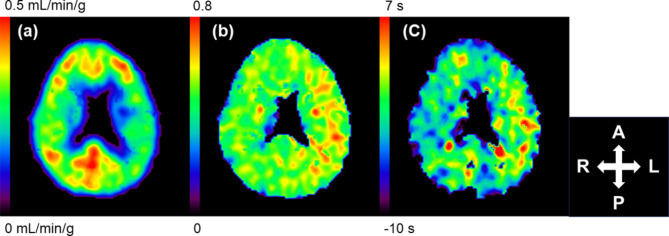
Background: Imaging examination of cerebral blood flow (CBF), oxygen extraction fraction (OEF), and metabolic rate of oxygen is crucial for understanding the normal functioning and pathophysiology of the brain. A recently developed method estimates the appearance time of cerebral blood (ATB) pixel-wise from the imaging examination of CBF alone. In this study, we aimed to test the potential of ATB as an indicator of OEF.
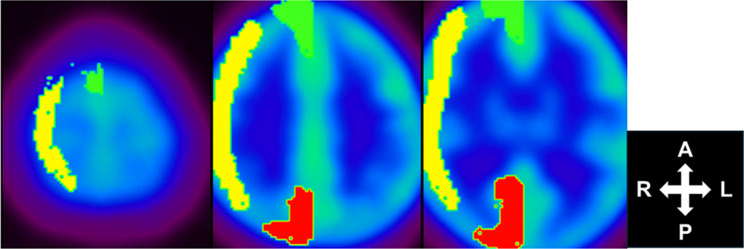
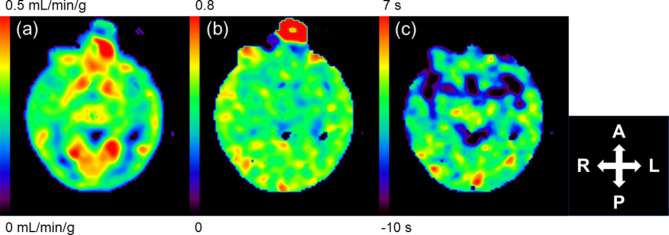
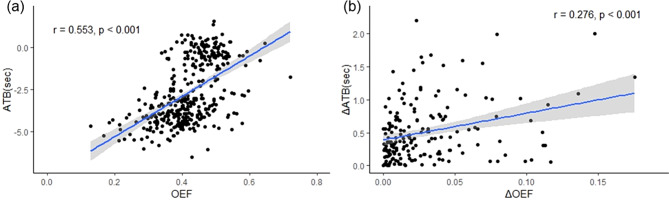
Results: We retrospectively reviewed patients (n = 62) with suspected cerebrovascular disorders including steno-occlusive disease who underwent positron emission tomography (PET) with 15O-labelled tracers. Regarding the generated OEF and ATB images, a visual assessment was performed to test the consistency of the elevated OEF and delayed ATB. The OEF and ATB values and the absolute differences between their ipsilateral and contralateral sides were extracted and obtained for the entire hemisphere and the middle, anterior, and posterior cerebral arterial regions. Consistency was observed in 52 PET scans (83.9%) in visual assessment. The OEF and ATB values were moderately correlated (r = 0.553, p < 0.001), and the differences between their ipsilateral and contralateral sides were weakly correlated (r = 0.276, p < 0.001).
Conclusion: Our results indicate the potential of ATB as an indicator of OEF.
Keywords: 15O-labelled tracer; Appearance time of blood; Cerebral blood flow; Oxygen extraction fraction; Positron emission tomography.
© 2024. The Author(s).
Conflict of interest statement
The authors declare no competing interests.
Figures
References
-
- Mintun MA, Raichle ME, Martin WR, Herscovitch P. Brain oxygen utilization measured with O-15 radiotracers and positron emission tomography. J Nucl Med. 1984;25:177–87. - PubMed
-
- Hatazawa J, Fujita H, Kanno I, Satoh T, Iida H, Miura S, Murakami M, Okudera T, Inugami A, Ogawa T, et al. Regional cerebral blood flow, blood volume, oxygen extraction fraction, and oxygen utilization rate in normal volunteers measured by the autoradiographic technique and the single breath inhalation method. Ann Nucl Med. 1995;9:15–21. - DOI - PubMed
-
- Shidahara M, Watabe H, Kim KM, Oka H, Sago M, Hayashi T, Miyake Y, Ishida Y, Hayashida K, Nakamura T, Iida H. Evaluation of a commercial PET tomograph-based system for the quantitative assessment of rCBF, rOEF and rCMRO2 by using sequential administration of 15O-labelled compounds. Ann Nucl Med. 2002;16:317–27. - DOI - PubMed
-
- Kudomi N, Hayashi T, Teramoto N, Watabe H, Kawachi N, Ohta Y, Kim KM, Iida H. Rapid quantitative measurement of CMRO2 and CBF by dual administration of 15O-labeled oxygen and water during a single PET scan-a validation study and error analysis in anesthetized monkeys. J Cereb Blood Flow Metab. 2005;25:1209–24. - DOI - PubMed
Grants and funding
LinkOut - more resources
Full Text Sources
