. 2024 Dec;27(12):2521-2537.
doi: 10.1038/s41593-024-01764-7. Epub 2024 Oct 15.

A cross-disease resource of living human microglia identifies disease-enriched subsets and tool compounds recapitulating microglial states

Affiliations

A cross-disease resource of living human microglia identifies disease-enriched subsets and tool compounds recapitulating microglial states

John F Tuddenham et al. Nat Neurosci. 2024 Dec.

Abstract

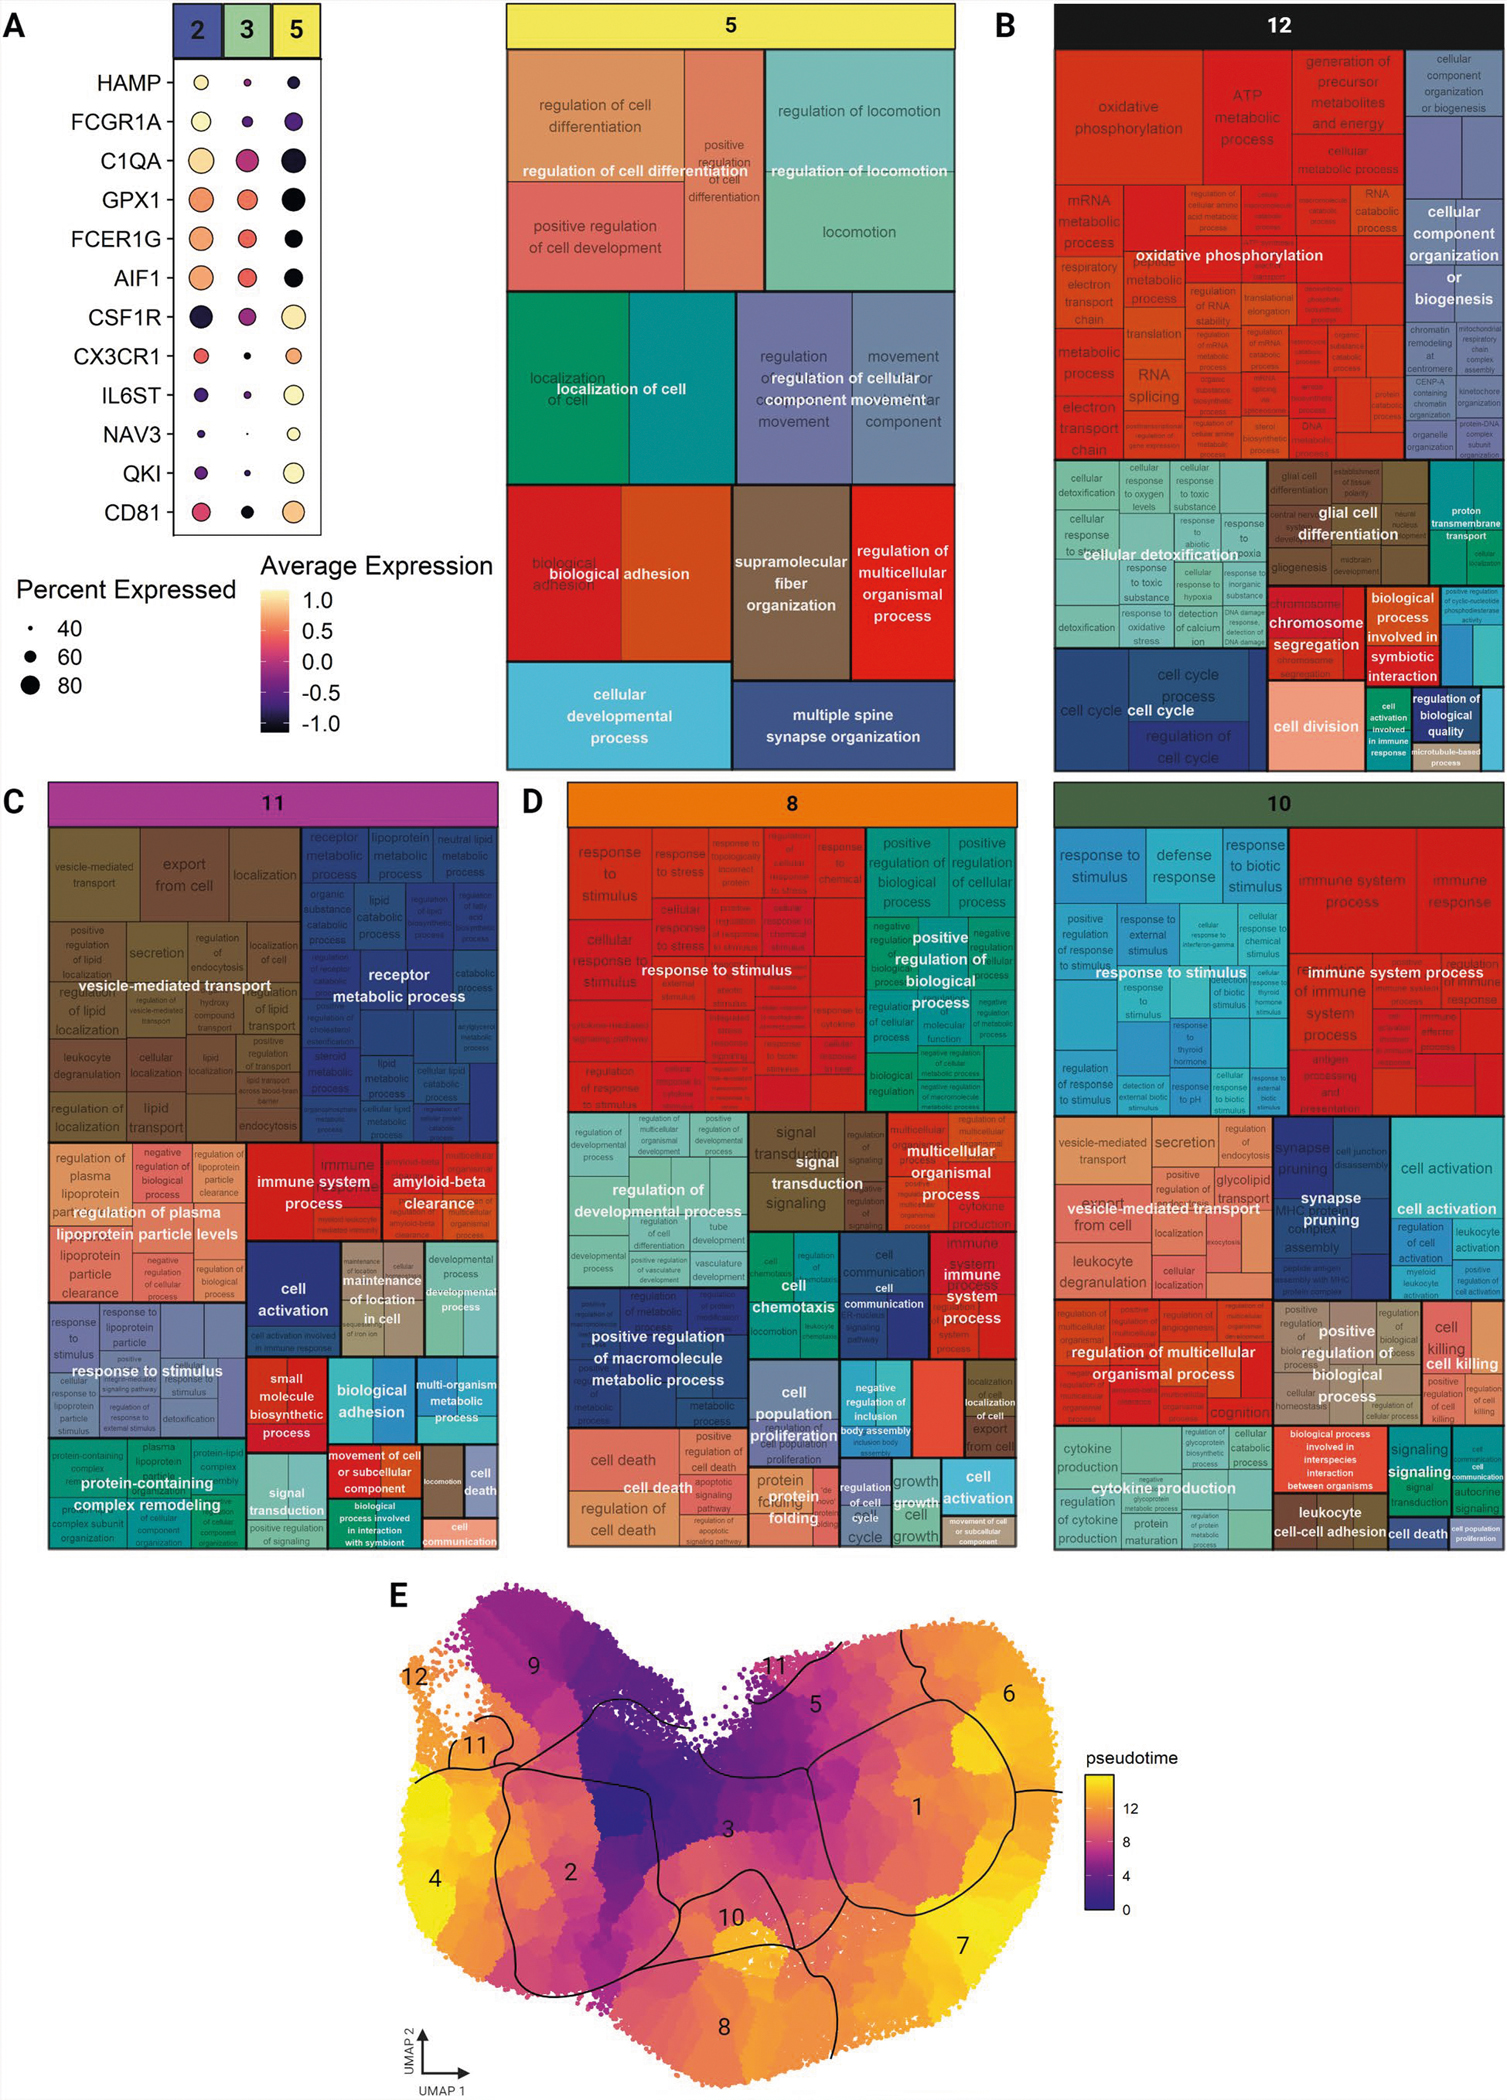
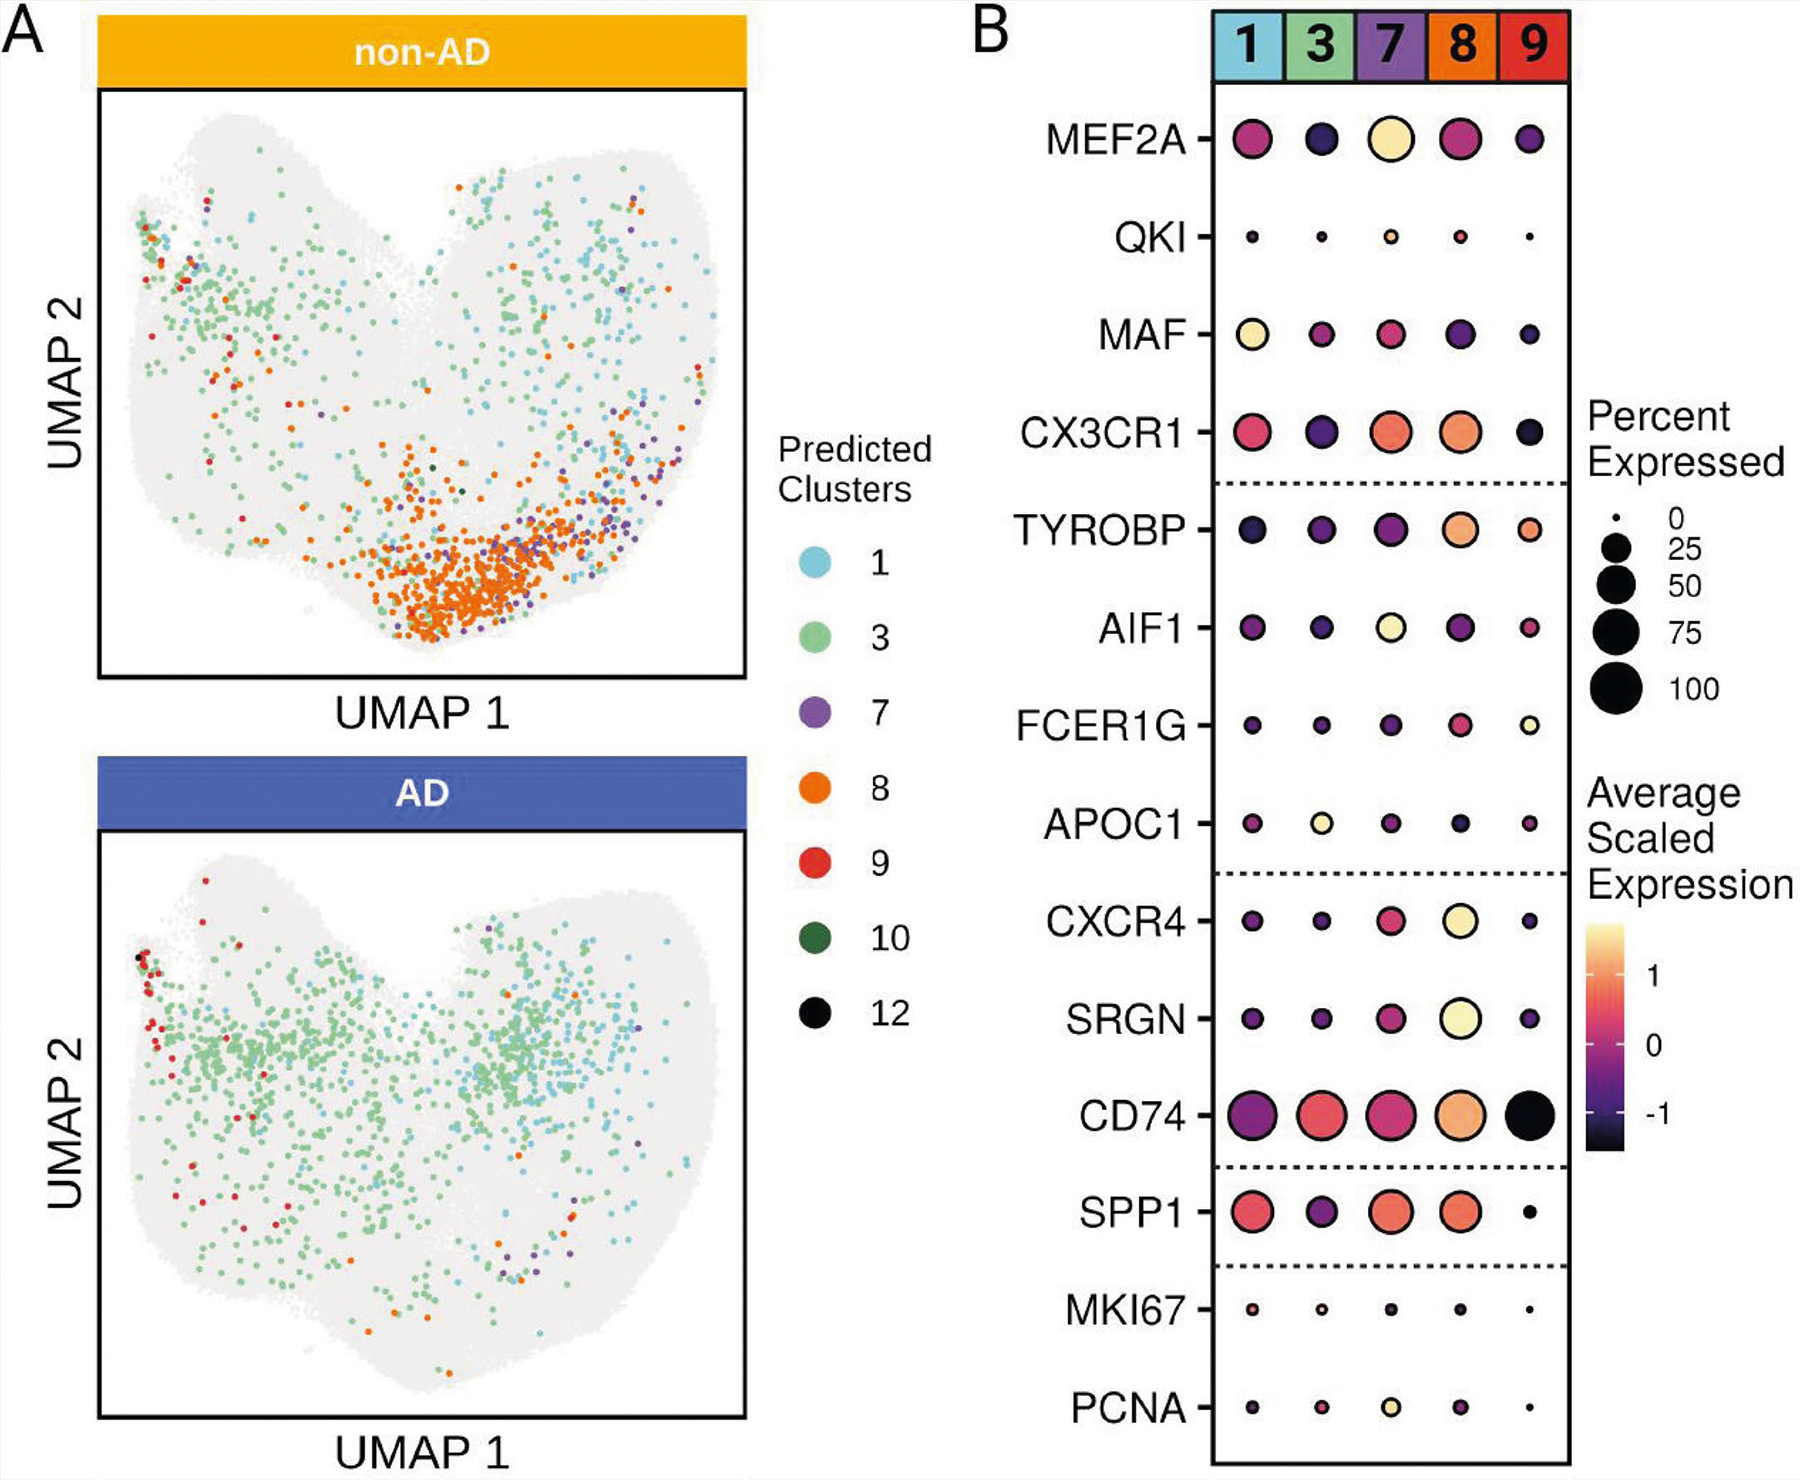
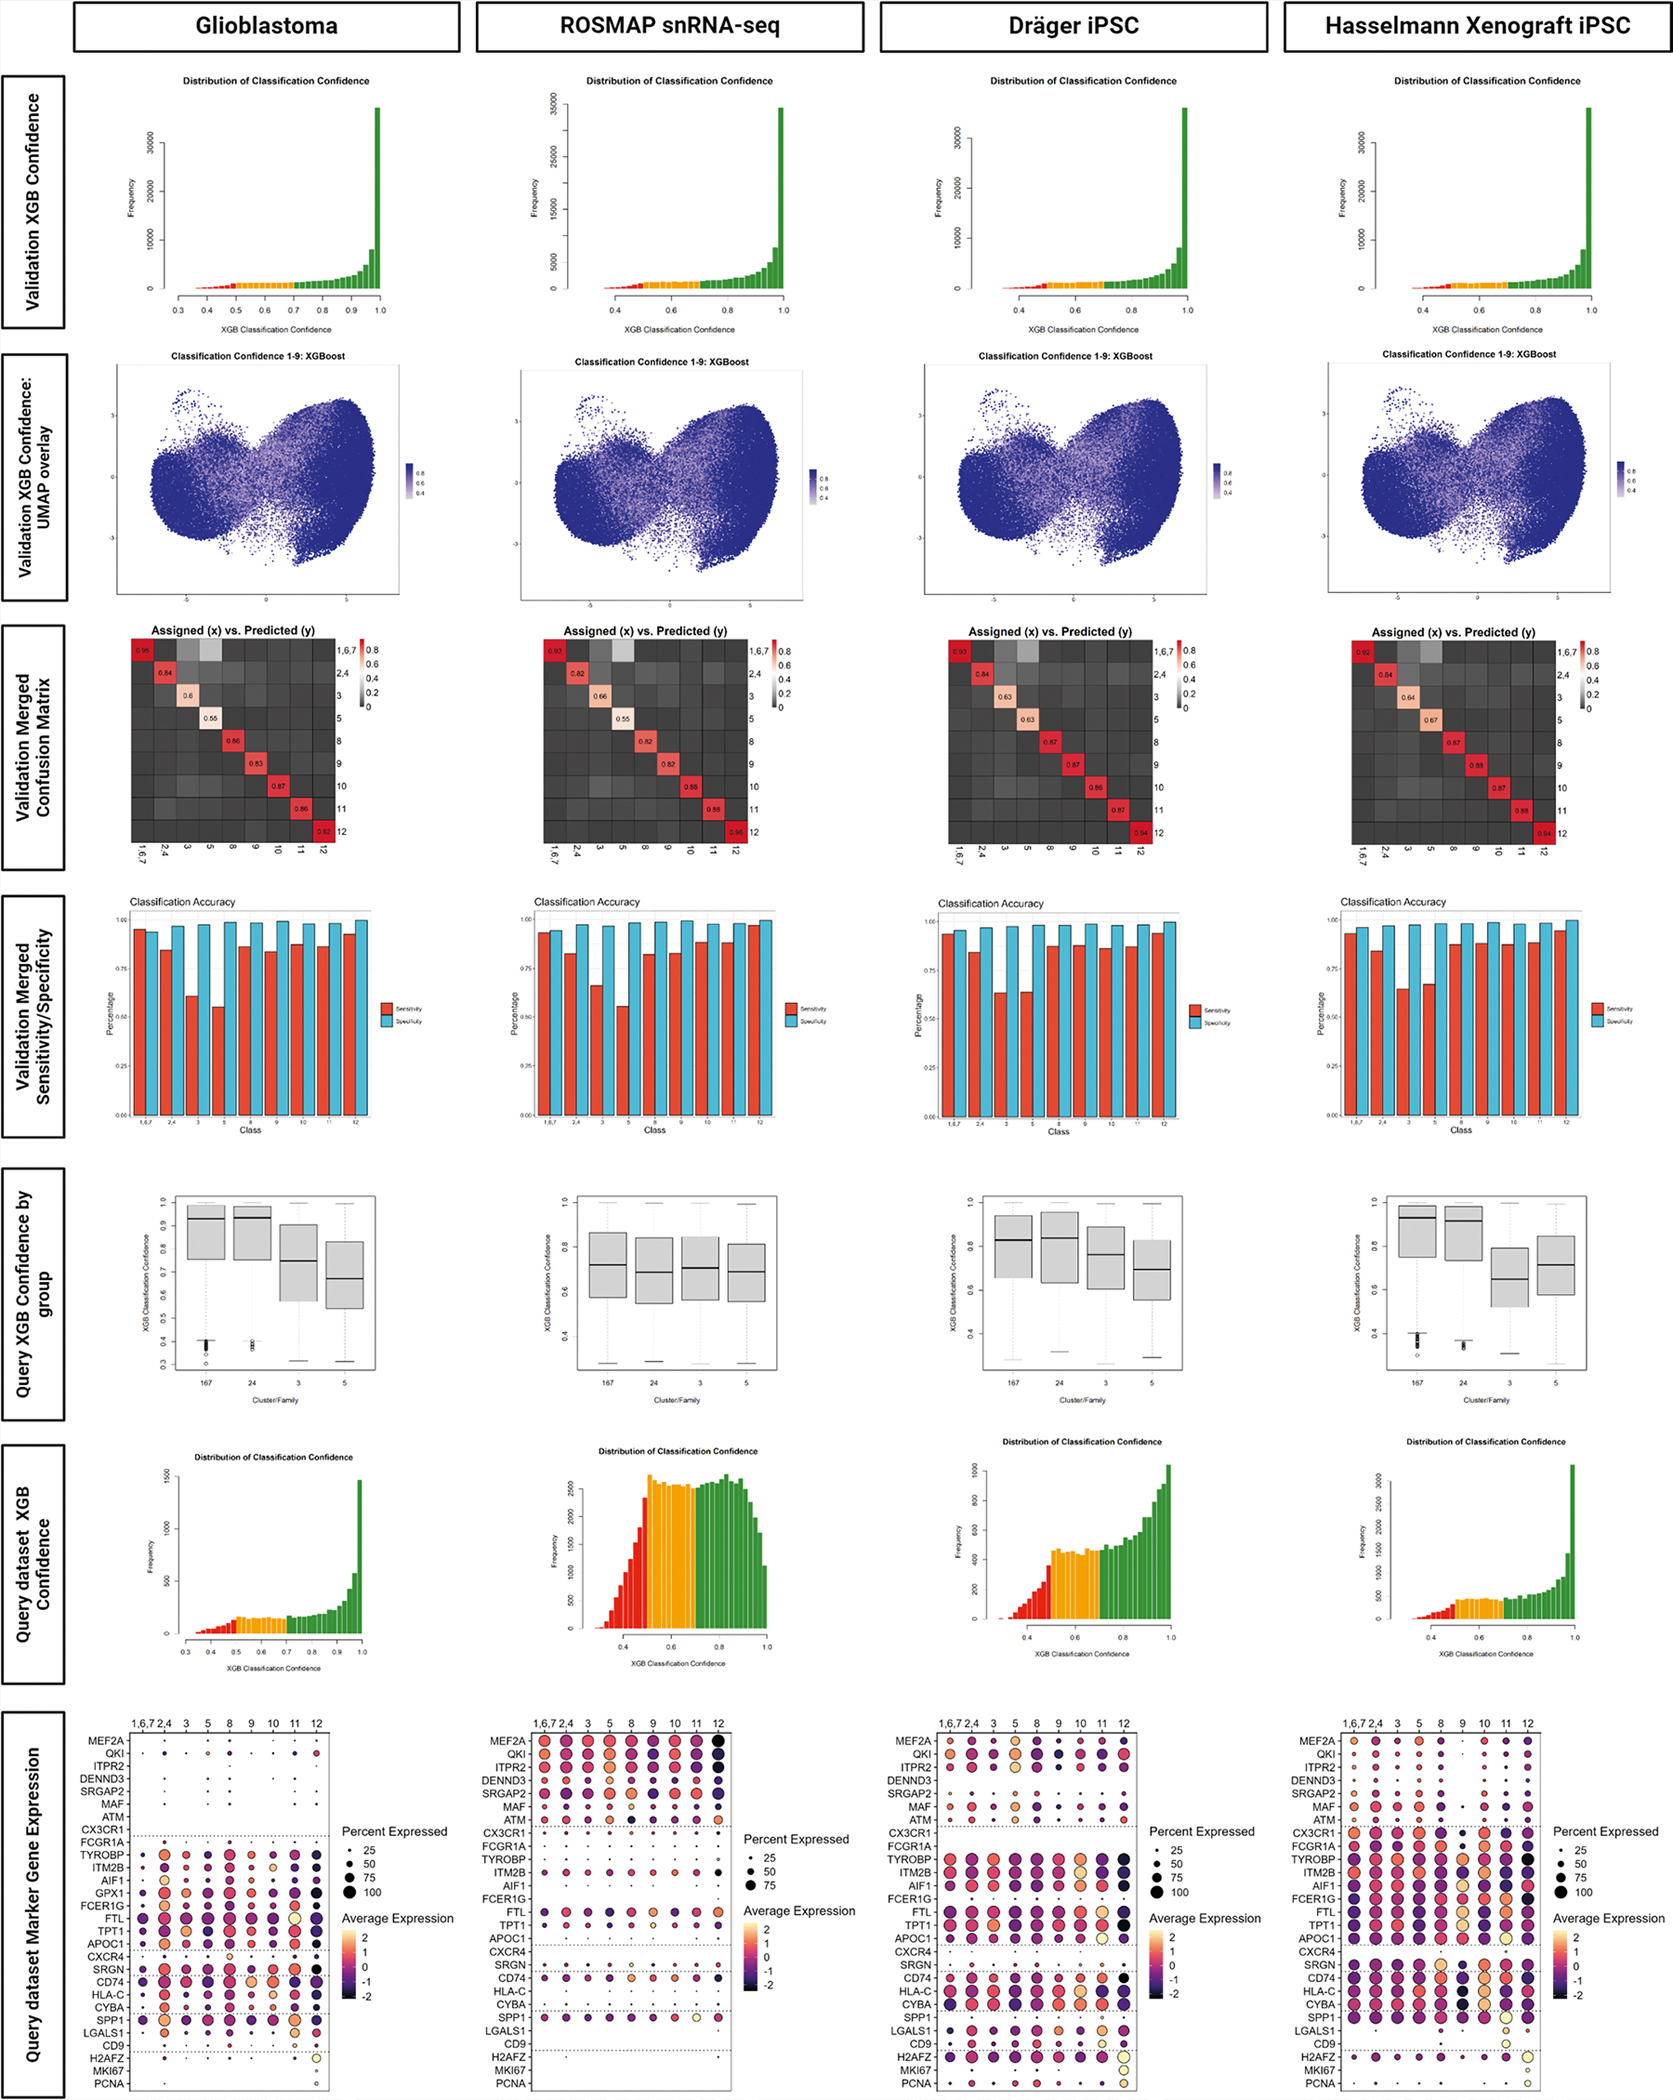
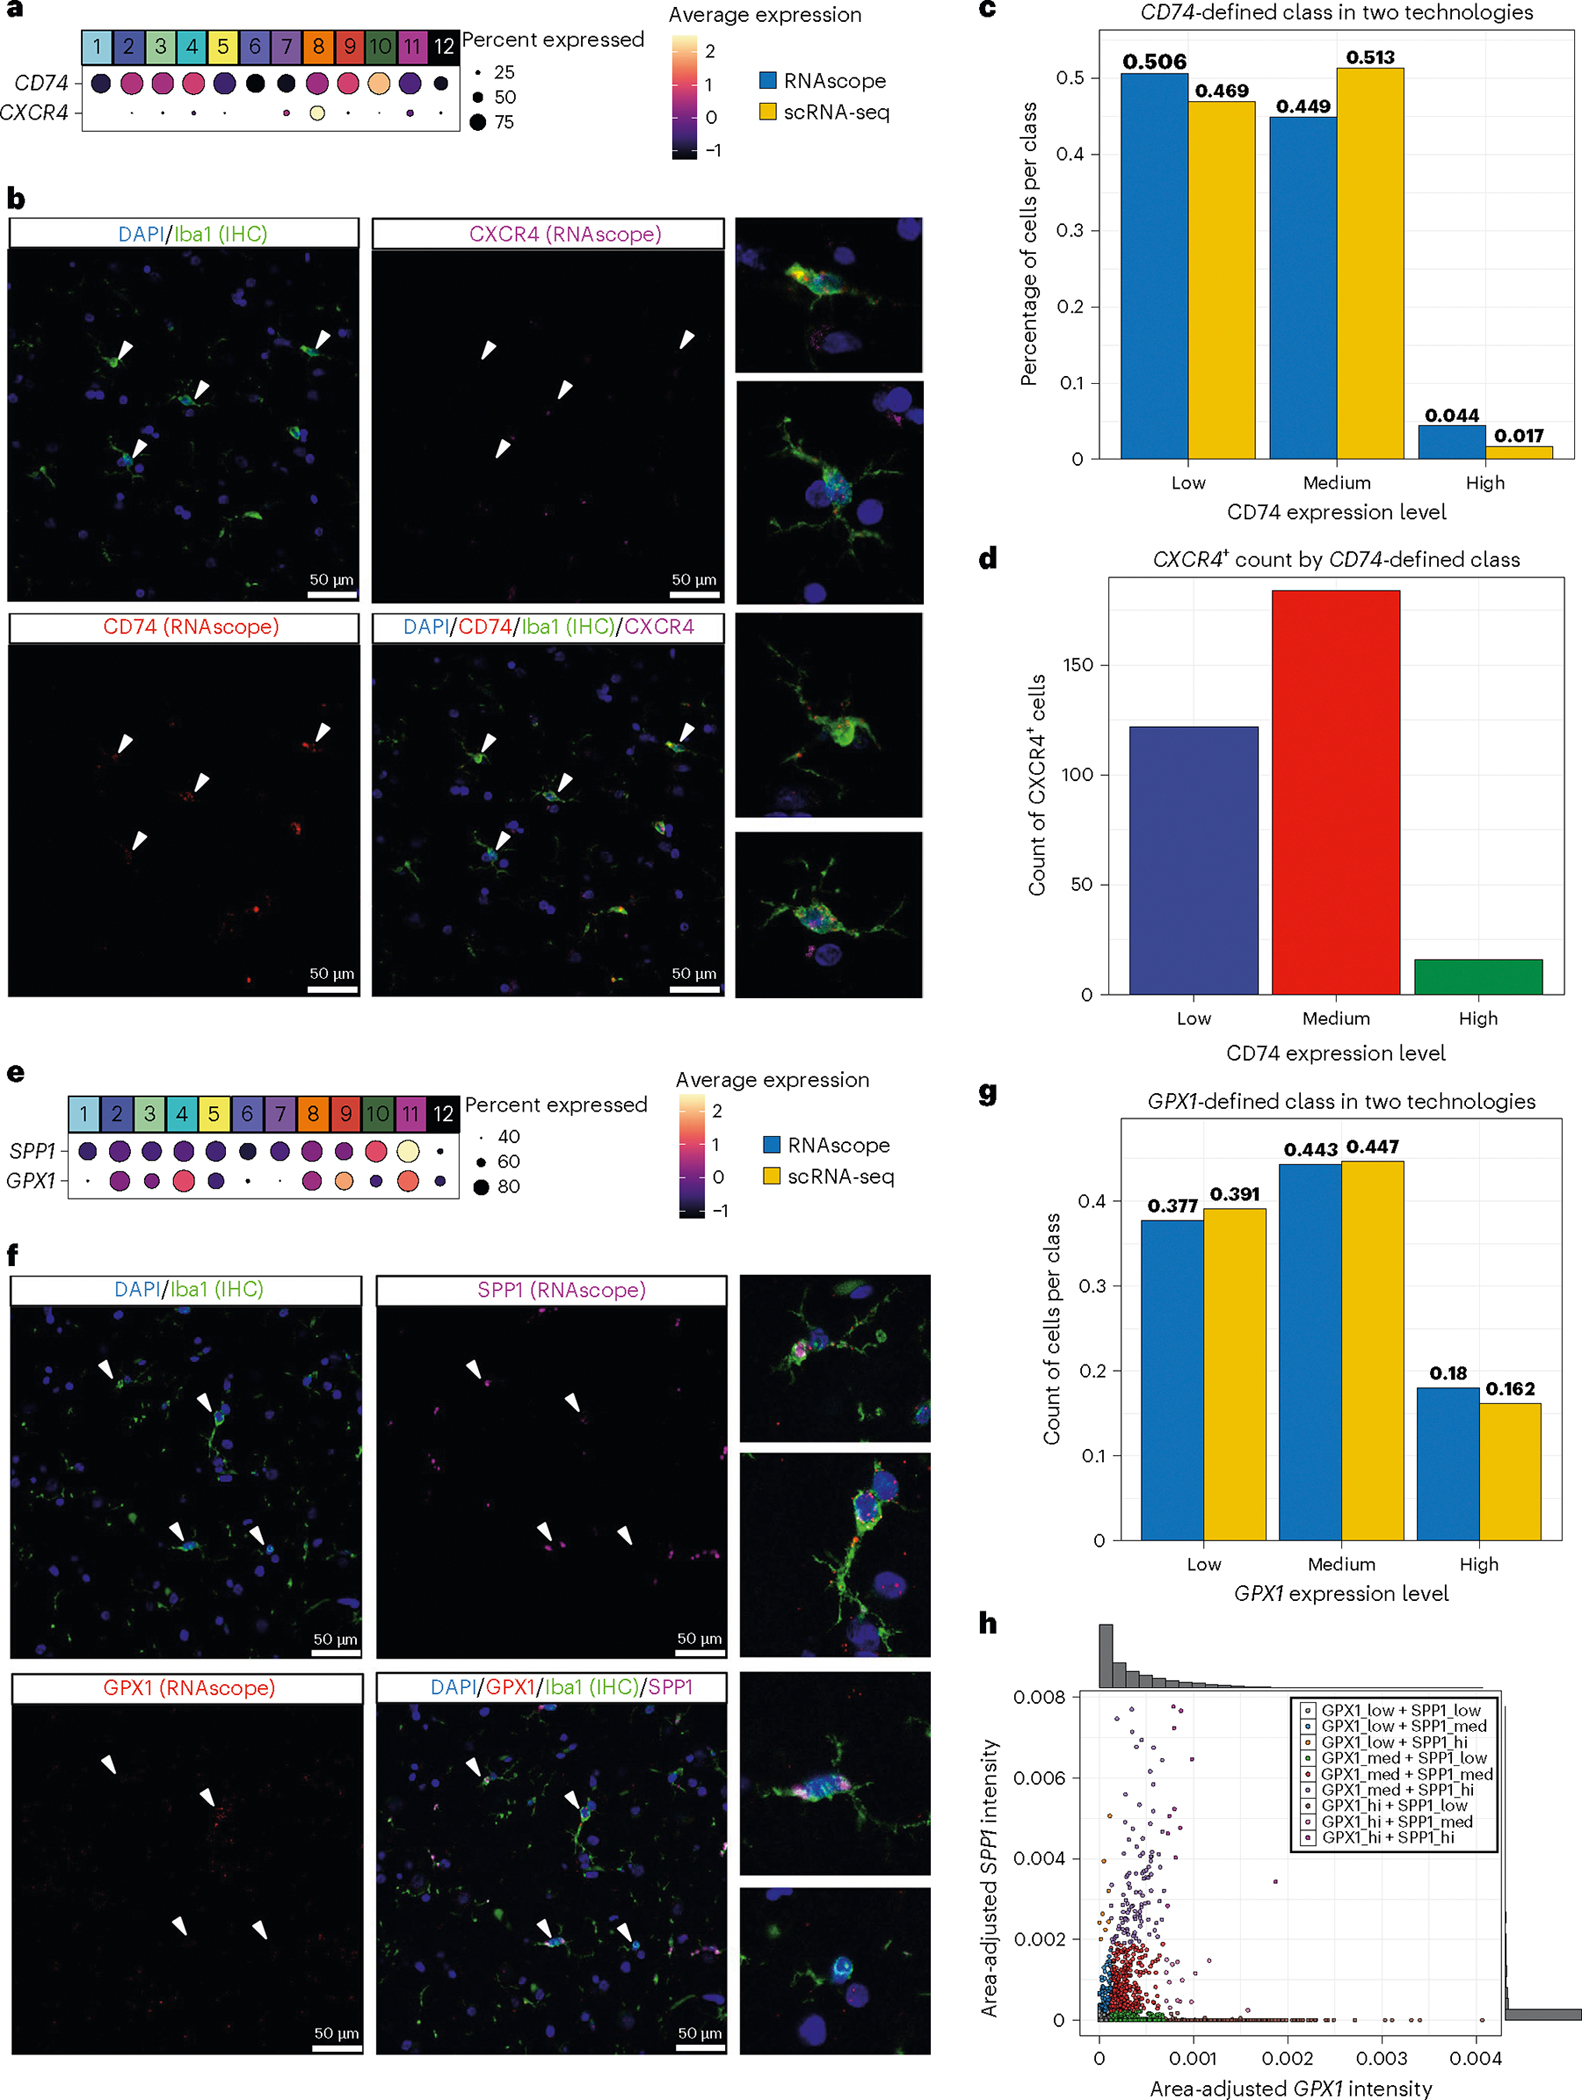
Human microglia play a pivotal role in neurological diseases, but we still have an incomplete understanding of microglial heterogeneity, which limits the development of targeted therapies directly modulating their state or function. Here, we use single-cell RNA sequencing to profile 215,680 live human microglia from 74 donors across diverse neurological diseases and CNS regions. We observe a central divide between oxidative and heterocyclic metabolism and identify microglial subsets associated with antigen presentation, motility and proliferation. Specific subsets are enriched in susceptibility genes for neurodegenerative diseases or the disease-associated microglial signature. We validate subtypes in situ with an RNAscope-immunofluorescence pipeline and high-dimensional MERFISH. We also leverage our dataset as a classification resource, finding that induced pluripotent stem cell model systems capture substantial in vivo heterogeneity. Finally, we identify and validate compounds that recapitulate certain subtypes in vitro, including camptothecin, which downregulates the signature of disease-enriched subtypes and upregulates a signature previously associated with Alzheimer's disease.


Conflict of interest statement

Competing interests: R.N.A. is funded by the NIH, DoD, the Parkinson’s Foundation and the Michael. J. Fox Foundation. R.N.A. received consultation fees from Avrobio, Caraway, GSK, Merck, Ono Therapeutics and Genzyme/Sanofi. P.L.D. has served as a consultant for Biogen, Merck-Serono and PureTech. All other authors declare no competing interests.

Figures

Extended Data Fig. 1 |
Extended Data Fig. 1 |. Proportions of overarching cell types in our dataset. (A) Different cell types are discriminable in UMAP space or by marker genes.
Unsupervised Jaccard-Louvain clustering on a kNN neighbor graph delineates distinct cell types, including adaptive immune cells, monocytes, glial/neuronal cells, and erythrocytes. UMAP plots are binned in hexagons: each single hexagon represents a merged representation of all cells falling within the region. The central UMAP plot is colored by the majority cell type. Different cell types are easily distinguishable in 2-D UMAP plots. The other schex-UMAP plots show gene expression values of selected characteristic marker genes projected onto cells. The color gradient bar represents log-normalized gene expression values. Yellow represents the maximal expressed value, while purple represents the lowest expression values. Markers of distinct immune subpopulations are detected in our data: CD8 T-cells (CD8A), NK cells (GZMB), B cells (MS4A1). Similarly, different non-neuronal cells can be detected in our analysis: astrocytes (GFAP), neurons (SNAP25), and oligodendrocytes (OLIG2). Monocytes (LYZ) localize close to our microglial cells and were used for comparative expression of marker genes in Fig. 2b. Red blood cells (HBB) were also easily discriminable. (B) Microglia are the predominant cell type recovered across regions and diseases. Bar plots showing the relative representation of different cell types across different metadata parameters, with each bar summing to 100%. Overall, 95.7% of cells are microglial, 2.2% are adaptive immune, 1.5% are glial/neuronal, 0.4% are monocytic, and 0.3% are erythrocytes. The upper bar plot shows proportion of each overarching cell group across regions, while the lower plot shows the same across diseases. Mono monocytes, RBC red blood cells, LOAD late-onset Alzheimer’s disease, EOAD early onset Alzheimer’s disease, MCI mild cognitive impairment, CNTRL control, DLBD-PD diffuse Lewy body disease-Parkinson’s disease, PSP progressive supranuclear palsy, TLE temporal lobe epilepsy, MS multiple sclerosis, ALS amyotrophic lateral sclerosis, FTD frontotemporal dementia, HD Huntington’s disease, DNET dysembryoplastic neuroepithelial tumor, BA Brodmann area, AWS anterior watershed, OC occipital cortex, TNC temporal neocortex, H hippocampus, TH thalamus, SC spinal cord, SN substantia nigra, FN facial nucleus.
Extended Data Fig. 2 |
Extended Data Fig. 2 |. Quality control metrics across our data after downsampling to account for 10x chemistry differences.
(A-F). Violin plots showing the distribution of our cellular data with overlaid boxplots. The center of boxplots is the median, and the hinges of the box span the 25% to 75% percentiles. Whiskers represent 1.5 IQR from the nearest hinge. Outliers are not shown in this visualization, nor are minima or maxima. Further information about metadata traits and number of cells included in each violin plot may be found in Supplementary Table 1 under ‘QC_’ tabs. The distributions of unique molecular identifiers (UMIs) and genes detected on a per-cell level after downsampling are similar across donors (A), clusters (B), genders (C), 10x chemistry versions (D), regions, (E), and diagnoses (F). Notably, after downsampling, differences between 10x chemistry versions in these metrics are largely eliminated. (G) Validation of population stability by resampling and reclustering demonstrates that overlap of gene expression is largely observed for clusters with similarly related families, such as 2 and 4, or for intermediate subsets such as 5 and 3. To evaluate clustering stability, we randomly sampled ¾ of the cells from our dataset and ran our clustering pipeline with identical parameters. We recorded the frequency of ‘misclassification’, where cells were re-clustered into clusters different from the one that contained most cells with the same original classification. This process was repeated between pairs of cells, and repeated 50 times for each comparison. Cells were considered to be classified into the ‘correct’ class if they were assigned correctly in ¾ of classification runs. Otherwise, they were considered ‘misclassified’ into a different cluster. Classification frequency is visualized in a heatmap here. LOAD late-onset Alzheimer’s disease, EOAD early onset Alzheimer’s disease, MCI mild cognitive impairment, CNTRL control, DLBD-PD diffuse Lewy body disease-Parkinson’s disease, PSP progressive supranuclear palsy, TLE temporal lobe epilepsy, MS multiple sclerosis, ALS amyotrophic lateral sclerosis, FTD frontotemporal dementia, HD Huntington’s disease, DNET dysembryoplastic neuroepithelial tumor, BA Brodmann area, AWS anterior watershed, OC occipital cortex, TNC temporal neocortex, H hippocampus, TH thalamus, SC spinal cord, SN substantia nigra, FN facial nucleus.
Extended Data Fig. 3 |
Extended Data Fig. 3 |. Microglial proportions across individual donors and donor-region pairings. (A) Proportions of microglial subtypes across single donors.
Proportions of microglial subtypes are plotted by donor, with selected metadata annotated in a header bar above. Each bar represents a single donor and sums to 100%. Samples are clustered hierarchically based on proportions of each subtype. Donors have variability in the exact proportions of different subtypes but exhibit consistent amounts of the most common subtypes in our dataset, clusters 1 through 6. (B) Proportions of microglial subtypes across region-donor pairings. Samples are aggregated to donor-region pairings (for example, AD1-BA9) to give a proportion of different clusters for each region for each individual. Boxplots are computed for specific region-disease pairings showing the median (center), 25% (left hinge), and 75% (right hinge), for the proportion of cells across all samples for which that combination of disease and region was sampled. Whiskers represent 1.5 IQR from the nearest hinge, and outliers are not shown, nor are minima or maxima. Proportions are shown on the x-axis, and the scale varies depending on the cluster in question. [Number of independent samples per category: TNC_TLE (6), TNC_PSP (1), TH_MS (2), SN_PSP (1), SN_LOAD (3), SN_DLBD-PD (5), SN_CNTRL (1), SC_ALS/FTD (2), SC_ALS (9), OC_TLE (1), OC_Stroke_lesion (1), Lesion_MS (1), H_TLE (2), H_PSP (1), H_LOAD (14), H_HD (1), H_FTD (1), H_EOAD (2), H_CNTRL (1), FN_ALS (4), DNET_DNET (1), BA9_Stroke_lesion (1), BA9_PSP (1), BA9_MS (2), BA9_MCI (4), BA9_LOAD (35), BA9_HD (1), BA9_FTD (1), BA9_EOAD (2), BA9_DLBD-PD (5), BA9_CNTRL (1), BA9_ALS/FTD (2), BA9_ALS (8), BA4_CNTRL (1), BA4_ALS/FTD (2), BA4_ALS (9), BA20_LOAD (9), BA20_HD (1), BA20_EOAD (2), AWS_MS (2), AWS_MCI (3), AWS_LOAD (13)].
Extended Data Fig. 4 |
Extended Data Fig. 4 |. Further exploration of microglial phenotypes with pseudotime analysis and GO annotation validates our trajectory map and reveals subsets associated with motility, lipid trafficking, and proliferation.
(A) Cluster 5, an intermediate cluster, shows association with motility. On the left, the size of the circle represents the percentage of cells in a cluster that express the gene, with no circle plotted if less than 10% of cells in a cluster express the gene. The color of the circle represents the z-scored expression of the gene. Cluster 5 expresses a transcriptional signature partially overlapping with the core homeostatic or transitional clusters, 2 and 3, but expresses unique sets of genes associated with motility. GO annotation was performed with topGO and summarized with rrvgo. Parent terms are shown in white, overlaid over child terms. Terms associated with motility are enriched in cluster 5. (B) Cluster 12 is associated with oxidative phosphorylation and proliferation. (C) Cluster 11 interfaces with lipids and beta-amyloid. (D) GO annotation of clusters 8/10 parallels results of Reactome pathway analysis, highlighting common immunological activation but divergence in other aspects of phenotype. (E) Trajectories of state shift in pseudotime analysis parallel those seen in other analyses. Monocle3 was used to build a pseudotime trajectory across our dataset, setting the root point at the boundary of clusters 2 and 3. Shifts in pseudotime from this root point reinforces the directionality laid out in the constellation diagram, suggesting that a broad intermediate gradient between a series of terminal points exists, with pseudotime scores in 6–7, 4, and 10 showing most divergence from the root point. GO gene ontology.
Extended Data Fig. 5 |
Extended Data Fig. 5 |. Additional representative images from our joint RNAscope/IF and CellProfiler measures highlight morphological differences between expression-defined subtypes.
Representative images are shown for both panel 1 (A) and panel 2 (B) across different diseases. (C) Compactness is highest in the medium classes of CD74, GPX1, and SPP1-defined expression groups. Compactness (a measure of ramification, where high values indicate high ramification) is shown across CD74-, GPX1-, and SPP1-expressing IBA1+ microglial cells quantified using CellProfiler. For this and following panels, significance was calculated with two-sided, two-sample Welch’s t-tests. Multiple testing correction was performed with Holm-Bonferroni correction. For boxplots in these visualizations, the center is the median, and the hinges of the box span the 25% to 75% percentiles. Whiskers represent 1.5 IQR from the nearest hinge. Outliers are shown as circles, but minima and maxima are not explicitly depicted. Significance thresholds for p-values: >0.05 = ns, <0.05 = *, <0.01 = **, <0.005 = ***. (D) Compactness is higher in the CXCR4+ class. (E) Eccentricity is highest in the low classes for CD74 and GPX1. Eccentricity (a measure of shape, where 0 is a circle and 1 is a line), is shown across CD74- and GPX1- expressing Iba1+ microglia. (F) CD74 distance is highest in the CD74 medium group, but also in the CXCR4+ group. CD74 distance (calculated as the median of all puncta for a given cell from the cellular centroid) is shown across CD74-, and CXCR4-expressing Iba1+ microglia. Number of cells per expression class are as follows. CD74: low (3756), medium (3333), high (329), GPX1: low (1404), medium (1653), high (329), SPP1: low (3216), medium (388), high (125), CXCR4: positive (322), negative (7096). 16 tissue sections were stained with panel 1 (CD74/CXCR4) and eight were stained with panel 2 (GPX1/SPP1).
Extended Data Fig. 6 |
Extended Data Fig. 6 |. In situ merFISH validation of microglia subtypes. (A) Projection of microglial cells into the established scRNAseq model.
UMAP space showing predicted cluster subtypes within a projected UMAP space (established model shown in greyed-out background). Seven out of twelve microglial subtypes were identified across AD (blue) and non-AD (yellow) cortex tissue, with different observed proportions. Clusters 8/10 show depletion in AD cortex ( < 1%) compared to non-AD cortex (35.7%). (B) Expression signatures of predicted clusters in situ. Microglia predicted to belong to clusters 8/10 show a greater average expression and percent expression of CXCR4, SRGN, and CD74. Showing clusters with at least 5 predicted microglia.
Extended Data Fig. 7 |
Extended Data Fig. 7 |. Performance metrics across models trained for different datasets.
Each row contains a different performance metric, while each column represents a single dataset. Training and validation sets were identical, but mNN correction incorporates the query dataset, slightly modifying input data. Accuracy metrics are derived from analysis of the holdout validation set, consisting of approximately 50% of the original dataset not used for training either SVM or XGB models (104902 cells). The first row presents histograms of XGBoost classification confidence for cells in the validation set, highlighting cells below 70% confidence in yellow and below 50% in red (the latter cells are dropped). Most cells in the validation set are classified with high confidence. Row 2 contains a UMAP visualization of classification confidence, revealing higher confidence for cells at the UMAP periphery and lower confidence for intermediate cells. Row 3 shows confusion matrices for the validation set. Row 4 presents sensitivity and specificity per class, which are comparable across different datasets. Row 5 shows boxplots for XGB classification confidence across the 4 classes. Boxplots represent the median (center), 25% (lower hinge), and 75% (upper hinge) percentiles. Whiskers extend to 1.5 times the IQR from the nearest hinge, with more extreme values represented as circles. Minima and maxima are not explicitly depicted. Classification confidence varies substantially depending on the data, with the ROSMAP data being the only dataset where classification confidence for families 167 and 24 is generally comparable to that for 3 and 5. Row 6 contains histograms of XGBoost classification confidence for the query cells. Notably, the glioblastoma and xenograft data have similar classification confidence to the validation set, but the ROSMAP data, and to a lesser extent, the Dräger data, diverge noticeably. Finally, row 7 shows marker gene expression across assigned labels in the query datasets. The size of the circle represents the percentage of cells in each cluster expressing the gene (no circle plotted if less than 10% of cells in a cluster express the gene). The color of the circle represents z-scored expression of the gene. Despite systematic differences, label transfer aligns expression profiles effectively.
Extended Data Fig. 8 |
Extended Data Fig. 8 |. Screening of in silico predictions identifies successful hits and compounds that fail to drive predicted signatures. (A) Schematic overview of workflow for compound treatment.
To explore the correct dosage for downstream studies, we conducted dose titration to examine viability of cells after treatment with varying dosages of our drugs. After choosing optimal concentrations, we conducted initial screening with qPCR to select candidates for final validation, then conducted final validation with bulk RNA-seq and proteomics. (B)-(D) qPCR results for different cluster families. Results not shown in Fig. 8b–d are shown here. Some compounds had effects on specific marker genes, but these did not pass our criteria for further study. Bars represent mean fold change expression, and error bars represent SD. All replicates are biological. Number of replicates per experiment as follows - Dorsomorphin: 6hrs: CXCR4 - n = 6, SRGN – n = 7; 24hrs: both n = 6, BX-795: 6hrs: CXCR4 - n = 5, SRGN – n = 8; 24hrs: CXCR4 - n = 3, SRGN – n = 5, BMS-2455421: 6hrs: both - n = 4; 24hrs: CXCR4 - n = 3, SRGN – n = 4, BRD: 6hrs: both - n = 7; 24hrs: TYROPB - n = 6, GPX1 – n = 7, Budesonide: 6hrs: n = 3; 24hrs: n = 3, Naltrexone: 6hrs: n = 3; 24hrs: n = 3, Cytochalasin b: 6hrs: SRGAP2 - n = 6, MEF2A – n = 5; 24hrs: both n = 6.
Extended Data Fig. 9 |
Extended Data Fig. 9 |. Different compounds modulate different aspects of the cluster 1/6 signature at the transcriptomic level. (A) Camptothecin downregulates the cluster 1/6 signature.
Bulk RNA-seq was generated from HMC3 cells treated with our candidate drugs for 24 h. Data was analyzed with DESeq2, which fits a negative binomial model to the data then uses Wald significance tests with Benjamini-Hochberg correction, and fold change shrinkage was performed with ashr. To examine the genes associated with cluster families, we took the top 20 non-overlapping genes for each individual cluster in our overarching groupings that were present in the differentially expressed gene list for each compound, irrespective of directionality and plotted them in volcano plots. FDR threshold was set to 0.01 and fold change threshold was set at 1.5. (B) Narciclasine does not upregulate the cluster 1/6 signature. (C) Narciclasine upregulates GO processes also found in cluster 1/6. GO annotation was computed on differentially expressed genes that passed an FDR threshold of 0.01 and a fold change threshold of 1.5. Terms were grouped based on similar etiology and parent terms were overlaid. Notably, Narciclasine drives metabolic shifts such as in nitrogen-containing metabolism, heterocyclic metabolism, and nucleic acid metabolism, that are strongly enriched in clusters 1/6 (Fig. 3a). (D) Narciclasine and Torin-2 drive distinct modules of cluster 1/6 marker genes. Cluster 1/6 genes were selected and shown in a row-scaled, zero-centered heatmap. Columns are individual replicates, and rows are genes. These two compounds appear to drive separate modules of genes associated with cluster 1/6. Camptothecin downregulates almost all 1/6 associated genes.
Extended Data Fig. 10 |
Extended Data Fig. 10 |. Representative flow gating images.
Cells that were stained with anti-CD11b and anti-CD45 antibodies and 7AAD were sorted by flow cytometry. Flow gates demonstrate selection of live singlets that are CD45-positive.
Fig. 1 |
Fig. 1 |. Overview of our cross-disease sample collection, data generation approach, downstream analyses and validation.
We sampled a wide array of neurological diseases and CNS regions (Supplementary Table 1) from a mix of autopsy samples and surgical resections. We isolated live brain CD45+ cells from a total of 74 donors of both sexes. Single-cell suspensions were loaded directly onto the 10x Chromium controller. Resulting libraries were sequenced on an Illumina HiSeq 4000. The lower part of the figure outlines our analyses and validation efforts, including disease and functional relevance of microglial subtypes, in situ validation, in vitro recapitulation of subtype phenotypes, and annotation of other datasets using our data as a reference.
Fig. 2 |
Fig. 2 |. Microglial subtypes are defined by distinct marker genes and shared expression programs.
a, Visual representation of the 12 microglial subtypes. A hex-binned uniform manifold approximation and projection (UMAP) plot presents microglial subsets: other cells are shown in Extended Data Fig. 1. Each hexagon is colored by the majority cluster identity among all cells aggregated (mean of 50 cells per hexagon). b, Expression levels of genes delineating different myeloid identities. The legend (above d) summarizes the selected gene sets, which are color coded on the left side. In be, each column presents data from a cluster of cells (microglial subtypes colored as in a and monocytes (Mo)), and each row represents the level of expression of a gene. The size of the circle represents the percentage of cells in each cluster that express the gene. The color of the circle represents z-scored gene expression. Genes were chosen for association with microglial, macrophage, BAM or monocytic identity. c, Subtype-enriched marker genes. Marker genes, selected by pairwise differential expression testing with MAST, delineate broad microglial families with overlapping gene expression programs and small clusters with strongly distinguishing marker genes. Hierarchical clustering with complete linkage on the expression of genes is shown by the dendrogram at the top of the figure. d, Expression level of DAM gene sets and homeostatic genes across microglial subsets. e, Heat map of DAM gene-set enrichment. Enrichment of DAM subtype signature genes in upregulated (for DAM1/DAM2, in red) or downregulated (homeostatic, in blue) genes associated with each cluster is shown. Each column is one microglial subtype. Enrichment was tested by false discovery rate (FDR)-corrected hypergeometric test. See also Supplementary Table 2. FACS, fluorescence-activated cell sorting.
Fig. 3 |
Fig. 3 |. Microglia display a complex trajectory of state transition with several primary axes.
a, A central metabolic divide separates divergent subtype families. Constellation diagram demonstrates relationships between clusters by way of post hoc classification. Each pair of distinct clusters was used to train a multilayer perceptron 50 times using fivefold cross-validation to obtain a classification for every cell. Cells that were classified to the same cluster less than 40 times were considered ambiguous. The fraction of ambiguous cells determines the width of the connecting lines in the diagram. Each node is a single cluster, with size scaled in proportion to the number of cells contained therein. Notably, even closely related clusters can be reliably distinguished over 85% of the time. Cluster 3, which has few distinct marker genes, has the most ‘central’ expression profile, with close relationships to the cluster 2/4 family and the 1/6/7 family. Cluster 5 represents another intermediate step between the 2/4 and 1/6/7 families. GO annotation was performed with topGO and summarized with rrvgo. Parent terms are shown in white, overlaid over child terms. GO annotation for clusters 1/6 and clusters 4/9 revealed a metabolic shift between the two groups: clusters 4/9 showed enrichment of oxidative phosphorylation, catabolism and protein metabolism, as well as general immune response, while clusters 1/6 demonstrated upregulation of heterocyclic and nitrogen-containing compound metabolism alongside transcriptional regulation. b,c, Clusters 8 and 10 shared a signature of interferon-gamma signaling and antigen presentation but differed in other pathways. Reactome annotation of clusters 8 and 10 aggregated by group highlights shared enrichment for T cell interaction and interferon-gamma signaling (purple in cluster 8 and blue in cluster 10). Cluster 10 showed upregulation of complement signaling (purple) and MHC class I/II antigen presentation (green), while cluster 8 showed upregulation of chaperone and steroid signaling (blue) and interleukin signaling (green). See also Extended Data Fig. 4.
Fig. 4 |
Fig. 4 |. Human microglial subsets are found across diseases and regions.
ad, Microglial subsets are broadly represented across diseases and regions. On the left (a and c), each bar shows the proportion of each cluster among all microglia from a given disease. On the right (b and d), UMAP plots are split by disease. Plots are color coded in accordance with Fig. 2a. Most subsets are represented across all diseases and all regions, albeit in slightly different numbers, although larger sample sizes would be required to statistically assess differences in abundance. LOAD, late-onset AD; EOAD, early-onset AD; Ctrl, control; TLE, temporal lobe epilepsy; DNET, dysembryoplastic neuroepithelial tumor; BA, Brodmann area; AWS, anterior watershed; OC, occipital cortex; TNC, temporal neocortex; H, hippocampus; TH, thalamus; SC, spinal cord; SN, substantia nigra; FN, facial nucleus. See also Extended Data Fig. 3.
Fig. 5 |
Fig. 5 |. Disease annotation implicates specific microglial families in disease.
a, Clusters 5 and 6 are enriched in GWAS-derived MS susceptibility genes. The y axis of the bar plot shows the different clusters, ranked in descending order of the negative log-transformed P values on the x axis. Enrichment of MS susceptibility genes in upregulated gene lists associated with each cluster was tested with the hypergeometric test using a Benjamini–Hochberg correction. Bars are colored if they have an FDR < 0.01. b, Clusters 1 and 6 are enriched in genes associated with neurodegenerative diseases. Enrichment analysis of genes associated with each disease in the GWAS catalog was performed with same parameters. Diseases are listed on the y axis, and negative log-transformed P values are shown for combinations of clusters and traits where they have an FDR < 0.01. Coloration of squares corresponds to P-value magnitude: larger P values correspond to darker blue squares, whereas smaller P values correspond to yellow coloration. c, Clusters 1 and 6 correlate with clinical and pathological traits in AD. In this case, enrichment was performed separately for both the genes positively and negatively correlated with each trait in upregulated genes for each cluster. Coloration of each box relates to the strength and directionality of each association. Red (positive numbers) corresponds to genes upregulated with the trait, while blue corresponds to genes downregulated in relation to the trait. See also Supplementary Table 3.
Fig. 6 |
Fig. 6 |. In situ confirmation of microglial population structure with joint immunofluorescence–RNAscope with automated segmentation.
a, CD74 demarcates a small, immunologically active subset, while CXCR4 delineates a distinct immunologically active subset. The size of the circle represents the percentage of cells in each cluster that express the gene, and the color of the circle represents z-scored gene expression. CD74 is overexpressed in cluster 10, while CXCR4 is primarily expressed in cluster 8. b, Representative images showing CD74 and CXCR4 in IBA1+ microglia. RNAscope staining for CD74 (red) and CXCR4 (pink) in IBA1+ microglial cells (green) in human cortical brain slices, with nuclear DAPI staining (blue). In the same field of view, microglia with different levels of CD74 and with or without expression of CXCR4 can be observed (arrowheads point to representative microglia). c, Separating single in situ cells using CD74 expression thresholds adapted from scRNA-seq identified similar proportions across technologies. The proportion of cells, along the y axis, that express low, medium or high levels of CD74, along the x axis, in scRNA-seq is shown in yellow, while in situ results (area-adjusted CD74 expression binned on thresholds from scRNA-seq) are shown in blue. d, CXCR4+ cells matched the expected distribution within CD74 expression classes. CD74 expression class, as described in c, is shown on the x axis, and count of CXCR4+ cells is shown on the y axis. CXCR4+ microglial cells are identified in situ and most fall into the CD74int class, confirming our scRNA-seq findings. e, GPX1 and SPP1 delineate the DAM axis and extremes in homeostatic-active families. f, Representative images from our joint staining protocol for GPX1 and SPP1. Staining as in b, except that RNAscope SPP1 is pink and GPX1 is red. g, Separating single in situ cells on the basis of GPX1 expression thresholds borrowed from scRNA-seq also identified similar proportions across technologies. Analysis performed as in c but using GPX1 expression data. h, Gradated expression of both SPP1 and GPX1. Individual cells are plotted as single dots, where the axes represent area-adjusted expression of GPX1 (x) or SPP1 (y). See also Extended Data Fig. 5 and Supplementary Tables 4 and 5. IHC, immunohistochemistry.
Fig. 7 |
Fig. 7 |. Live microglial population structure enables annotation of datasets from model systems and data produced with different technologies.
a, Overview of our label transfer workflow. Similar classes were aggregated (2 and 4 or 1, 6 and 7) to simplify the classification problem, and classifications from two types of models were merged to assign final class labels for all cells in query data. b, Distribution of subset proportions across different datasets in comparison to our reference. cf, Mapping of query datasets onto our reference model. UMAP colors for each cluster family were shaded by the proportion of cells assigned to each family in each dataset. Numbers are the proportion of cells in each query dataset that were assigned to each cluster. g, Xenografted human iPS cell microglia shifted away from homeostatic-active phenotypes and toward disease-associated phenotypes in 5XFAD mice. Bar plot showing the proportion of iPS cell-derived microglia-like cells (y axis) in each of three cluster families (x axis) from either 5X (blue) or WT (red) mice. n = 2 per condition. h, GBM induced depletion of homeostatic myeloid cells and shifted microglia toward more inflammatory subtypes. Bar plot showing proportions of cells per group from the reference (blue), or the classified GBM data (red). Between the two datasets, the higher proportion is shown in its corresponding color, and the lower proportion is delineated in gray. h, Cluster 3 abundance correlated negatively with amyloid pathology in ROSMAP single-nucleus data. In the dot plot, each dot is a single donor. Axes are amyloid burden (y) and proportion of cells classified as cluster 5 (x). h,i, Conversely, cluster 5 abundance correlated positively with amyloid pathology. See also Extended Data Fig. 6 and Supplementary Table 6. j, Projection of a GBM dataset into our model; there is a shift in the proportion of microglial subtypes away from homeostatic subtypes and toward activated subtypes in GBM-derived cells (pink) relative to our reference data (blue).
Fig. 8 |
Fig. 8 |. Chemical perturbation recapitulates in vivo human microglial subtype signatures in vitro.
a, Representative example of CMAP analysis. The CMAP was used to identify compounds that might drive transcriptional signatures found in different microglial subsets. The cell ID column identified the nine cell lines used in CMAP. Drugs were ranked by the tau score, which quantifies homology between the perturbagen and the query. Scores greater than 90 were considered as candidates for further study. bd, qPCR hits by grouping: 1/6, 4/9 or 8/10. Drugs were tested in the HMC3 microglial model system at 6-h and 24-h intervals, and two marker genes were assayed by qPCR per cluster group (1/6, SRGAP2 and MEF2A; 4/9, TYROBP and GPX1; 8/10, CXCR4 and SRGN). CT values were normalized to HPRT1. Bars represent fold-change expression in relation to DMSO control. e, Camptothecin upregulated cluster 10 markers. Volcano plot showing log fold change (LFC, x), and −log10 P value (y) from bulk RNA-seq generated from HMC3 cells treated with camptothecin for 24 h. Data were analyzed with DESeq2. FDR threshold was set to 0.01 and LFC threshold was set at 1.5. The top 20 cluster 10 genes in the differentially expressed gene list, irrespective of direction, were plotted. f, Torin-2 upregulated most cluster 1/6 markers. g, PCA revealed convergence of narciclasine and Torin-2 at the proteomic level. PCA was calculated on log-normalized proteomic data. At the proteomic level, Torin-2 and narciclasine are similar and divergent from both control and camptothecin. h, Camptothecin upregulated cluster 10 markers at the proteomic level. Heat map showing the row-scaled, zero-centered expression values of proteomic data derived from compound-treated HMC3 microglia (24 h; n = 3 per treatment). Each column is a single sample, and each row is a single gene. Pairwise differential testing between DMSO control and each of our treated conditions was conducted using Welch’s t-test with the Benjamini–Hochberg correction (FDR alpha < 0.05, LFC < 1). I, Camptothecin downregulates cluster 1/6 markers at the proteomic level. See also Extended Data Fig. 7 and 8 and Supplementary Tables 6 and 7. PMA, phorbol 13-myristate 12-acetate.

References

    1. Ginhoux F, Lim S, Hoeffel G, Low D & Huber T Origin and differentiation of microglia. Front. Cell. Neurosci. 7, 45 (2013). - PMC - PubMed
    1. Li Q & Barres BA Microglia and macrophages in brain homeostasis and disease. Nat. Rev. Immunol. 18, 225–242 (2018). - PubMed
    1. Liddelow SA et al. Neurotoxic reactive astrocytes are induced by activated microglia. Nature 541, 481–487 (2017). - PMC - PubMed
    1. Olah M et al. Single cell RNA sequencing of human microglia uncovers a subset associated with Alzheimer’s disease. Nat. Commun. 11, 6129 (2020). - PMC - PubMed
    1. Butovsky O & Weiner HL Microglial signatures and their role in health and disease. Nat. Rev. Neurosci. 19, 622–635 (2018). - PMC - PubMed

LinkOut - more resources