. 2024 Nov;6(11):2060-2069.
doi: 10.1038/s42255-024-01145-1. Epub 2024 Oct 15.

Itaconate drives mtRNA-mediated type I interferon production through inhibition of succinate dehydrogenase

Affiliations

Itaconate drives mtRNA-mediated type I interferon production through inhibition of succinate dehydrogenase

Shane M O'Carroll et al. Nat Metab. 2024 Nov.

Erratum in

Abstract

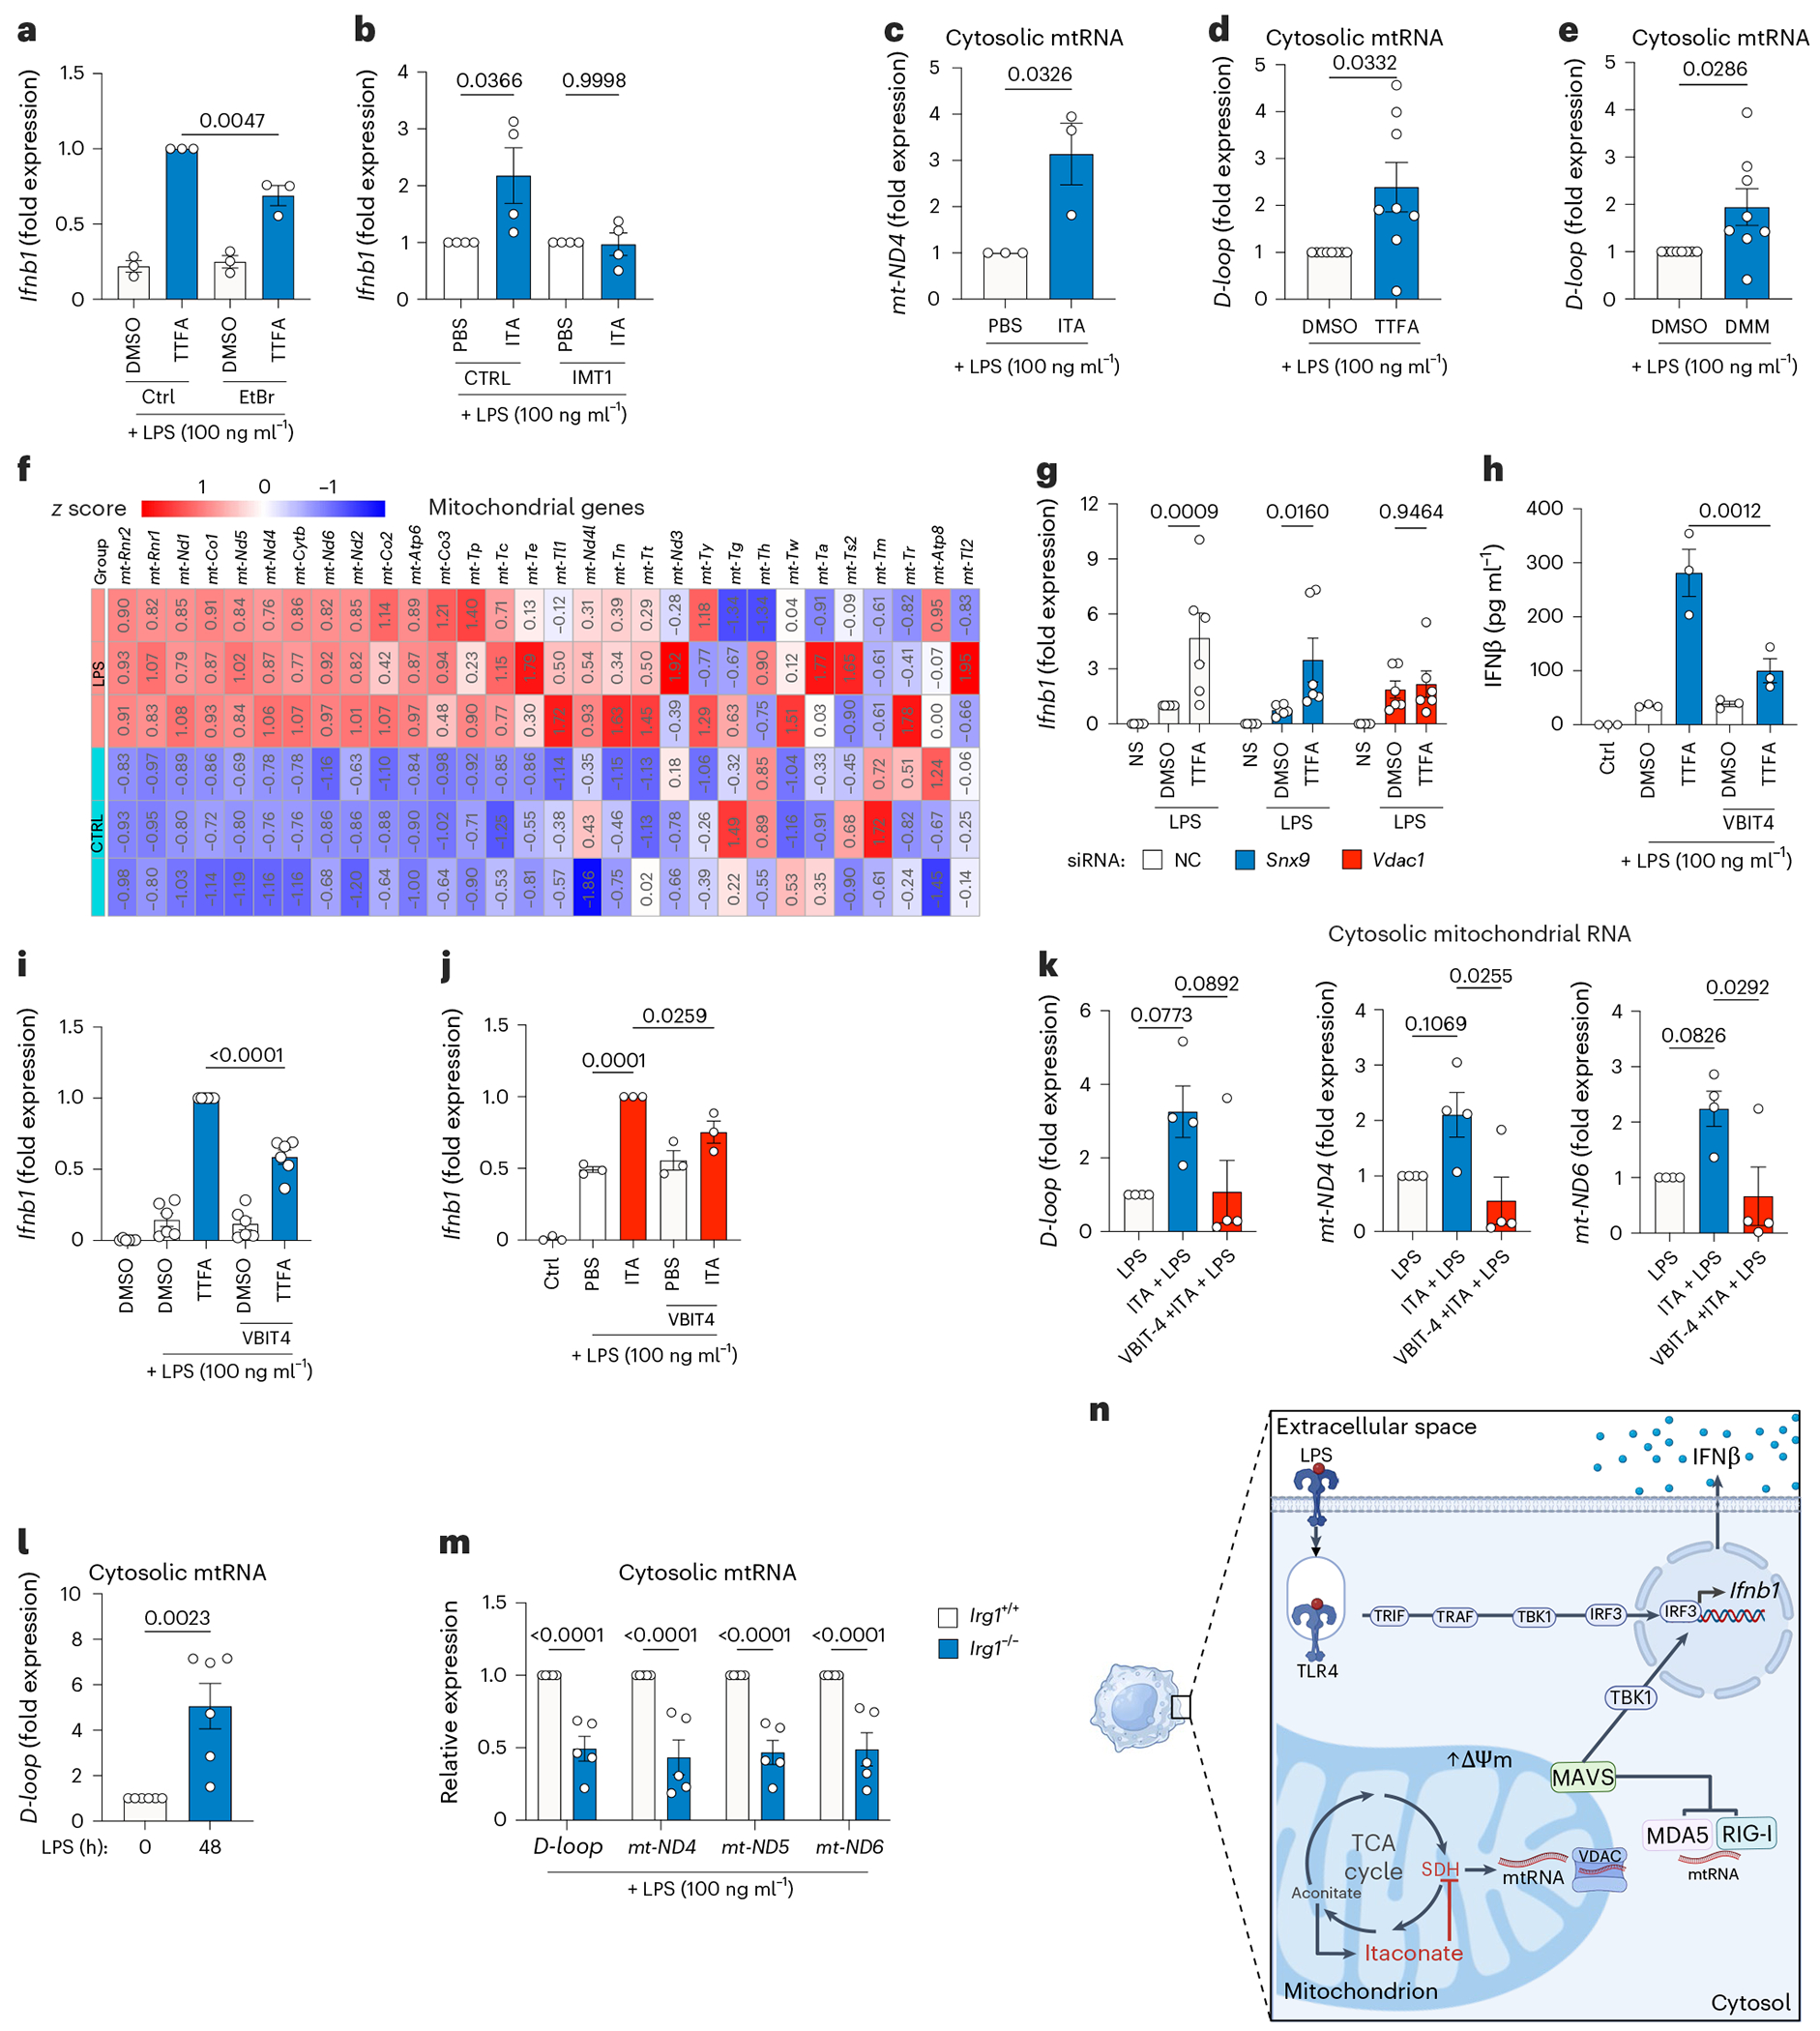
Itaconate is one of the most highly upregulated metabolites in inflammatory macrophages and has been shown to have immunomodulatory properties. Here, we show that itaconate promotes type I interferon production through inhibition of succinate dehydrogenase (SDH). Using pharmacological and genetic approaches, we show that SDH inhibition by endogenous or exogenous itaconate leads to double-stranded mitochondrial RNA (mtRNA) release, which is dependent on the mitochondrial pore formed by VDAC1. In addition, the double-stranded RNA sensors MDA5 and RIG-I are required for IFNβ production in response to SDH inhibition by itaconate. Collectively, our data indicate that inhibition of SDH by itaconate links TCA cycle modulation to type I interferon production through mtRNA release.


Conflict of interest statement

Competing interests: L.A.J.O. is a paid consultant for Sitryx Therapeutics, Sail Biomedicines and Montai Health. The other authors declare no competing interests.

Figures

Extended Data Fig. 1 |
Extended Data Fig. 1 |. Immunoregulatory effects of itaconate.
a, PCA plot of RNA-Seq analysis. b, Differential expression gene clustering heatmap with Z-score. c, MsigDB Hallmark pathway enrichment analysis of differentially expressed genes from itaconate pretreated BMDMs followed by 3 h LPS treatment. d, NRF2 pathway enrichment plot of itaconate-treated BMDMs. e) Western blot of IRG1 in Irg1+/+ and Irg1−/− BMDMs treated with LPS for 24 h and 48 h. f, qPCR of IRG1 (p = 1.017e-11) in human PBMCs that were harvested in the presence of Irg1 siRNA (n=3 donors; LPS 24 h). Data are presented as mean ± SEM. P values were calculated using two-way ANOVA for multiple comparisons.
Extended Data Fig. 2 |
Extended Data Fig. 2 |. Effect of electrophilic compounds on IFNβ.
a, IFNβ release and b, Ifnb1 expression in BMDMs pretreated with DMSO or 4-OI a (n=6 mice; LPS 4 h) b, (n=9; LPS 4 h). c, Ifnb1 expression of BMDMs pretreated with DMSO or DEM (n=3 mice; LPS 4 h) from 3 independent experiments. d, Normalised counts from RNA-seq data in BMDMs pretreated with DMSO or DMF (n=3 mice; LPS 4 h) from 3 independent experiments Data are presented as mean ± SEM. P values were calculated using one-way ANOVA for multiple comparisons or two-tailed student’s t-test for pairwise comparisons.
Extended Data Fig. 3 |
Extended Data Fig. 3 |. SDH-deficiency is involved in the itaconate-interferon phenotype.
a, Sdhb and b, Il1b expression in Sdhbfl/fl and Sdhb−/− BMDMs (n=2 mice; LPS 4 h) from 2 independent experiments. c, IFNB expression in IRG1+/+ and IRG1−/− THP-1 cell lines pretreated with DMSO or TTFA (n=4 replicates; LPS/IFNγ 4 h) from 2 independent experiments d, IFNB expression in THP-1 derived macrophages pretreated with PBS or Mesaconate (n=4 replicates; LPS/IFNγ 4 h) from 2 independent experiments. Data are presented as mean ± SEM. P values were calculated using two-way ANOVA for multiple comparisons or two-tailed student’s t-test for pairwise comparisons.
Extended Data Fig. 4 |
Extended Data Fig. 4 |. Knockdown of nucleic acid sensors in BMDMs.
a-d, Expression of a, Ddx58, b, Ifih1, c, Mb21d1, and d, Tlr9 in BMDMs in the presence of a,c, Mb21d1, Ddx58, b,d, Tlr9 and Ifih1 siRNA pretreated with DMSO or TTFA (n=3 mice; LPS 4 h) from 3 independent experiments. e-g, Expression of e, Mb21d1 f, Ifih1, and g, Ddx58 in the presence of Mb21d1, Ifih1, and Ddx58 siRNA in BMDMs pretreated with PBS or ITA (n=2-3 mice; LPS 4 h) from 2 or 3 independent experiments. h-j IFNβ release in BMDMs transfected with h, G3-YSD, i, Poly(I:C), or j, 5′PPP-dsRNA in the presence of h, Mb21d1, i, Ifih1, or j, Ddx58 siRNA (n=3 mice; 4 h) from 3 independent experiments. k, Ifnb1 and l, Tmem173 expression in BMDMs pretreated with DMSO or TTFA in the presence of Tmem173 siRNA (n=3 mice; LPS 4 h). Data are presented as mean ± SEM. P values were calculated using two-way ANOVA for multiple comparisons.
Extended Data Fig. 5 |
Extended Data Fig. 5 |. mtRNA is released in a VDAC1-dependent manner.
a, qPCR of mitochondrial DNA-encoded genes in BMDMs after mtDNA depletion with EtBr (6 days) followed by TTFA pretreatment (0.5 mM, 3 h) and LPS stimulation (n = 3 mice, 4 h) from 3 independent experiments. b, qPCR of mitochondrial DNA-encoded gene in BMDMs after POLRMT inhibition with IMT1 followed by itaconate pretreatment (3 h) and LPS stimulation (n = 3 mice, 4 h) from 3 independent experiments. c, Western blot of organellar and cytosolic fractions of BMDMs after subcellular digitonin fractionation (n=2 mice); Images representative of two independent experiments. d, qPCR of Ifnb1, Bak1, and Bax, after Bak1 or Bax siRNA knockdown followed by TTFA pretreatment (3 h) and LPS stimulation (n = 3 mice, 4 h) from 3 independent experiments. qPCR data of e, Vdac1 or f, Snx9 in BMDMs after Vdac1 or Snx9 siRNA knockdown followed by pretreated with TTFA (0.5 mM, 3 h) followed by LPS stimulation (n = 5 mice, 4 h) from 3 independent experiments. g, Immunofluorescence images of BMDMs pretreated with DMSO or TTFA (0.5 mM, 3 h) followed by LPS (n = 2 mice, 4 h). Images representative of 2 independent experiments. Data are presented as mean ± SEM. P values were calculated using two-way ANOVA for multiple comparisons.
Fig. 1 |
Fig. 1 |. Itaconate boosts LPS-mediated IFNβ expression in macrophages.
a, IREA plot of RNA-seq data of significantly (adjusted P (Padj) < 0.05) differentially expressed genes in BMDMs pretreated with PBS or itaconate (10 mM, 3 h) (n = 3 mice; LPS 4 h). Data are from three independent experiments. b, IFNβ release from BMDMs pretreated with PBS itaconate (n = 8; LPS 16 h). Data are from three independent experiments. c, Ifnb1 expression, determined through RNA-seq, in BMDMs pretreated with PBS or itaconate (n = 3 mice, LPS 4 h). Data are from three independent experiments. d, IFNB expression, assessed by quantitative PCR (qPCR), in human monocyte-derived macrophages (MDMs) pretreated with PBS or itaconate (ITA) (10 mM, 3 h) (n = 4 donors; LPS 4 h). Data are from two independent experiments e, IFNβ release from Irg1+/+ versus Irg1−/− BMDMs (n = 6 mice; LPS 4 h). Data are from three independent experiments. f, IFNβ release (P = 0.0023) from human PBMCs with IRG1 knockdown (n = 5 donors; LPS/IFNγ 24 h). NC siRNA, negative control siRNA. Data are from three independent experiments. In the graphs, data are shown as mean ± s.e.m. P values were calculated using one- or two-way analysis of variance (ANOVA).
Fig. 2 |
Fig. 2 |. SDH inhibition boosts LPS-mediated IFNβ production in macrophages.
a, Measurement of the complex II (CII)-specific oxygen consumption rate (OCR), assessed through a Seahorse assay, of Irg1+/+ and Irg1−/− BMDMs (n = 5 technical replicates; LPS 24 h). Data are from one experiment. b, Metabolomics data showing relative expression of itaconate (P = 4.15 × 10⁻¹⁵), succinate (P = 2.854.15 × 10−13), fumarate (P = 1.00 × 10⁻¹³) and malate (P = 3.38 × 10⁻⁵) in Irg1+/+ and Irg1−/− BMDMs. Data are from a publicly available dataset (n = 3 mice; LPS 24 h). c,d, qPCR data on Ifnb1 from BMDMs pretreated with AA5 (c), TTFA (d) or DMSO (3 h) (n = 3 mice, LPS 4 h). Data are from three independent experiments. e, IFNB expression, assessed by qPCR, in human MDMs pretreated with DMSO or TTFA (0.5 mM; 3 h) (n = 4 donors; LPS 4 h). Data are from two independent experiments f, IFNβ release in Sdha+/+ and Sdha−/− RAW.264.7 macrophages (n = 2 mice; LPS). Data are from one experiment. g,h, IFNβ release (g) and Ifnb1 expression (h) in BMDMs from Sdhbfl/fl and Sdhb−/− cells (n = 2 mice, LPS 4 h). Data are from one experiment. i, Heatmap showing relative expression (z score) of interferon-stimulated genes (ISGs) commonly upregulated in BMDMs following TTFA and itaconate treatment (Padj < 0.05). (n = 3 mice, LPS 4 h). Data are from three independent experiments. j, IFNB and IL1B expression in SDH-deficient (n = 5 patients) and SDH-competent (n = 5 patients) tumor samples. In all graphs, data are presented as mean ± s.e.m. P values were calculated using a one- or two-way ANOVA.
Fig. 3 |
Fig. 3 |. SDH inhibition increases IFNβ production through RIG-I- and MDA5-dependent signaling.
a, Venn diagram showing the number of shared upregulated differentially expressed genes, determined by RNA-seq, between TTFA- and itaconate-treated BMDMs (n = 3 mice; LPS 4 h, Padj < 0.05). b,c, REACTOME pathway enrichment analysis (b) and KEGG pathway enrichment analysis (c) of commonly upregulated differentially expressed genes between TTFA- and itaconate-treated BMDMs (n = 3 mice; LPS 4 h). Data are from three independent experiments. FDR, false discovery rate. d, Ifnb1 expression after siRNA knockdown of Mb21d1 (P = 8.42 × 10⁻¹⁰) and Ddx58 in BMDMs pretreated with DMSO or TTFA (n = 5 mice; LPS 4 h). Data are from two independent experiments. e, Ifnb1 expression after siRNA knockdown of Tlr9 and Ifih1 in BMDMs pretreated with DMSO or TTFA (n = 3 mice; LPS 4 h). Data are from three independent experiments. f, IFNβ release after treatment with NC siRNA (n = 7 mice) or siRNA targeting Mb21d1 (n = 4 mice), Ifih1 (n = 6) or Ddx58 (n = 6 mice) in BMDMs pretreated with PBS or ITA (LPS 4 h). Data are from three independent experiments. In all graphs, data are presented as mean ± s.e.m. P values were calculated using two-way ANOVA.
Fig. 4 |
Fig. 4 |. SDH inhibition drives mtRNA release in a VDAC1-dependent manner.
a, Ifnb1 expression in BMDMs in control or ethidium bromide (EtBr)-containing medium pretreated with DMSO or TTFA (n = 3 mice; LPS 4 h). Data are from three independent experiments. b, Ifnb1 expression in BMDMs pretreated with DMSO, IMT1, PBS or ITA (n = 4 mice; LPS 4 h). Data are from two independent experiments. c, mt-ND4 expression in the isolated cytosolic fraction of BMDMs pretreated with PBS or ITA (n = 3 mice; LPS 4 h). Data are from three independent experiments. d,e, Expression of the D-loop region of mtDNA in the isolated cytosolic fraction of BMDMs pretreated with DMSO, TTFA (d) or DMM (e) (n = 8 mice; LPS 4 h). Data are from three independent experiments. f, Heatmap of RNA-seq data for mitochondrial genes in BMDMs pretreated with ITA or TTFA (n = 3 mice; LPS 4 h). Data are from three independent experiments. g, Ifnb1 expression in the presence of NC siRNA or siRNA targeting Snx9 or Vdac1 in BMDMs pretreated with DMSO (n = 6 mice; LPS 4 h). Data are from three independent experiments. h,i, IFNβ release (h) and Ifnb1 expression (P = 2.13 × 10⁻¹¹) (i) in BMDMs pretreated with VBIT-4 (16 h), DMSO or TTFA. h, (n = 3 mice; LPS 4 h); i, (n = 6 mice; LPS 4 h). Data are from three independent experiments. j, Ifnb1 expression in BMDMs pretreated with DMSO or VBIT-4 (16 h) followed by PBS or ITA pretreatment (n = 3 mice; LPS 4 h). k, D-loop, mt-ND4 and mt-ND6 expression in the isolated cytosolic fraction of BMDMs pretreated with DMSO or VBIT-4 (16 h) followed by PBS or ITA pretreatment (n = 4; LPS 4 h). Data are from three independent experiments. l, D-loop expression in the cytosolic fraction of BMDMs (n = 6; LPS 48 h). Data are from three independent experiments. m, Expression of D-loop (P = 2.32 × 10⁻⁵), mt-Nd4 (P = 4.22 × 10⁻⁶), mt-Nd5 (P = 1.10 × 10⁻⁵) and mt-ND6 (P = 2.03 × 10⁻⁵) in the cytosolic fraction of Irg1+/+ and Irg1−/− BMDMs (n = 5 mice; LPS 24 h). Data are from three independent experiments. n, Schematic of the mechanism underlying how SDH impairment leads to increased IFNβ production. The figure was created with BioRender.com. Data in graphs are presented as mean ± s.e.m. P values were calculated using one or two-way ANOVA for multiple comparisons or two-tailed Student’s t-test for pairwise comparisons.

References

    1. Mills EL et al. Itaconate is an anti-inflammatory metabolite that activates Nrf2 via alkylation of KEAP1. Nature 556, 113–117 (2018). - PMC - PubMed
    1. Michelucci A et al. Immune-responsive gene 1 protein links metabolism to immunity by catalyzing itaconic acid production. Proc. Natl Acad. Sci. USA 110, 7820–7825 (2013). - PMC - PubMed
    1. Peace CG & O’Neill LA The role of itaconate in host defense and inflammation. J. Clin. Invest 132, e148548 (2022). - PMC - PubMed
    1. Cordes T et al. Immunoresponsive gene 1 and itaconate inhibit succinate dehydrogenase to modulate intracellular succinate levels. J. Biol. Chem 291, 14274–14284 (2016). - PMC - PubMed
    1. Swain A et al. Comparative evaluation of itaconate and its derivatives reveals divergent inflammasome and type I interferon regulation in macrophages. Nat. Metab 2, 594–602 (2020). - PMC - PubMed

MeSH terms

LinkOut - more resources