Review
. 2025 Apr;32(2):614-635.
doi: 10.3758/s13423-024-02578-1. Epub 2024 Oct 15.

Kelley's Paradox and strength skewness in research on unconscious mental processes

Affiliations
Review

Kelley's Paradox and strength skewness in research on unconscious mental processes

Daryl Y H Lee et al. Psychon Bull Rev. 2025 Apr.

Abstract

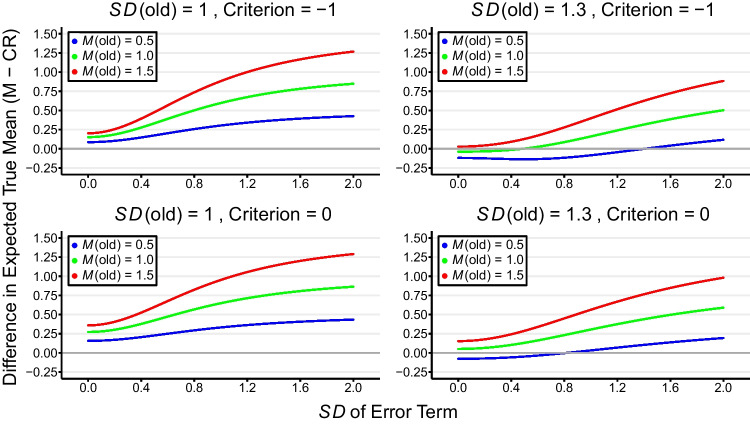
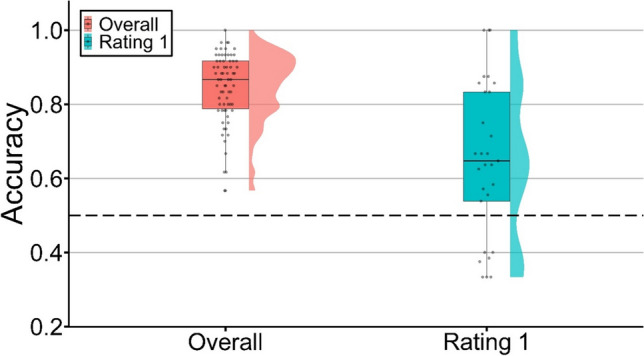
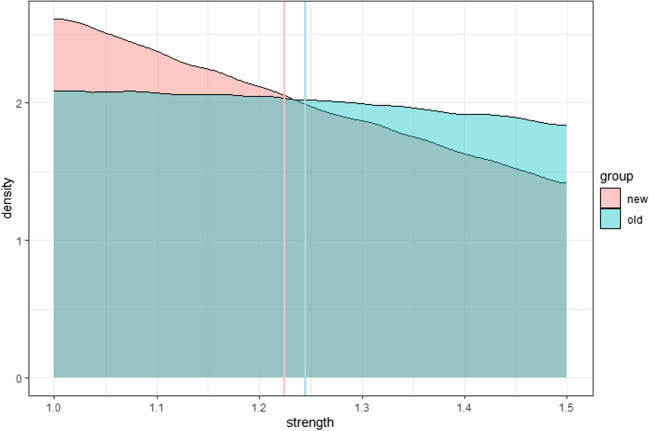
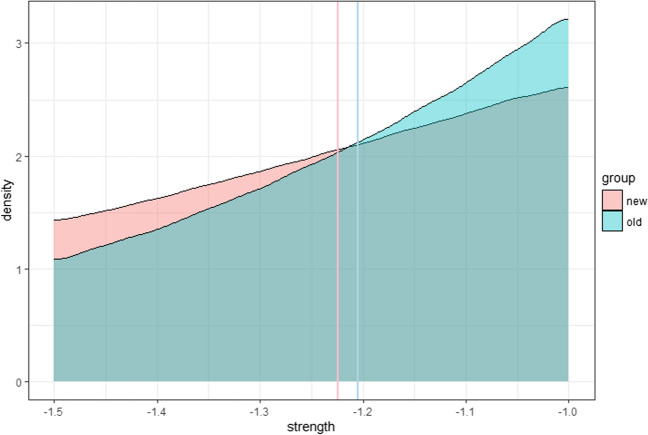
A widely adopted approach in research on unconscious perception and cognition involves contrasting behavioral or neural responses to stimuli that have been presented to participants (e.g., old items in a memory test) against those that have not (e.g., new items), and which participants do not discriminate in their conscious reports. We demonstrate that such contrasts do not license inferences about unconscious processing, for two reasons. One is Kelley's Paradox, a statistical phenomenon caused by regression to the mean. In the inevitable presence of measurement error, true awareness of the contrasted stimuli is not equal. The second is a consequence, within the framework of Signal Detection Theory, of unequal skewness in the strengths of target and nontarget items. The fallacious reasoning that underlies the employment of this contrast methodology is illustrated through both computational simulations and formal analysis, and its prevalence is documented in a narrative literature review. Additionally, a recognition memory experiment is reported which tests and confirms a prediction of our analysis of the contrast methodology and corroborates the susceptibility of this method to artifacts attributable to Kelley's Paradox and strength skewness. This work challenges the validity of conclusions drawn from this popular analytic approach.

Keywords: Implicit memory; Models of recognition memory; Recognition memory; Word recognition.


Conflict of interest statement

Declarations. Conflict of interest: The authors declare no conflict of interest. Ethics approval: The experiment reported was approved by the UCL Research Ethics Committee. Consent to participate: Informed consent was obtained from all individual participants included in the study. Consent for publication: Informed consent was obtained from all individual participants included in the study.

Figures

Fig. 1
Fig. 1
(A) Density distributions of observed scores. The vertical blue and red lines represent the observed score means for the advantaged and disadvantaged groups. The shaded area represents the selected observed scores between 48 and 52. (B) Divergence of true score means for participants falling within the shaded area in panel A. The vertical blue and red lines represent the true score means for the advantaged and disadvantaged subgroups
Fig. 2
Fig. 2
(A)-(D) Iso-probability curves of true and observed scores for advantaged and disadvantaged subgroups, at varying error SDs. The error SDs were set at 5, 10, 15, and 20 respectively, yielding reliabilities of 0.8, 0.5, 0.31, and 0.2. Contours represent lines of equal probability density, indicating regions where data points are equally likely to occur within the specific distributions of true and observed scores
Fig. 3
Fig. 3
Differential expected true means in memory strength between misses and correct rejections as a function of error SDs across various conditions. Each panel corresponds to distinct combinations of SDs of old items (1 and 1.3) and decision criteria (-1 and 0). SD(new) is set to 1 in all panels. The color-coded lines represent true mean memory strengths (0.5, 1.0, and 1.5) set for old items
Fig. 4
Fig. 4
Differential expected true means in memory strength between misses and correct rejections as a function of decision criteria (i.e., C) across different d′ values, assuming equal variances for old and new item distributions. Each of the ten curves represents a unique d′ value, ranging from 0.1 (the lowest curve) to 2.8 (the highest curve)
Fig. 5
Fig. 5
Respective distributions of mean overall accuracies and mean accuracies for trials rated 1. Each point represents a participant’s mean accuracy in selecting old words correctly. The dashed line represents accuracy at the chance level (i.e., 0.5)
Fig. 6
Fig. 6
Distribution of trial numbers across different accuracies. Each point represents a participant’s mean accuracy with the corresponding number of trials encountered. Overlapping points have been vertically jittered to avoid overlap. The dashed line represents accuracy at the chance level (i.e., 0.5)
Fig. 7
Fig. 7
Equal variance signal detection theory. The mean of the new item distribution is 0 and that of the old item distribution is 1.0. For both distributions the standard deviation σ = 1.0. The blue lines demarcate the interval [–1.5, –1.0] and the red lines the interval [1.0, 1.5]
Fig. 8
Fig. 8
Distributions of random numbers generated from truncated normal distributions in the interval [1.0, 1.5]. The pink distribution represents new items (mean = 0, σ = 1.0) and the blue distribution is for old items (mean = 1, σ = 1.0). The vertical lines mark the resulting mean values and illustrate the key strength skewness effect
Fig. 9
Fig. 9
Similar to Fig. 8 but for the interval [–1.5, –1.0]. The vertical lines mark the resulting mean values and illustrate the key strength skewness effect

Similar articles

References

    1. Addante, R. J. (2015). A critical role of the human hippocampus in an electrophysiological measure of implicit memory. NeuroImage,109, 515–528. 10.1016/j.neuroimage.2014.12.069 - PMC - PubMed
    1. Addante, R. J., Lopez-Calderon, J., Allen, N., Luck, C., Muller, A., Sirianni, L., Inman, C. S., & Drane, D. L. (2023). An ERP measure of non-conscious memory reveals dissociable implicit processes in human recognition using an open-source automated analytic pipeline. Psychophysiology,60(10), e14334. 10.1111/psyp.14334 - PMC - PubMed
    1. Arias, P., Belin, P., & Aucouturier, J. J. (2018). Auditory smiles trigger unconscious facial imitation. Current Biology,28, R782–R783. 10.1016/j.cub.2018.05.084 - PubMed
    1. Arnold, B. C., Beaver, R. J., Groeneveld, R. A., & Meeker, W. Q. (1993). The nontruncated marginal of a truncated bivariate normal distribution. Psychometrika,58(3), 471–488. 10.1007/BF02294652
    1. Barnett, A. G., van der Pols, J. C., & Dobson, A. J. (2005). Regression to the mean: What it is and how to deal with it. International Journal of Epidemiology,34(1), 215–220. 10.1093/ije/dyh299 - PubMed

LinkOut - more resources