. 2025 May;30(5):1780-1790.
doi: 10.1038/s41380-024-02785-1. Epub 2024 Oct 15.

Characterization of patients with major psychiatric disorders with AMPA receptor positron emission tomography

Affiliations

Characterization of patients with major psychiatric disorders with AMPA receptor positron emission tomography

Mai Hatano et al. Mol Psychiatry. 2025 May.

Abstract

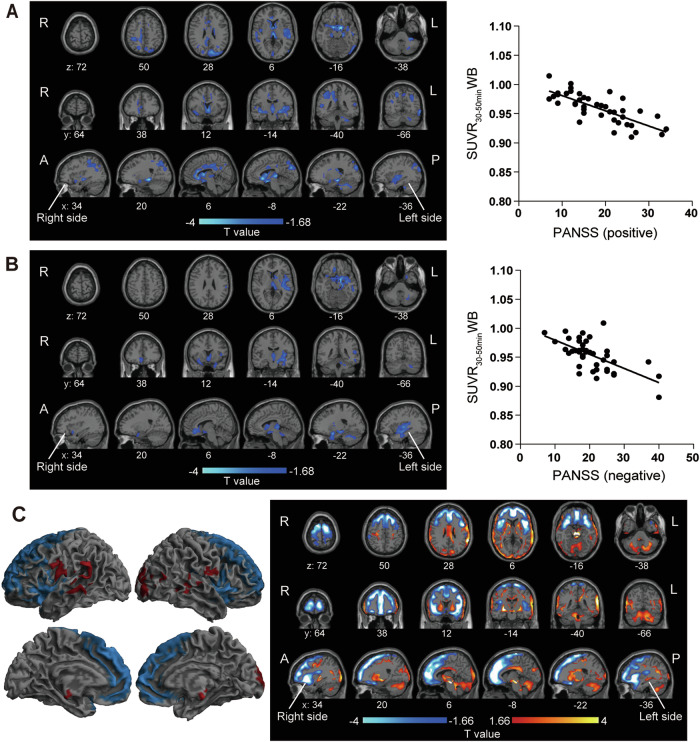
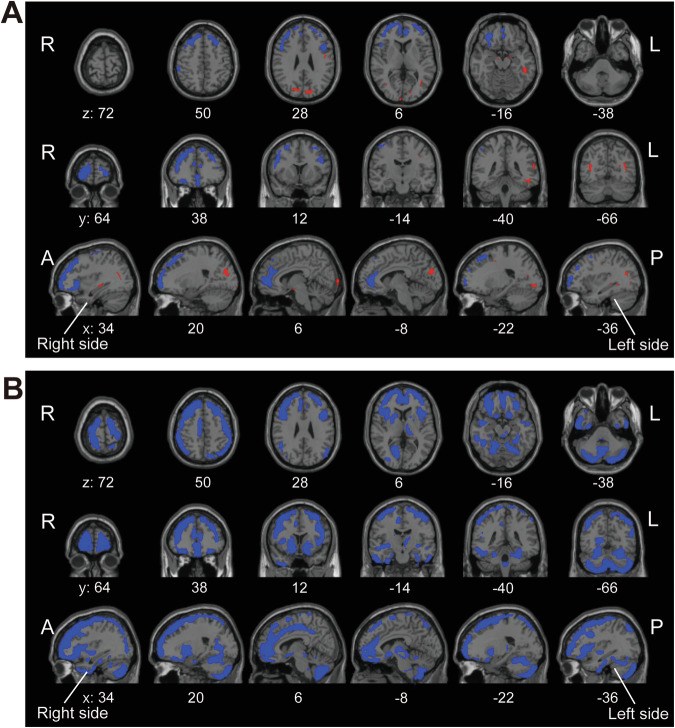
Synaptic phenotypes in living patients with psychiatric disorders are poorly characterized. Excitatory glutamate α-amino-3-hydroxy-5-methyl-4-isoxazole propionic acid receptor (AMPAR) is a fundamental component for neurotransmission. We recently developed a positron emission tomography (PET) tracer for AMPAR, [11C]K-2, the first technology to visualize and quantify AMPARs density in living human brain. In this study, we characterized patients with major psychiatric disorders with [11C]K-2. One hundred forty-nine patients with psychiatric disorders (schizophrenia, n = 42; bipolar disorder, n = 37; depression, n = 35; and autism spectrum disorder, n = 35) and 70 healthy participants underwent a PET scan with [11C]K-2 for measurement of AMPAR density. We detected brain regions that showed correlation between AMPAR density and symptomatology scores in each of four disorders. We also found brain areas with significant differences in AMPAR density between patients with each psychiatric disorder and healthy participants. Some of these areas were observed across diseases, indicating that these are commonly affected areas throughout psychiatric disorders. Schizophrenia, bipolar disorder, depression, and autism spectrum disorder are uniquely characterized by AMPAR distribution patterns. Our approach to psychiatric disorders using [11C]K-2 can elucidate the biological mechanisms across diseases and pave the way to develop novel diagnostics and therapeutics based on the synapse physiology.


Conflict of interest statement

Competing interests: TT and TM are the inventors of a patent application for a novel compound that specifically binds to the AMPA receptor (WO 2017006931), including [11C]K-2. TT, TM and TA are the founders and also stockholders of AMPAMETRY, Inc., which holds the exclusive license to use [11C]K-2. No other potential conflicts of interest relevant to this article exist.

Figures

Fig. 1
Fig. 1. State regions and altered AMPAR distribution in patients with schizophrenia compared with healthy participants.
A Brain regions showing a significant negative correlation between SUVR30–50 minWB and PANSS score for positive symptoms in patients with schizophrenia (P < 0.05, T < −1.68, one-tailed, FDRc). Significant clusters displayed on an axial, coronal and sagittal slices (Left), and scatter plot between averaged SUVR30–50 minWB in significant clusters and PANSS scores for positive symptoms (Right, two-tailed Pearson correlation analysis: correlation coefficient = −0.7514, P < 0.0001). B Brain regions showing a significant negative correlation between SUVR30–50 minWB and PANSS score for negative symptoms in patients with schizophrenia (P < 0.05, T < −1.68, one-tailed, FDRc). Significant clusters displayed on an axial, coronal and sagittal slices (Left), and scatter plot between averaged SUVR30–50 minWB in significant clusters and PANSS score for negative symptoms (Right, two-tailed Pearson correlation analysis: correlation coefficient = −0.6371, P < 0.0001). C Relative reduction (blue) and increase (red) of [11C]K-2 retention in patients with schizophrenia compared to healthy participants (P < 0.05, increase of [11C]K-2 retention: T > 1.66, reduction of [11C]K-2 retention: T < −1.66, one-tailed, FDRc). Significant clusters displayed on a 3D-rendered brain (binary image, Left), and axial, coronal and sagittal slices (T-map, Right). A, B and C (right panel) were adjusted for covariates (age, sex). C (left panel) was not adjusted for covariates.
Fig. 2
Fig. 2. State regions and altered AMPAR distribution in patients with bipolar disorder compared with healthy participants.
A Brain regions showing a significant negative (blue) and positive (red) correlation between SUVR30-50minWB and the 17-item HAM-D score in patients with bipolar disorder (P < 0.05, positive correlation: T > 1.69, negative correlation: T < −1.69, one-tailed, FDRc). Significant clusters displayed on an axial, coronal and sagittal slices (Left), and scatter plot between averaged SUVR30–50 minWB in significant clusters and HAM-D score (Right, two-tailed Pearson correlation analysis: positive correlation; correlation coefficient = 0.6841, P < 0.0001, negative correlation; correlation coefficient = −0.5208, P = 0.001). B Brain regions showing a significant negative (blue) and positive (red) correlation between SUVR30–50 minWB and YMRS score in patients with bipolar disorder (P < 0.05, positive correlation: T > 1.69, negative correlation: T < −1.69, one-tailed, FDRc). Significant clusters displayed on an axial, coronal, and sagittal slices (Left), and scatter plot between averaged SUVR30–50 minWB in significant clusters and YMRS score (Right, two-tailed Pearson correlation analysis: positive correlation; correlation coefficient = 0.5842, P = 0.0001, negative correlation; correlation coefficient = −0.7012, P < 0.0001). C Relative reduction (blue) and increase (red) of [11C]K-2 retention in patients with bipolar disorder compared to healthy participants (P < 0.05, increase of [11C]K-2 retention: T > 1.66, reduction of [11C]K-2 retention: T < −1.66, one-tailed, FDRc). Significant clusters displayed on a 3D-rendered brain (binary image, Left), and axial, coronal, and sagittal slices (T-map, Right). A, B and C (right panel) were adjusted for covariates (age, sex). C (left panel) was not adjusted for covariates.
Fig. 3
Fig. 3. State regions in depression.
A Brain regions showing a significant negative correlation between SUVR30–50 minWB and the 17-item HAM-D score in patients with depression (P < 0.05, T < −1.69, one-tailed, FDRc). Significant clusters displayed on an axial, coronal and sagittal slices (Left), and scatter plot between averaged SUVR30–50 minWB in significant clusters and HAM-D score (Right, two-tailed Pearson correlation analysis: correlation coefficient = −0.5479, P = 0.0007). B Brain regions showing a significant negative correlation between SUVR30–50 minWB and the 17-item HAM-D score in patients with depression as determined above (blue) and bipolar disorder (green) (P < 0.05, T < −1.69, one-tailed, FDRc). Red regions show where the two regions overlap. MNI coordinates for the z-axis (axial slices), y-axis (coronal slices) and x-axis (sagittal slices) were shown bottom of each slice. C No significant difference of SUVR30–50 minWB between the patients with depression and healthy participants. All panels were adjusted for covariates (age, sex).
Fig. 4
Fig. 4. State regions and altered AMPAR distribution in patients with ASD compared with healthy participants.
A Brain regions showing a significant positive correlation between SUVR30–50 minWB and ADOS-2 Module 4 CSS in patients with ASD (P < 0.05, T > 1.69, one-tailed, FDRc). Significant clusters displayed on an axial, coronal, and sagittal slices (Left), and scatter plot between averaged SUVR30–50 minWB in significant clusters and ADOS-2 Module 4 CSS (Right, two-tailed Pearson correlation analysis: correlation coefficient = 0.6027, P = 0.0001). B Relative reduction (blue) and increase (red) of [11C]K-2 retention in patients with ASD compared to healthy participants (P < 0.05, increase of [11C]K-2 retention: T > 1.66, reduction of [11C]K-2 retention: T < −1.66, one-tailed, FDRc). Significant clusters displayed on a 3D-rendered brain (binary image, Left), and axial, coronal and sagittal slices (T-map, Right). A and B (right panel) were adjusted for covariates (age, sex). B (left panel) was not adjusted for covariates.
Fig. 5
Fig. 5. Commonly affected areas across psychiatric disorders.
A Common brain regions showing reduced (blue) and increased (red) SUVR30–50 minWB, respectively, in patients with schizophrenia, bipolar disorder and ASD compared with healthy participants. B Common brain regions showing reduced (blue) SUVR30–50 minWM, in patients with schizophrenia, bipolar disorder and ASD compared with healthy participants. MNI coordinates for the z-axis (axial slices), y-axis (coronal slices) and x-axis (sagittal slices) were shown bottom of each slice.

References

    1. Nevarez-Flores AG, Sanderson K, Breslin M, Carr VJ, Morgan VA, Neil AL. Systematic review of global functioning and quality of life in people with psychotic disorders. Epidemiol Psychiatr Sci. 2019;28:31–44. - PMC - PubMed
    1. Jin H, Mosweu I. The societal cost of schizophrenia: a systematic review. Pharmacoeconomics. 2017;35:25–42. - PubMed
    1. Bessonova L, Ogden K, Doane MJ, O’Sullivan AK, Tohen M. The economic burden of bipolar disorder in the United States: a systematic literature review. ClinicoEcon Outcomes Res. 2020;12:481–97. - PMC - PubMed
    1. American Psychiatric Association. Diagnostic and statistical manual of mental disorders 5th ed. Wahington, DC: American Psychiatric Publishing; 2013.
    1. Hantouche EG, Akiskal HS, Azorin JM, Châtenet-Duchêne L, Lancrenon S. Clinical and psychometric characterization of depression in mixed mania: a report from the French National Cohort of 1090 manic patients. J Affect Disord. 2006;96:225–32. - PubMed

LinkOut - more resources