. 2024 Oct 15;7(1):1331.
doi: 10.1038/s42003-024-06939-3.

Transcriptome and acetylome profiling identify crucial steps of neuronal differentiation in Rubinstein-Taybi syndrome

Affiliations

Transcriptome and acetylome profiling identify crucial steps of neuronal differentiation in Rubinstein-Taybi syndrome

Julien Van Gils et al. Commun Biol. .

Abstract

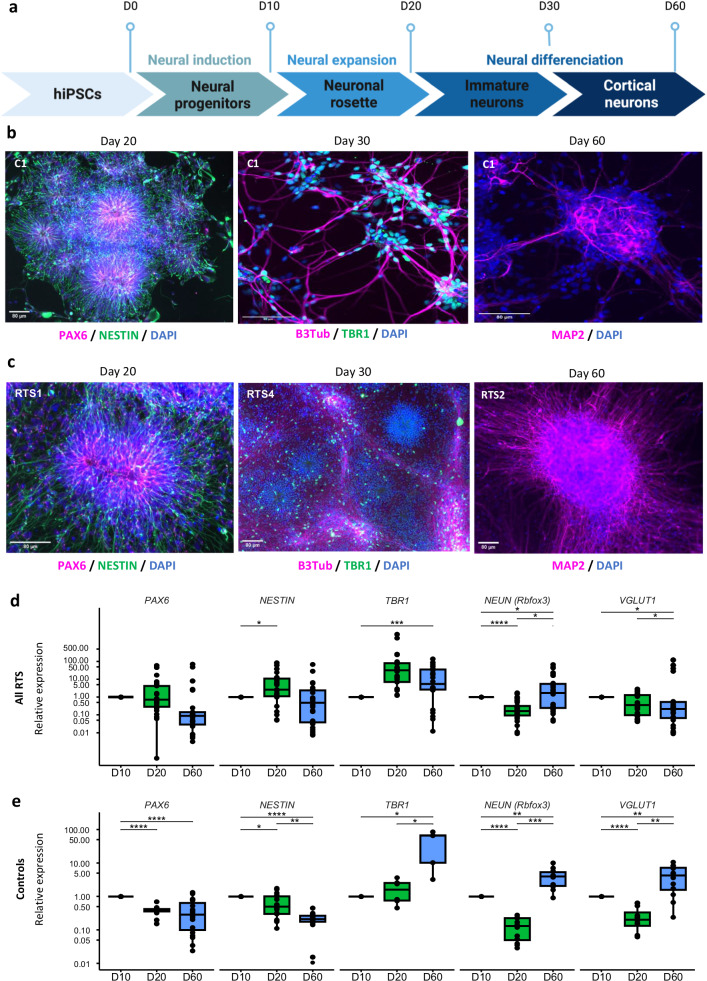
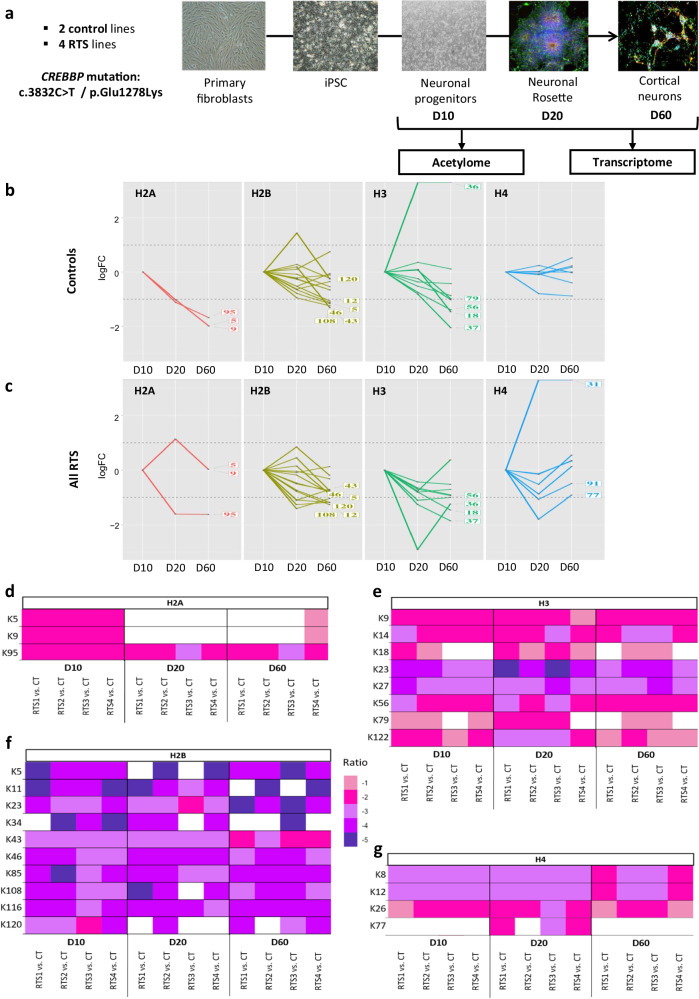
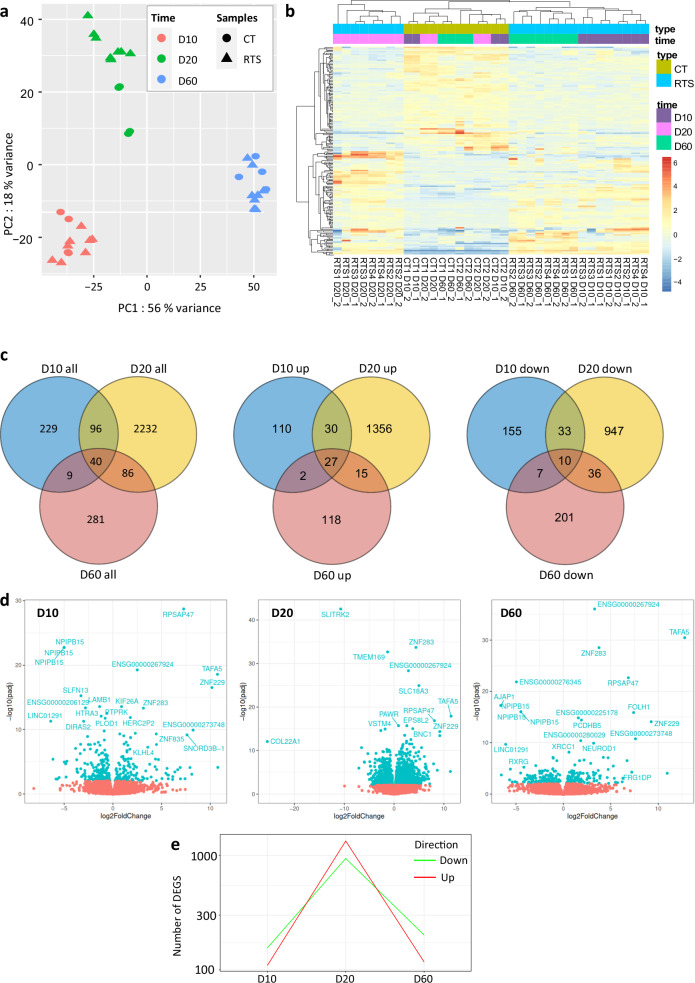
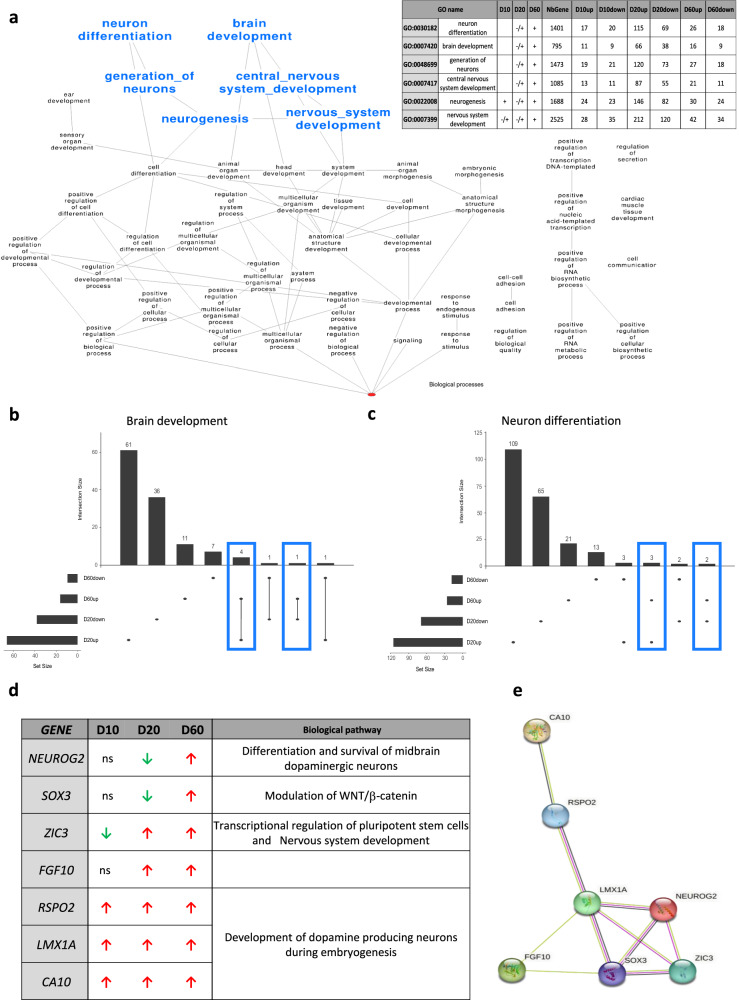
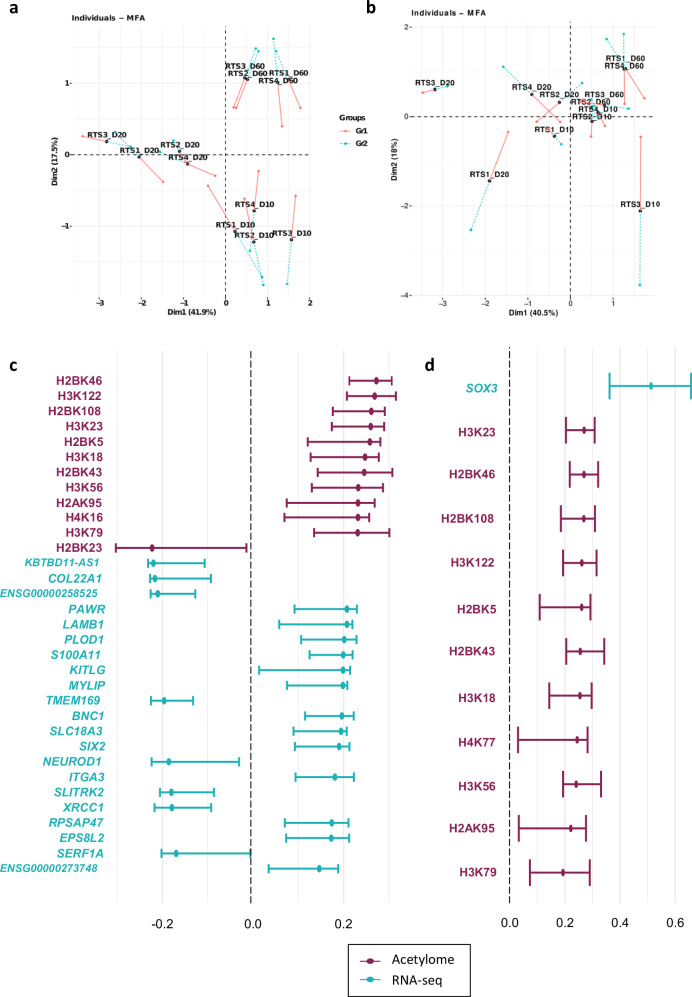
Rubinstein-Taybi syndrome (RTS) is a rare and severe genetic developmental disorder characterized by multiple congenital anomalies and intellectual disability. CREBBP and EP300, the two genes known to cause RTS encode transcriptional coactivators with a catalytic lysine acetyltransferase (KAT) activity. Loss of CBP or p300 function results in a deficit in protein acetylation, in particular at histones. In RTS, nothing is known on the consequences of the loss of histone acetylation on the transcriptomic profiles during neuronal differentiation. To address this question, we differentiated induced pluripotent stem cells from RTS patients carrying a recurrent CREBBP mutation that inactivates the KAT domain into cortical and pyramidal neurons. By comparing their acetylome and their transcriptome at different neuronal differentiation time points, we identified 25 specific acetylated histone residues altered in RTS. We also identified the transition between neural progenitors and immature neurons as a critical step of the differentiation process, with a delayed neuronal maturation in RTS. Overall, this study opens new perspectives in the definition of epigenetic biomarkers for RTS, whose methodology could be extended to other chromatinopathies.


Conflict of interest statement

The authors declare no competing interest.

Figures

Fig. 1
Fig. 1. Morphological and molecular characterization of hiPSC-derived neurons during neuronal differentiation of controls and Rubinstein–Taybi syndrome (RTS) hiPSC.
a Timeline of the main steps of neuronal differentiation from hIPSCs to mature cortical neurons. The protocol was adapted from Shi et al.. b, c Immunofluorescence characterization during neuronal differentiation for controls (b) and RTS patients (c). Positive staining of neuronal progenitor at D20 for the NESTIN and PAX6 markers. Transition to immature neurons occurs between D20 and D30 as evidenced by positive staining for B3Tub (pan-neuronal marker) and TBR1 (Immature neurons). The neural network gradually develops from the periphery of neural rosettes. The mature neuronal network is evidenced at D60 by a positive staining to MAP2 (mature cortical neurons). Nuclei are counterstained with DAPI. d, e Molecular characterization of controls (d) and RTS patients (e) during neuronal differentiation. Gene expression level was determined by RT-qPCR at 3 different time points (D10–D20–D60). D10 was used as the reference as most genes are not expressed in hiPSCs. Expression was normalized to two housekeeping genes (HPRT and PPIA). The box plots (green for D20 and blue for D60 display the median relative expression level. The lower (Q1) and upper (Q3) quartile represent data outside the 9–91 percentile range. Data falling outside the Q1–Q3 range are plotted as outliers. All data points for control samples are presented as the result of two biological replicates followed by two technical replicates. All data points for RTS samples are presented as the result of four biological replicates followed by two technical replicates. Statistical significance was determined using an F-test on two-way ANOVA for paired sample analysis and p-values were corrected for multiple comparison using Benjamini-Hochberg control of the false discovery rate, with * :p value < 0.05, ** :p value < 0.005, *** :p value < 0.0005, and **** :p value < 0.00005.
Fig. 2
Fig. 2. Acetylome profiling during neuronal differentiation of controls and RTS patients hiPSCs.
a Schematic overview of the samples used and steps of analysis. hiPSCs were derived from primary fibroblasts from two healthy donors (controls) and four patients affected with RTS carrying the same CREBBP mutation: c.3832 C > T/p.Glu1278Lys. All hiPSCs clones were differentiated into cortical and pyramidal neurons. Acetylome analysis by mass spectrometry (LC–MS/MS) focused on core histones proteins (H2A, H2B, H3, and H4) and gene expression analysis by high-throughput RNA-sequencing was performed at three time points during the differenciation process (D10, D20, and D60). For each condition, two biological replicates corresponding to two independent differentiation experiments were used. b, c Kinetics of histone acetylation for H2A, H2B, H3, and H4 during neuronal differentiation at D10, D20, and D60 in controls (b) and RTS patients (c). The log2 ratio for each acetylation site of the indicated histones is shown for each time point. An acetylation site is considered hypoacetylated with a log2ratio ≤ 1 and hyperacetylated with a log2ratio ≥ 1 and the position is labeled on each graph. D10 was chosen as the reference value for the analysis. dg Mapping of differential analysis of acetylome of CBP-dependent histone marks during neuronal differentiation in RTS patients compared to controls. Heatmaps of the acetylome during neuronal differentiation. The heatmaps display the log2 ratios for acetylation sites on the protein core histones H2A (d), H2B (e), H3 (f), and H4 (g) for each RTS patient (RTS1–RTS4) compared to controls at the 3 time points of the neuronal differentiation (D10, D20 and D60). An acetylation site is considered hypoacetylated with a log2ratio ≤ 1 and is displayed as a magenta gradient. Values with a log2ratio between −1 and 1 are shown in white. We considered a candidate histone mark altered in RTS as mark that is hypoacetylated in at least 3 out of the 4 RTS patients analyzed and for at least 1 out of the 3 time points.
Fig. 3
Fig. 3. The neural progenitor/immature neuron transition appears as a key stage of neuronal development in RTS.
a PCA of gene expression data for the 1000 most variable genes for all patients and controls. The two major components are shown (PC1, x-axis; PC2, y-axis). b Heatmap of control- and RTS-derived neurons at D10 (red), D20 (green), and D60 (blue), showing that RTS patients cluster separately from controls at D20, suggesting a different expression profile at this transition time point between neural progenitors and immature neurons. Only genes with padj < 0.01 and |log2FC| ≥ 1 are shown. c Venn diagram comparing the DEGs found at the three differentiation time points in RTS versus control cells. The comparison is performed for all (left), upregulated (middle) and downregulated (right) DEGs. d Volcano plot of differentially expressed genes (DEG) during neuronal differentiation at D10 (left), D20 (middle), and D60 (right) comparing expression in all patients versus controls. The x-axis corresponds to the log2Foldchange. The significance threshold is set at |log2Foldchange| ≥ 1. The y-axis corresponds to the −10log of the adjusted pvalue that indicates the level of expression difference. Blue dots correpond to significantly deregulated genes in patients compared to controls. e Representation of the evolution of the number of upregulated and downregulated DEGs in RTS patients vs controls during neuronal differentiation, showing a substantial increase of DEGs with a reversal of the upregulated vs. downregulated DEGs ratio transiently at D20.
Fig. 4
Fig. 4. Biological processes (BP) related to neurodevelopment suggest altered neuronal identity in Rubinstein-Taybi syndrome (RTS).
a Hierarchical overrepresentation of biological processes (BP) identified in three or more conditions based on enrichment analysis of up and downregulated DEGs at the three time points of neuronal differentiation (D10–D20–D60) in RTS patients vs controls. Data were filtered on −1 < FC > 1 and FDR < 0.05. The 50 identified Gene Ontology (GO)-terms are represented. Two branches are distinguished. The neurodevelopment related GO-terms are shown in bold and blue and their profile during neuronal differentiation is detailed in the table. We focused further analysis on the DEGS of the two most specific GO-term for each branch, brain development and neuron differentiation. b, c Upset plot of the two BP of interest: brain development (b) and neuron differentiation (c). As these two GOs are only identified at D20 and D60, only the number of DEGs from these two time points are shown. Based on the profiles from the table (a), we identified five DEGs for “Brain development” and five DEGs for “Neuron differentiation” that are up or downregulated at D20 and upregulated at D60 (blue border). Three DEGs being common to both lists, we retained seven DEGs (d). d List of the seven selected DEGs associated to neurodevelopment. The direction of deregulation of RTS cells versus control cells is indicated for each time point according to Log FC when significant: downregulated gene in green (LogFC < 1) and upregulated gene in red (LogFC > 1). BPs associated to each gene are indicated. e Protein–protein interactions for the seven neurodevelopment-associated DEGs. The pink lines correspond to experimentally determined interactions, the green lines to text minning and the black lines to co-expression.
Fig. 5
Fig. 5. Integrative analysis of Acetylome and RNA-seq highlights histone marks and genes specifically involved in the crucial step of neuronal differentiation in RTS.
a Individual plot of multifactorial analysis (MFA) integrating the two data types: Gr1 (Acetylome) data corresponds to the logFC for acetylation of 25 histones marks provided by the acetylation analysis. For data of Gr2, the logFC of the top DEG genes is provided by the DESeq2 DEG analysis. At each time points, all controls samples are pooled to serve as baseline for individual acetylation or DEG analysis of RTS samples. As in Fig. 3a, the strongest signal (component 1) separates D20 samples from D10 and D60. b Individual plots of MFA analysis focused on neurone development. The analysis integrates two groups data types. Gr1 are similar to in (a). For Gr2, the analysis is restricted to the logFC of the seven selected genes related to neurone development. As in panel (a), the strongest signal (component 1) for RTS samples vs controls separates D20 samples from D10 and D60. c The barplot shows the Confidence Intervals for variable weights driving Component 1 of MFA analysis in (a). Only variables with robust contribution to component 1 are shown: CI do not overlap with 0 on 2000 fold Bootstrap. Except for H2BK23, all histone marks show stronger hypoacetlylation for RTS samples vs controls at D20 (vs. D10 and D60). Correspondingly, positive weights shows DEGs for RTS samples vs. controls that are more strongly downregulated at D20 (vs. D10 and D60) and negative weights corresponds to DEGs for RTS vs controls that are less downregulated at D20 (vs. D10 and D60). d The barplot shows the Confidence Intervals for variable weights in Component 1 for the MFA in (b). Only variables with robust contribution to component 1 are shown: CI do not overlap with 0 on 500-fold Bootstrap. All variable weights are positive: for RTS samples vs. controls. SOX3 gene shows a stronger downregulation at D20 (vs. D10 and D60), as well as stronger hypoacetylation of 11 histone marks at D20 (vs. D10 and D60).

References

    1. Fahrner, J. A. & Bjornsson, H. T. Mendelian disorders of the epigenetic machinery: postnatal malleability and therapeutic prospects. Hum. Mol. Genet.28, R254–R264 (2019). - PMC - PubMed
    1. Rubinstein, J. H. Broad thumb-hallux (Rubinstein-Taybi) syndrome 1957–1988. Am. J. Med. Genet.37, 3–16 (1990). - PubMed
    1. Hennekam, R. C. M. Rubinstein–Taybi syndrome. Eur. J. Hum. Genet.14, 981–985 (2006). - PubMed
    1. Van Gils, J., Magdinier, F., Fergelot, P. & Lacombe, D. Rubinstein-Taybi syndrome: a model of epigenetic disorder. Genes12, 968 (2021). - PMC - PubMed
    1. Bartsch, O. et al. DNA sequencing of CREBBP demonstrates mutations in 56% of patients with Rubinstein–Taybi syndrome (RSTS) and in another patient with incomplete RSTS. Hum. Genet.117, 485–493 (2005). - PubMed

MeSH terms

LinkOut - more resources