. 2024 Oct 15;22(1):625.
doi: 10.1186/s12951-024-02876-9.

NIR-II light based combinatorial management of hypertrophic scar by inducing autophagy in fibroblasts

Affiliations

NIR-II light based combinatorial management of hypertrophic scar by inducing autophagy in fibroblasts

Yunxian Dong et al. J Nanobiotechnology. .

Abstract

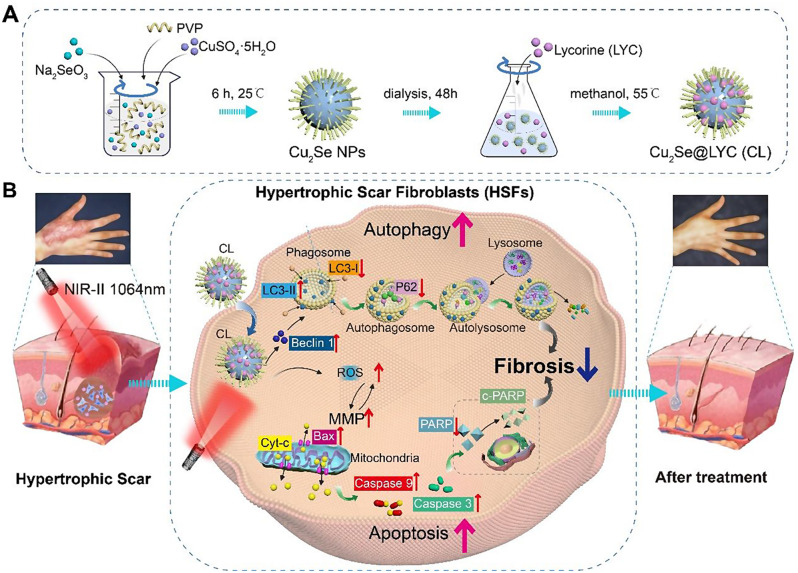
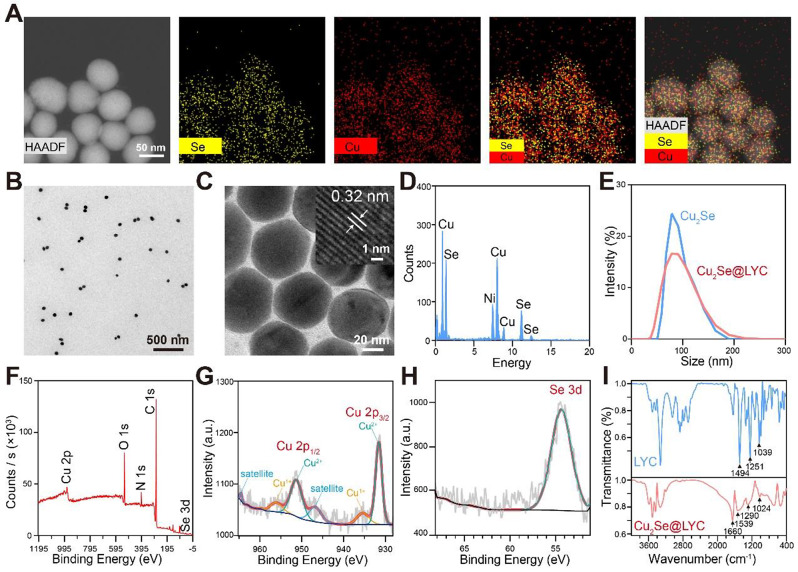
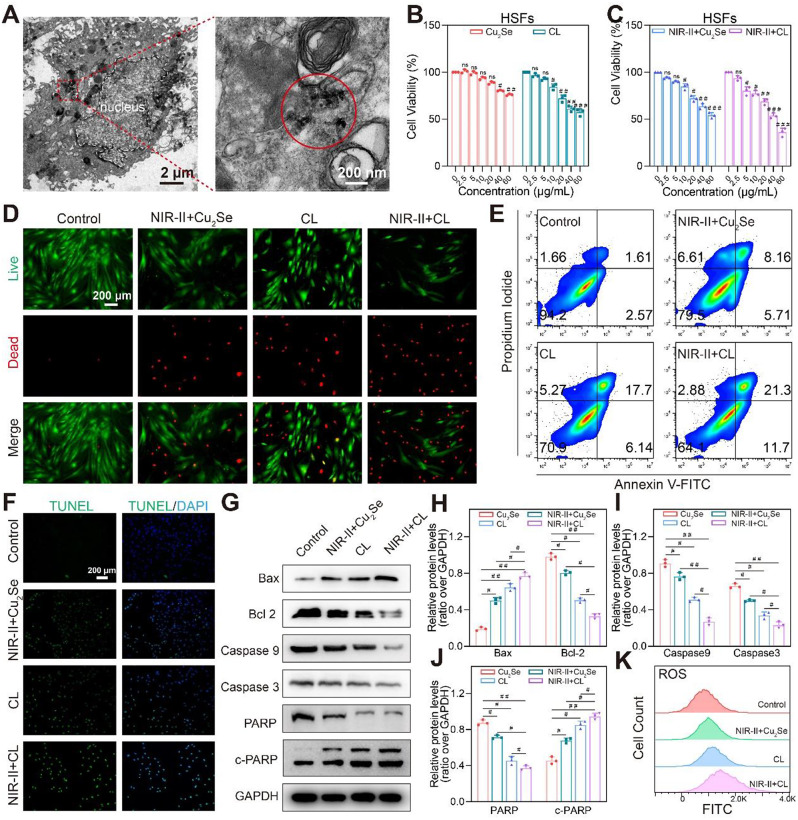
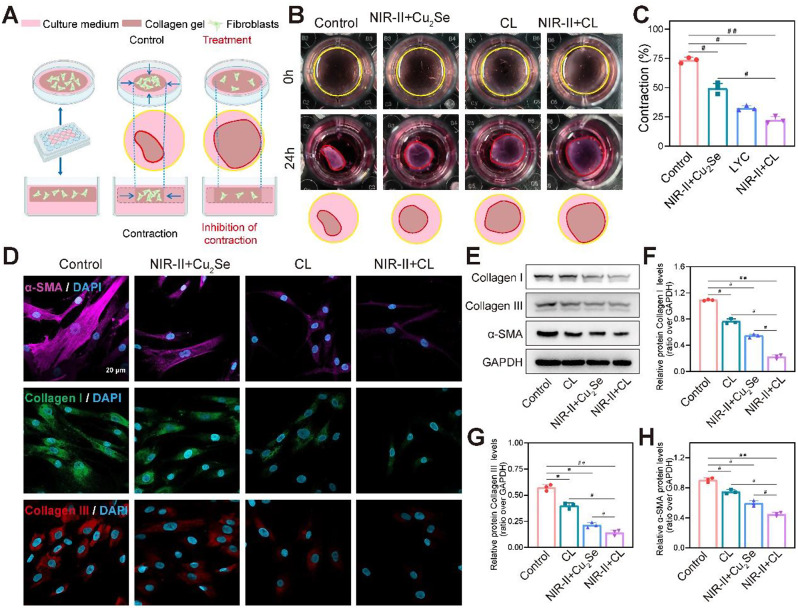
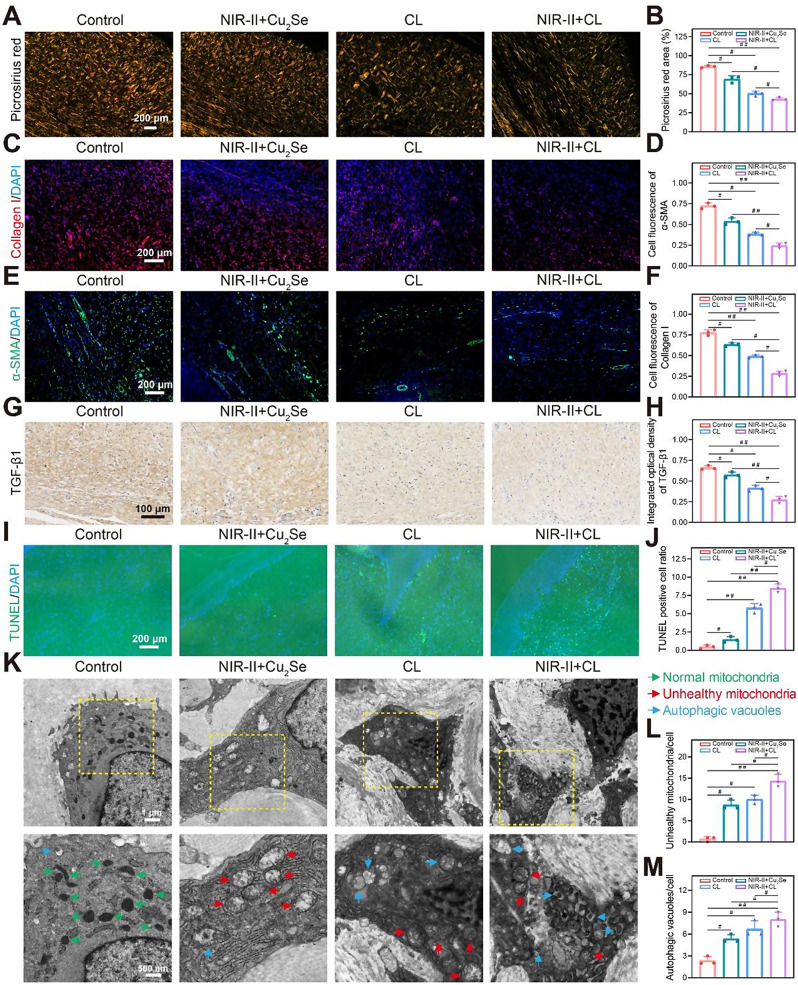
The hypertrophic scar (HS) is a prevalent cutaneous fibrotic disorder that impacts both the aesthetic and functional aspects of the skin, there is an urgent need for a highly safe and effective approach to address the challenge of HS with thick and deep types. Inspired by the superior deep tissue penetrative ability of near-infrared-II (NIR-II) light and potential mitochondria ROS inducing effect of Chinese medicine lycorine (LYC), we fabricated a Cu2Se@LYC (CL) composite by encapsulating LYC on polyvinyl pyrrolidone (PVP) modified Cu2Se nanoparticles. After NIR-II irradiation, CL could induce the generation of reactive oxygen species (ROS) and mitochondrial damage in hypertrophic scar fibroblasts (HSFs). The subsequent release of cytochrome C (cyt-c) from mitochondria into the cytoplasm and upregulation of beclin1 leads to the activation of endogenous apoptosis and autophagy-mediated cell death. The CL + NIR-II treatment exhibited a pronounced anti-scarring effect in both in vitro and in vivo rabbit ear scar models, leading to a significant reduction in the fibrotic markers including Collagen I/III and α-smooth muscle actin (α-SMA). This study comprehensively investigated the crucial role of HSFs' autophagy in scar management and proposed a safe and effective therapy based on NIR-II laser for clinical application.

Keywords: Apoptosis; Autophagy; Hypertrophic scar; Lycorine; Photothermal therapy.


Conflict of interest statement

The authors declare no competing interests.

Figures

Scheme 1
Scheme 1
Scheme1 Schematic of Cu2Se@LYC NPs (CL) combined with NIR-II (1064 nm) phototherapy for hypertrophic scar (HS). (A) Process of CL preparation. (B)The NIR-II laser illumination and CL collectively induce endogenous apoptosis and autophagic cell death in hypertrophic scar fibroblasts (HSFs).
Fig. 1
Fig. 1
Characterization of Cu2Se@LYC (A) High-angle annular dark-field TEM image and elemental mapping of Cu2Se NPs. (B) TEM images of Cu2Se NPs. (C) HRTEM image of Cu2Se NPs with the detail and the interplanar spacing. (D) EDS mapping and (E) hydrodynamic diameter distribution of Cu2Se NPs. XPS of (F) Cu2Se, (G) Cu2p and (H) Se3d. (I) FTIR spectra of Cu2Se and CL NPs
Fig. 2
Fig. 2
Identification of photothermal properties of CL. (A) UV-vis-NIR spectra of Cu2Se, lycorine and CL. (B) Temperature curves and (C) typical photothermal images of distilled water and different concentrations (10 µg/mL, 25 µg/mL, 50 µg/mL, and 100 µg/mL) of Cu2Se under fixed 1064 nm laser irradiation (1.00 W/cm2). (D) Temperature changes and (E) representative photothermal images of distilled water and 50 µg/mL Cu2Se under different laser intensities (0.50, 0.75, 1.00, and 1.50 W/cm2). (F,G) Photothermal conversion efficiency of Cu2Se NPs. (H) Temperature change curve of photothermal stability of Cu2Se. (I) The temperature rise curves and (J) photothermal images of distilled water, Cu2Se, and CL under laser irradiation (1064 nm, 1.00 W/cm2). (K) Schematic diagram of laser penetration detection. (L) The temperature changes of CL solution after two kinds (808 nm and 1064 nm) of laser penetrate pig skin of different thickness (n = 3). Data are presented as mean ± SD. # indicates p < 0.05
Fig. 3
Fig. 3
The pro-apoptotic efficacy of CL NPs on HSFs in vitro. (A) Electron microscopy image depicting the uptake of CL NPs by HSFs. Cytotoxicity of Cu2Se and CL combined with or without NIR-II to HSFs at different concentrations of for (B) 12 h and (C) 24 h (n = 3). (D) Cell live/dead images under different treatments. (E) Flow cytometry images and (F) TUNEL staining images of apoptotic HSFs treated with Cu2Se and CL with or without laser irradiation. (G) Western blot analysis of apoptosis-related proteins and (H-J) corresponding statistical results. (K) Flow cytometry analysis of ROS levels using the DCFH-DA probe under various treatments. Data are presented as mean ± SD. # indicates p < 0.05; ## indicates p < 0.01; ### indicates p < 0.001. ns
Fig. 4
Fig. 4
The combination of NIR-II and CL induced mitochondrial damage and triggered autophagy-mediated cell death. (A) Representative fluorescent image of cells labeled with JC-1 under different treatments and (B-D) their statistical results. (E) Western blot analysis and (F) Statistical analysis of cytochrome-c protein expression in cytoplasm and mitochondria of HSFs exposed to laser irradiation or NPs treatments. (G) Bio-TEM images of mitochondria and autophagosome microstructure of cells in different treatment groups (green arrow: healthy mitochondria; red arrow: unhealthy mitochondria; yellow arrow: autophagic vacuoles). (H) Western blot results of autophagy associated proteins (Beclin 1, LC3 and P62). (I) Immunofluorescence staining image of LC3-II after Cu2Se and CL treatemnts with or without laser irradiation. (J) The mechanism diagram of IR-II combined with CL promoting autophagic death. Data are presented as mean ± SD. # indicates p < 0.05; ## indicates p < 0.01; ### indicates p < 0.001
Fig. 5
Fig. 5
1064 nm laser-assisted lycorine therapy effectively mitigates fibrotic levels in HSFs. (A) Schematic illustration of collagen gel contraction assay. (B) The image of HSFs cultured in rat tail collagen after different treatments. (C) Statistical analysis of the collagen contraction rate. (D) Immunofluorescence staining images of typical fibrosis markers (α-SMA, Collagen I, Collagen III) in HSFs exposed to or without laser light combine with Cu2Se and CL. (E) western blot assay data and (F-H) statistical calculation on the expression levels of α-SMA, Collagen I, and Collagen III in HSFs after treatment with different formulations. Data are presented as mean ± SD. ns indicates no significance, # indicates p < 0.05; ## indicates p < 0.01; ### indicates p < 0.001
Fig. 6
Fig. 6
Photothermal properties of CL and its effect on rabbit ear scars in vivo (A) Timeline and schematic diagram of rabbit ear scar modeling and treatment. (B) Image of grouping distribution on rabbit ear scars 14 days after modeling. (C) The temperature change curve and (D) photothermal image in various treatment groups were acquired within 9 min (heating 6 min, cooling 3 min), with or without laser irradiation laser irradiation. (E) A follow-up image of the appearance of scar in rabbit ears after 1 - and 3-week treatment. (F) Diagram of scar elevation index calculation (SEI). (G) SEI assay calculated from HE staining. (H) H&E staining images of rabbit ear scars after different treatments. Data are presented as mean ± SD. # indicates p < 0.05; ## indicates p < 0.01; ### indicates p < 0.001
Fig. 7
Fig. 7
Impact of a photothermal therapy system on fibroblast fibrosis and autophagic cell death in rabbit ear scars in vivo. (A) Representative picrosirius red stained images under polarized light of rabbit ear scars in different treatment groups (n = 3) and (B) its statistical analysis results. Immunofluorescence staining images and statistical analysis of fluorescence intensity of Collagen I (C, D) and α-SMA (E, F) in rabbit ear scar tissues (n = 3). (G) Immunohistochemical staining images of TGF-β1 in different treatment groups of rabbit ear scars (n = 3). (H) Results of statistical analysis of TGF levels. (I, J) Representative images of TUNEL staining and statistically analysis of rabbit ear scars after Cu2Se, CL treatment and with or without laser irradiation (n = 3). (K) Electron microscope images showed the microstructure of rabbit ear scar tissue after different treatments (green arrow: healthy mitochondria; red arrow: unhealthy mitochondria; yellow arrow: autophagic vacuoles, n = 3). (L, M) Calculation of the number of unhealthy mitochondria and autophagy vacuoles. Data are presented as mean ± SD. ns indicates no significance, # indicates p < 0.05; ## indicates p < 0.01; ### indicates p < 0.001

References

    1. Finnerty CC, Jeschke MG, Branski LK, Barret JP, Dziewulski P, Herndon DN. Hypertrophic scarring: the greatest unmet challenge after burn injury. Lancet. 2016;388(10052):1427–36. - PMC - PubMed
    1. Ogawa R. The most current algorithms for the Treatment and Prevention of Hypertrophic Scars and keloids: a 2020 update of the algorithms published 10 years ago. Plast Reconstr Surg. 2022;149(1):e79–94. - PMC - PubMed
    1. Obaidi N, Keenan C, Chan RK. Burn Scar Management and reconstructive surgery. Surg Clin North Am. 2023;103(3):515–27. - PubMed
    1. Fernandez-Guarino M, Bacci S, Perez Gonzalez LA, Bermejo-Martinez M, Cecilia-Matilla A, Hernandez-Bule ML. The role of physical therapies in Wound Healing and assisted scarring. Int J Mol Sci 2023;24(8). - PMC - PubMed
    1. Shi N, Wang Y, Xia Z, et al. The regulatory role of the apelin/APJ axis in scarring: identification of upstream and downstream mechanisms. Biochim Biophys Acta Mol Basis Dis. 2024;1870(4):167125. - PubMed

LinkOut - more resources