. 2024 Oct 15;12(1):124.
doi: 10.1186/s40364-024-00667-w.

BRD4 inhibitor reduces exhaustion and blocks terminal differentiation in CAR-T cells by modulating BATF and EGR1

Affiliations

BRD4 inhibitor reduces exhaustion and blocks terminal differentiation in CAR-T cells by modulating BATF and EGR1

Songnan Sui et al. Biomark Res. .

Abstract

Background: Exhaustion is a key factor that influences the efficacy of chimeric antigen receptor T (CAR-T) cells. Our previous study demonstrated that a bromodomain protein 4 (BRD4) inhibitor can revise the phenotype and function of exhausted T cells from leukemia patients. This study aims to elucidate the mechanism by which a BRD4 inhibitor reduces CAR-T cell exhaustion using single-cell RNA sequencing (scRNA-Seq).

Methods: Exhausted CD123-specific CAR-T cells were prepared by co-culture with CD123 antigen-positive MV411 cells. After elimination of MV411 cells and upregulation of inhibitory receptors on the surface, exhausted CAR-T cells were treated with a BRD4 inhibitor (JQ1) for 72 h. The CAR-T cells were subsequently isolated, and scRNA-Seq was conducted to characterize phenotypic and functional changes in JQ1-treated cells.

Results: Both the proportion of exhausted CD8+ CAR-T cells and the exhausted score of CAR-T cells decreased in JQ1-treated compared with control-treated cells. Moreover, JQ1 treatment led to a higher proportion of naïve, memory, and progenitor exhausted CD8+ CAR-T cells as opposed to terminal exhausted CD8+ CAR-T cells accompanied by enhanced proliferation, differentiation, and activation capacities. Additionally, with JQ1 treatment, BATF activity and expression in naïve, memory, and progenitor exhausted CD8+ CAR-T cells decreased, whereas EGR1 activity and expression increased. Interestingly, AML patients with higher EGR1 and EGR1 target gene ssGSEA scores, coupled with lower BATF and BATF target gene ssGSEA scores, had the best prognosis.

Conclusions: Our study reveals that a BRD4 inhibitor can reduce CAR-T cell exhaustion and block exhausted T cell terminal differentiation by downregulating BATF activity and expression together with upregulating EGR1 activity and expression, presenting an approach for improving the effectiveness of CAR-T cell therapy.

Keywords: BRD4 inhibitor; Chimeric antigen receptor T cell exhaustion; Single-cell RNA sequencing; Transcriptional factors.


Conflict of interest statement

The authors declare no competing interests.

Figures
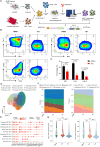
Fig. 1
Fig. 1
JQ1 reduces CAR-T cell exhaustion (A) Study design schematics (B-C) After treatment with JQ1 for 72 h, the percentages of PD-1, Tim-3, and LAG3 on CAR-T cells were determined by flow cytometry (n = 3) (D) UMAP (Uniform Manifold Approximation and Projection) plot of CAR-T cell scRNA-seq datasets color coded by nine distinct cell types (E) Dot plot for marker genes of each CAR-T cell type. Color gradient represents the average scaled expression of marker genes in each cell type, and dot size depicts the percentage of cells expressing the marker genes in each cell type (F) Proportion of subpopulations within the CD4+ (left) and CD8+ (right) CAR-T cell populations (G) Violin plots of the exhausted scores for CD4+ (left) and CD8+ (right) CAR-T cells
Fig. 2
Fig. 2
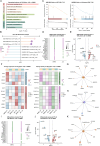
JQ1 reprograms the transcriptional profiles of CD8+naïve and memory CAR-T cells (A) KEGG and GO enrichment plot for genes upregulated in CD8+ naïve CAR-T cells in the JQ1 treated group (B) GSEA (Gene Set Enrichment Analysis) of genes upregulated in CD8+ naïve CAR-T cells in the JQ1 compared to DMSO group (C) GSEA plot showing the expression enrichment of genes related to the GSE19825 Naïve vs. EFF CD8_T UP (left) and GSE9650 Naïve vs. Exhausted CD8_T DN (right) pathways in CD8+ naïve CAR-T cells from the JQ1 group (D) Dot plot of the top 10 differentially active transcription factors (TFs) in CD8+ naïve CAR-T cells treated with JQ1 or DMSO (E) Volcano plot of TF genes differentially expressed in CD8+ naïve CAR-T cells treated with JQ1 vs. DMSO (F) Heatmap displaying the expression levels (left) and activities (right) of TFs that are consistently upregulated or downregulated in both expression and activity in CD8+ naïve CAR-T cells with JQ1 treatment (G) Network diagram of the EGR1 regulon (EGR1 and its top 10 target genes) in CD8+ naïve CAR-T cells. The edge length from EGR1 to a target gene is proportional to the regulation weight by EGR1. The target gene node size represents the difference in the level of expression between JQ1-treated and DMSO-treated cells (H) Network diagram of the BATF regulon (BATF and its top 10 target genes) in CD8+ naïve CAR-T cells. The edge length from BATF to a target gene is proportional to the regulation weight by BATF. The target gene node size represents the difference in the level of expression between JQ1-treated and DMSO-treated cells (I) Dot plot of the top 10 differentially actived TFs in CD8+ memory CAR-T cells treated with JQ1 vs. DMSO (J) Volcano plot of differentially expressed TF genes in CD8+ memory CAR-T cells treated with JQ1 vs. DMSO (K) Network diagram of the IRF7 regulon (IRF7 and its top 10 target genes) in CD8+ memory CAR-T cells. The edge length from IRF7 to a target gene is proportional to the regulation weight by IRF7. The node size of the target genes represents difference in expression level between JQ1-treated and DMSO-treated cells
Fig. 3
Fig. 3
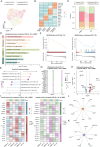
JQ1 increases the proportion and reshapes the transcriptional profile of progenitor exhausted CD8+CAR-T cells (A) UMAP plot of subpopulations of exhausted CD8+ (CD8_Ex) CAR-T cells color-coded by distinct cell types (B) Heatmap of different subpopulation signature genes in CD8_Ex CAR-T cells (C) Proportion of the subpopulations in CD8_Ex CAR-T cells treated with JQ1 vs. DMSO (D) KEGG and GO enrichment plot for genes upregulated in progenitor CD8_Ex CAR-T cells in JQ1-treated vs. DMSO-treated groups (E) GSEA of genes upregulated in progenitor CD8_Ex CAR-T cells in JQ1-treated vs. DMSO-treated cells (F) GSEA plot showing the expression enrichment of genes related to the GSE19825 Naïve vs. EFF CD8_T UP (left) and GSE9650 Naïve vs. Exhausted CD8_T DN (right) pathways in progenitor CD8_Ex CAR-T cells from the JQ1 group (G) Dot plot of the top 10 differentially actived TF genes between progenitor CD8_Ex CAR-T cells in the JQ1 group and progenitor CD8_Ex CAR-T cells in the DMSO group (H) Volcano plot of TF genes differentially expressed in progenitor CD8_Ex CAR-T cells treated with JQ1 vs. progenitor CD8_Ex CAR-T cells treated with DMSO (I) Heatmap displaying the expression levels (left) and activities (right) of TF genes that are consistently upregulated or downregulated in both expression and activity in progenitor CD8_Ex CAR-T cells treated with JQ1 compared to DMSO control (J) Network diagram of the MAF regulon (MAF and its top 10 target genes) in progenitor CD8_Ex CAR-T cells (K) Network diagram of the BATF regulon (BATF and its top 10 target genes) in progenitor CD8_Ex CAR-T cells
Fig. 4
Fig. 4
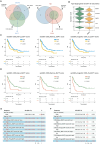
JQ1 may improve the prognosis of AML patients by influencing the activity and expression of BATF and EGR1 (A) Venn diagram representing the intersection of differentially expressed and activated TFs among CD8+ naïve, CD8+ memory, and progenitor CD8_Ex CAR-T cells in JQ1-treated compared to DMSO-treated cells (B) Violin plots showing the expression levels of the top 5 differentially expressed EGR1 target genes in CD8+ naïve CAR-T cells (C) Overall survival (OS) for the low and high ssGSEA (single-sample Gene Set Enrichment Analysis) score subgroups of AML patients from the TCGA-AML dataset (left: ssGSEA scoring based on EGR1 and its top 30 differentially expressed target genes in CD8+ naïve CAR-T cells; middle: ssGSEA scoring based on EGR1 and its top 30 differentially expressed target genes in CD8+ memory CAR-T cells; right: ssGSEA scoring based on EGR1 and its top 30 differentially expressed target genes in progenitor CD8_Ex CAR-T cells.) (D) OS for the low and high ssGSEA score subgroups of AML patients from the TCGA-AML dataset (left: ssGSEA scoring based on BATF and its top 30 differentially expressed target genes in CD8+ naïve CAR-T cells; middle: ssGSEA scoring based on BATF and its top 30 differentially expressed target genes in CD8+ memory CAR-T cells; right: ssGSEA scoring based on BATF and its top 30 differentially expressed target genes in progenitor CD8_Ex CAR-T cells.) (E) Univariate cox regression analysis of AML patients from the TCGA-AML dataset (F) Multivariate cox regression analysis of AML patients from the TCGA-AML dataset
Fig. 5
Fig. 5
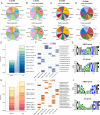
Preferred VJ gene combinations in TCRs from JQ1-treated CAR-T cells (A) Pie chart of the top 10 V genes used in the α chain in CAR-T cells in the DMSO group (top) and JQ1 group (bottom) (B) The same as plot (A), except including the top 10 J genes used in the α chain (C) The same as plot (A), except including the top 10 V genes used in the β chain (D) The same as plot (A), except including the top 10 J genes used in the β chain (E) Top 10 VJ gene combinations with a higher proportion of α chain combinations in JQ1-treated CAR-T cells (F) Heatmap showing the frequency of the top 3 most frequent CDR3 sequences found with the TRAV12-1 and TRAJ13 gene combination in each sample (N represents the total number of unique CDR3 sequences in the TCR α chain found with the TRAV12-1 and TRAJ13 gene combination in each sample.) (G) Bias analysis of the CDR3 amino acid motif in the TCR α chain found with the TRAV12-1 and TRAJ13 gene combination (H) Top 10 VJ gene combinations with a higher proportion of β chain combinations in JQ1-treated CAR-T cells (I) Heatmap showing the frequency of the top 3 most frequent TCR β chain CDR3 sequences found with the TRBV28 and TRBJ2-7 gene combination in each sample (N represents the total number of unique CDR3 sequences in the TCR β chain found with the TRBV28 and TRBJ2-7 gene combination in each sample) (J) Bias analysis of the CDR3 amino acid motif in the TCR β chain found with TRBV28 and TRBJ2-7 gene combination

Similar articles

Cited by

References

    1. Bhansali RS, Pratz KW, Lai C. Recent advances in targeted therapies in acute myeloid leukemia. J Hematol Oncol. 2023;16(1):29. - PMC - PubMed
    1. Short NJ, Muftuoglu M, Ong F, Nasr L, Macaron W, Montalban-Bravo G, et al. A phase 1/2 study of azacitidine, venetoclax and pevonedistat in newly diagnosed secondary AML and in MDS or CMML after failure of hypomethylating agents. J Hematol Oncol. 2023;16(1):73. - PMC - PubMed
    1. Shimony S, Stahl M, Stone RM. Acute myeloid leukemia: 2023 update on diagnosis, risk-stratification, and management. Am J Hematol. 2023;98(3):502–26. - PubMed
    1. Ma Y, Dai H, Cui Q, Liu S, Kang L, Lian X, et al. Decitabine in combination with fludarabine and cyclophosphamide as a lymphodepletion regimen followed by CD19/CD22 bispecific targeted CAR T-cell therapy significantly improves survival in relapsed/refractory B-ALL patients. Exp Hematol Oncol. 2023;12(1):36. - PMC - PubMed
    1. Zeng C. Advances in cancer treatment: the role of new technologies and research. Cell Invest. 2025;1(1):100001.

LinkOut - more resources