Comparative Study
. 2024 Oct 15;16(1):226.
doi: 10.1186/s13195-024-01585-7.

Plasma lipidomic signatures of dementia with Lewy bodies revealed by machine learning, and compared to alzheimer's disease

Affiliations
Comparative Study

Plasma lipidomic signatures of dementia with Lewy bodies revealed by machine learning, and compared to alzheimer's disease

Huixin Shen et al. Alzheimers Res Ther. .

Abstract

Background: Dementia with Lewy Bodies (DLB) is a complex neurodegenerative disorder that often overlaps clinically with Alzheimer's disease (AD), presenting challenges in accurate diagnosis and underscoring the need for novel biomarkers. Lipidomic emerges as a promising avenue for uncovering disease-specific metabolic alterations and potential biomarkers, particularly as the lipidomics landscape of DLB has not been previously explored. We aim to identify potential diagnostic biomarkers and elucidate the disease's pathophysiological mechanisms.

Methods: This study conducted a lipidomic analysis of plasma samples from patients with DLB, AD, and healthy controls (HCs) at Xuanwu Hospital. Untargeted plasma lipidomic profiling was conducted via liquid chromatography coupled with mass spectrometry. Machine learning methods were employed to discern lipidomic signatures specific to DLB and to differentiate it from AD.

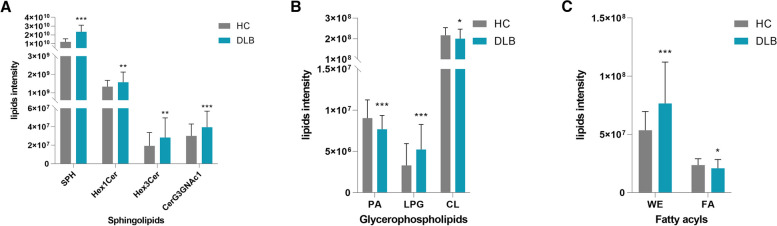
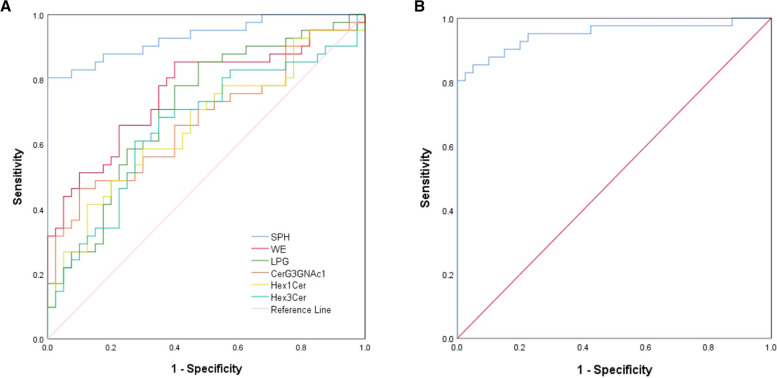
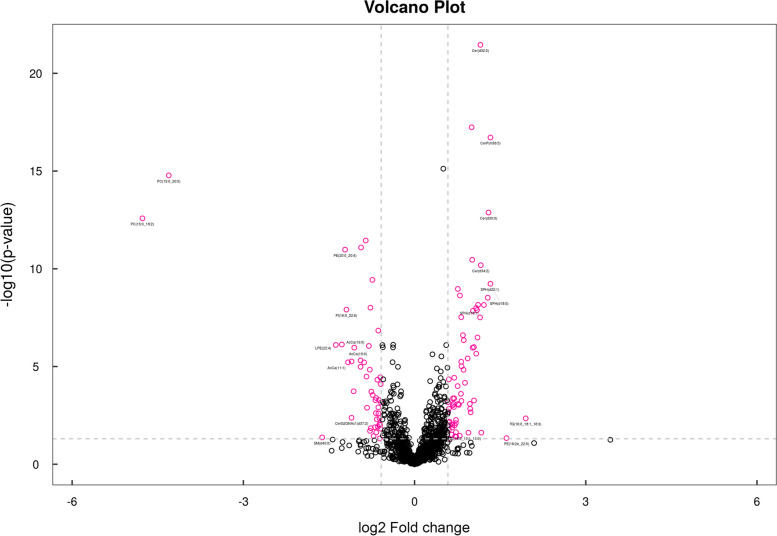
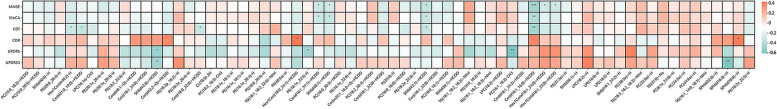
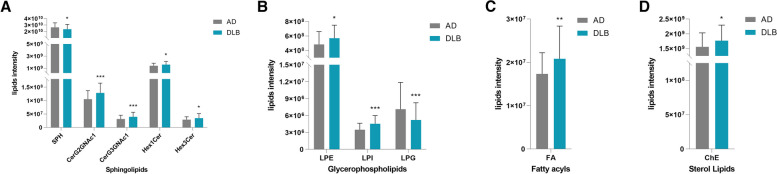
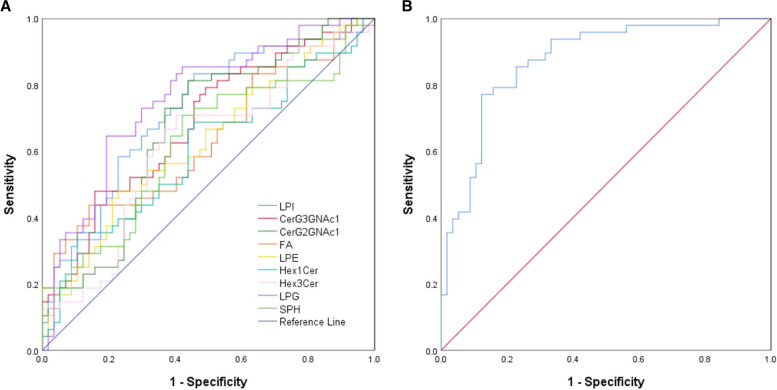
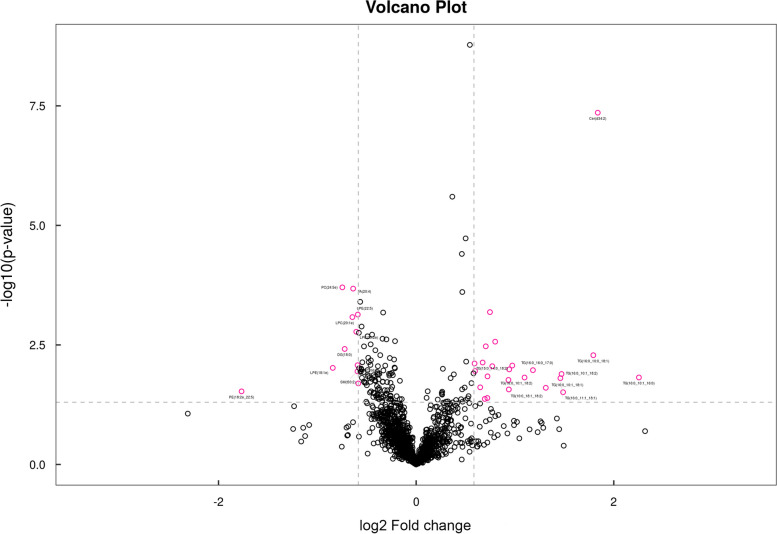
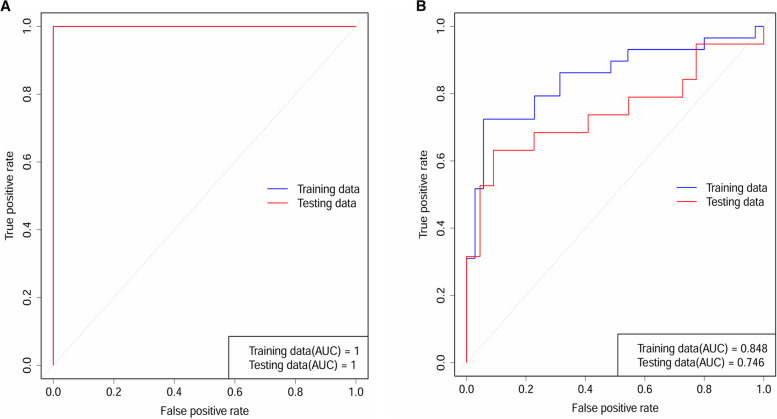
Results: The study enrolled 159 participants, including 57 with AD, 48 with DLB, and 54 HCs. Significant differences in lipid profiles were observed between the DLB and HC groups, particularly in the classes of sphingolipids and phospholipids. A total of 55 differentially expressed lipid species were identified between DLB and HCs, and 17 between DLB and AD. Correlations were observed linking these lipidomic profiles to clinical parameters like Unified Parkinson's Disease Rating Scale III (UPDRS III) and cognitive scores. Machine learning models demonstrated to be highly effective in distinguishing DLB from both HCs and AD, achieving substantial accuracy through the utilization of specific lipidomic signatures. These include PC(15:0_18:2), PC(15:0_20:5), and SPH(d16:0) for differentiation between DLB and HCs; and a panel includes 13 lipid molecules: four PCs, two PEs, three SPHs, two Cers, and two Hex1Cers for distinguishing DLB from AD.

Conclusions: This study presents a novel and comprehensive lipidomic profile of DLB, distinguishing it from AD and HCs. Predominantly, sphingolipids (e.g., ceramides and SPHs) and phospholipids (e.g., PE and PC) were the most dysregulated lipids in relation to DLB patients. The lipidomics panels identified through machine learning may serve as effective plasma biomarkers for diagnosing DLB and differentiating it from AD dementia.

Keywords: Alzheimer’s disease; Biomarker; Dementia with Lewy bodies; Diagnosis; Lipidomic; Machine Learning.


Conflict of interest statement

The authors declare no competing interests.

Figures

Fig. 1
Fig. 1
Different lipid class between the DLB and HC groups. Abbreviation: DLB, dementia with Lewy bodies; HC, Healthy controls; SPH, sphingosine; Hex1Cer, hexosylceramide; Hex3Cer, trihexosylceramide; CerG3GNAc1, trihexosyl N-acetylhexosyl ceramide; PA, phosphatidic acid; LPG, lysophosphatidylglycerol; CL, cardiolipin; WE, wax esters; FA, fatty acids. *p < 0.05 vs. HC; ** p < 0.01 vs. HC; *** p < 0.001 vs. HC
Fig. 2
Fig. 2
A Receiver operating characteristic (ROC) curve of various lipid classes used to differentiate between DLB and HC. B ROC curves of the six lipid classes for joint prediction of DLB. Abbreviation: DLB, dementia with Lewy bodies; HC, Healthy controls; SPH: sphingosine; WE, wax esters; LPG, lysophosphatidylglycerol; CerG3GNAc1, trihexosyl N-acetylhexosyl ceramide; Hex1Cer, hexosylceramide; Hex3Cer, trihexosylceramide
Fig. 3
Fig. 3
Volcano plots of the Fold change (FC) (x-axis) and p-value (y-axis) for each detected lipid in the comparison of DLB vs. HC subjects. Red dots represent significantly upregulated (FC> 1.5) molecules or downregulated (FC <0.67) molecules in DLB patients. Abbreviation: DLB, dementia with Lewy bodies; HC, Healthy controls
Fig. 4
Fig. 4
Significant correlations between clinical parameters of DLB patients and the differentially expressed lipids species. The colour scale illustrates the degree of correlation and ranges from red to green, indicating negative and positive correlations, respectively. Abbreviation: DLB, dementia with Lewy bodies; MMSE, Mini-Mental State Examination; MoCA, Montreal Cognitive Assessment; CDT, Clock Drawing Test; CDR, Clinical Dementia Rating Scale; UPDRS, Movement Disorder Society Unified Parkinson’s Disease Rating Scale
Fig. 5
Fig. 5
Different lipid class between the DLB and AD groups. Abbreviation: DLB, dementia with Lewy bodies; AD, Alzheimer’s disease; SPH, sphingosine; CerG2GNAc1, dihexosyl N-acetylhexosyl ceramide; CerG3GNAc1, trihexosyl N-acetylhexosyl ceramide; Hex1Cer, hexosylceramide; Hex3Cer, trihexosylceramide; LPE, lysophosphatidylethanolamine; LPI, lysophosphatidylinositol; LPG, lysophosphatidylglycerol; FA, fatty acids, ChE, cholesteryl ester. *p < 0.05 vs. AD; ** p < 0.01 vs. AD; *** p < 0.001 vs. AD
Fig. 6
Fig. 6
A Receiver operating characteristic (ROC) curve of various lipid classes used to differentiate between DLB and AD. B ROC curves of the nine lipid classes for joint prediction of DLB. DLB, dementia with Lewy bodies; AD, Alzheimer’s disease; SPH, sphingosine; CerG2GNAc1, dihexosyl N-acetylhexosyl ceramide; CerG3GNAc1, trihexosyl N-acetylhexosyl ceramide; Hex1Cer, hexosylceramide; Hex3Cer, trihexosylceramide; LPE, lysophosphatidylethanolamine; LPI, lysophosphatidylinositol; LPG, lysophosphatidylglycerol; FA, fatty acids
Fig. 7
Fig. 7
Volcano plots of the Fold change (FC) (x-axis) and p-value (y-axis) for each detected lipid in the comparison of DLB vs. AD subjects. Red dots represent significantly upregulated (FC> 1.5) molecules or downregulated (FC <0.67) molecules in DLB patients. DLB: dementia with Lewy bodies, AD: Alzheimer’s disease
Fig. 8
Fig. 8
A Model performance in distinguishing DLB from HC, (B) Model performance in distinguishing DLB from AD.  DLB: dementia with Lewy bodies, HC: Healthy controls, AD: Alzheimer’s disease

Similar articles

References

    1. Global status report. on the public health response to dementia. Geneva: World Health Organization; 2021.
    1. McKeith I, Mintzer J, Aarsland D, Burn D, Chiu H, Cohen-Mansfield J, et al. Dementia with Lewy bodies. LANCET NEUROL. 2004;3:19–28. - PubMed
    1. McKeith IG, Boeve BF, Dickson DW, Halliday G, Taylor JP, Weintraub D, et al. Diagnosis and management of dementia with Lewy bodies: Fourth consensus report of the DLB Consortium. NEUROLOGY. 2017;89:88–100. - PMC - PubMed
    1. Vann JS, JT O'Brien. The prevalence and incidence of dementia with Lewy bodies: a systematic review of population and clinical studies. PSYCHOL MED. 2014;44:673–83. - PubMed
    1. Ferman TJ, Aoki N, Crook JE, Murray ME, Radford NRG, Gerpen JA, et al. The limbic and neocortical contribution of α-synuclein, tau, and amyloid β to disease duration in dementia with Lewy bodies. Alzheimer's Dement. 2018;14:330–9. - PMC - PubMed

Publication types