. 2024 Oct 7;13(19):5953.
doi: 10.3390/jcm13195953.

NT-proBNP Reflects Left Ventricular Hypertrophy Rather than Left Ventricular Dilatation or Systolic Dysfunction in Patients with Fabry Disease

Affiliations

NT-proBNP Reflects Left Ventricular Hypertrophy Rather than Left Ventricular Dilatation or Systolic Dysfunction in Patients with Fabry Disease

Constantin Gatterer et al. J Clin Med. .

Abstract

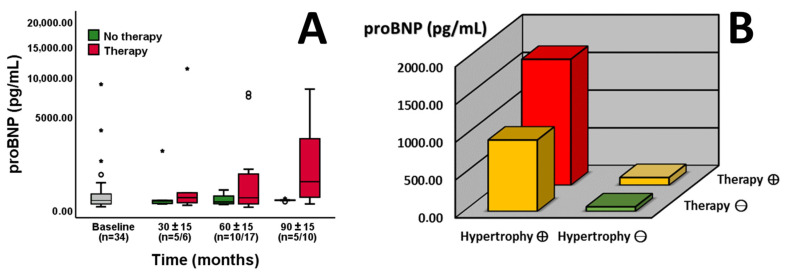
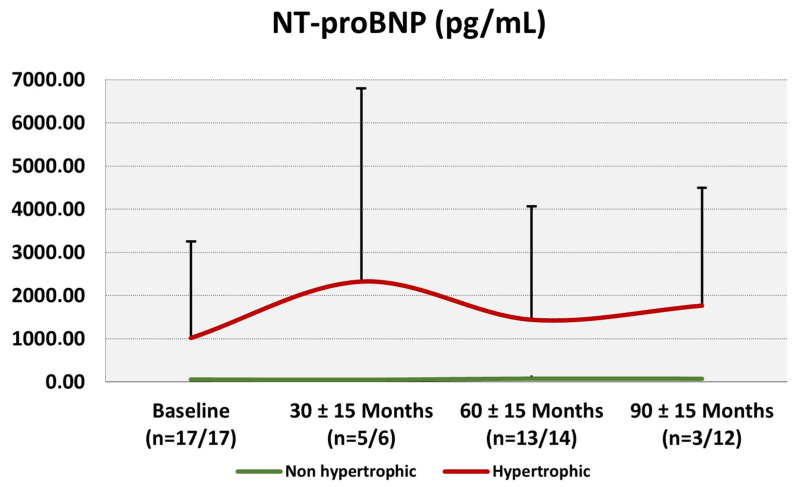
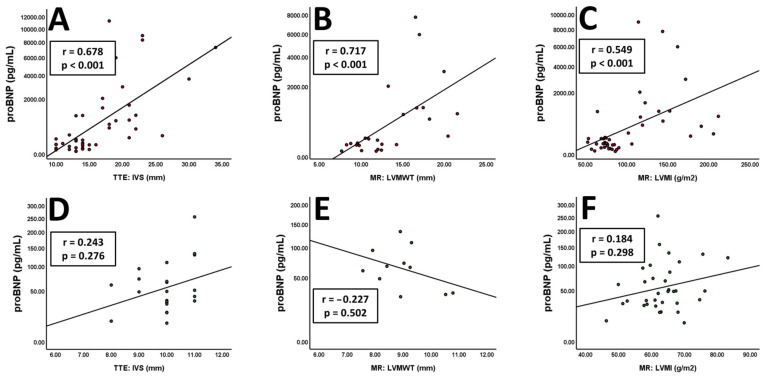
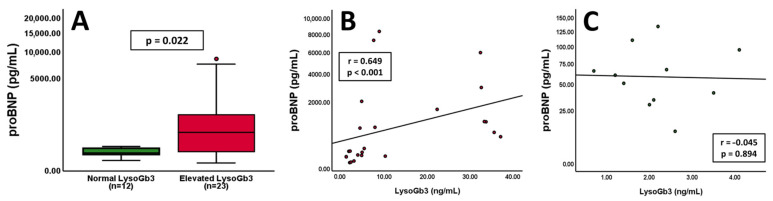
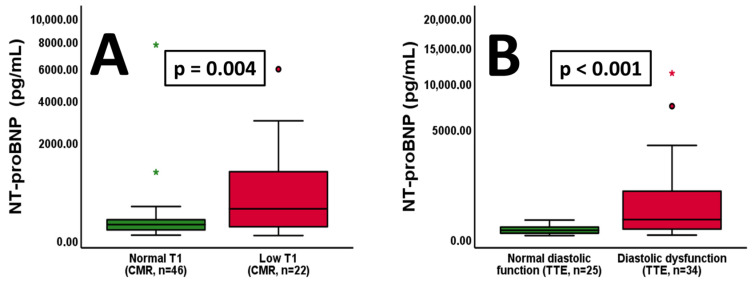
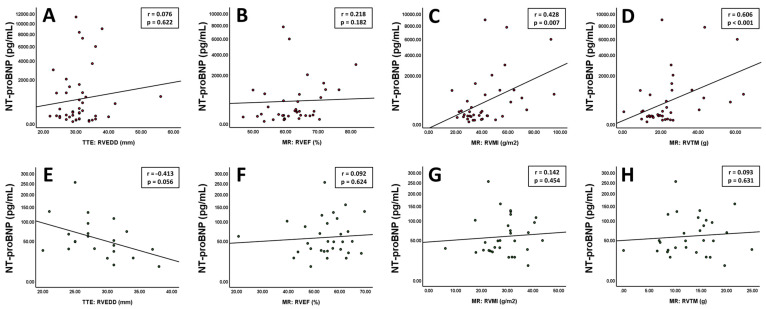
Background: The diagnosis and follow-up of cardiac involvement in Fabry disease constitutes an important challenge for clinicians caring for affected patients. Combining cardiac imaging with laboratory biomarkers appears most appropriate for longitudinal monitoring. Therefore, we examined the use of NT-proBNP and its association with imaging findings in patients with Fabry disease. Methods: We analysed cardiac MRI and echocardiography data, as well as laboratory results, from a single-centre prospective registry. Results: Repetitive follow-ups of 38 patients with Fabry disease, of whom 18 presented with left ventricular hypertrophy (LVH), revealed a correlation of NT-proBNP with left ventricular (LV) interventricular septal thickness, LV maximum wall thickness, LV and right ventricular (RV) mass index and trabecular mass in patients with LVH. Patients without LVH did not exhibit any tangible association between NT-proBNP and the mentioned parameters. Conversely, we could not detect an association of NT-proBNP with impairment of LV or RV ejection fraction or diastolic volume. Conclusions: NT-proBNP plays a pivotal role as a biomarker for cardiac involvement in patients with Fabry disease. Interestingly, in this specific population with mostly preserved ejection fraction, it seems to reflect ventricular hypertrophy rather than ventricular dysfunction or dilatation. While strong associations were found in hypertrophic patients, NT-proBNP's prognostic value appears limited in non- or pre-hypertrophic stages.

Keywords: Fabry disease; NT-proBNP; biomarker; cardiac MRI; cardiomyopathy; echocardiography; lysosomal storage disease.


Conflict of interest statement

C.G. and S.G. received research and congress funding and speaker honoraria from Amicus Therapeutics, Sanofi and Takeda Pharmaceuticals. D.B. received speaker honoraria from Siemens Healthineers. M.P. has received speaker or consulting honoraria from Amicus and participated in meetings sponsored by and received travel funding from Amicus and Sanofi-Genzyme. G.S.-P. received honoraria and research funding from Amicus, Chiesi, Freeline and Sanofi-Genzyme.

Figures

Figure 1
Figure 1
Longitudinal development of NT-proBNP values in patients with (red boxplots) or without (green boxplots) specific therapy ((A), n = indicated). There is a trend towards differences after 60 months (p = 0.083) and significant differences after 90 months (p = 0.020). NT-proBNP values of all available time points are stratified by therapy and the presence of left ventricular hypertrophy ((B), n = 87, the red bar indicates both factors, the yellow bar one, and the green bar none). Patients on specific therapy with left ventricular hypertrophy (red bar) display increased NT-proBNP levels in contrast to those without these two factors (green bar, p = 0.026). The Y-axis is shown as a percentage function (A) to highlight low NT-proBNP values. A p-value of <0.05 was considered statistically significant. “*” indicates outliers within the cohort.
Figure 2
Figure 2
Changes in average (+standard deviation) NT-proBNP values from baseline to 30 ± 15, 60 ± 15 and 90 ± 15 months follow-ups. The red line represents hypertrophic individuals (defined as an interventricular septum >12 mm (TTE) or LVMI of >75 g g/m2 ♂ or >59 g g/m2 ♀), whereas the green line depicts non-hypertrophic patients.
Figure 3
Figure 3
Correlations of NT-proBNP values and imaging markers of hypertrophy in patients with ((A) n = 47, (B) n = 27, (C) n = 46) or without ((D) n = 21, (E) n = 11, (F) n = 33) left ventricular hypertrophy. The Y-axis is shown as a percentage function to highlight low NT-proBNP values. A p-value of <0.05 was considered statistically significant.
Figure 4
Figure 4
Patients with elevated LysoGb3 values exhibit increased NT-proBNP levels ((A), p = 0.022, n = indicated). Correlations of NT-proBNP and LysoGb3 values in patients with ((B), n = 24) or without ((C), n = 11) left ventricular hypertrophy. The Y-axis is shown as a percentage function to highlight low NT-proBNP values. A p-value of < 0.05 was considered statistically significant.
Figure 5
Figure 5
Patients with low T1 values exhibit increased NT-proBNP levels ((A), p = 0.004, n = indicated). Furthermore, individuals with left ventricular diastolic dysfunction show elevated NT-proBNP levels compared to those with normal function ((B), p < 0.001, n = indicated). The Y-axis is shown as a percentage function to highlight low NT-proBNP values. A p-value of <0.05 was considered statistically significant. “*” indicates outliers within the cohort.
Figure 6
Figure 6
Patients with left ventricular hypertrophy show no correlations between NT-proBNP and right ventricular end-diastolic diameter ((A), n = 44) and right ventricular function ((B), n = 38) but with right ventricular mass index ((C), n = 38) and right ventricular trabecular mass ((D), n = 38). Individuals without hypertrophy exhibit no significant correlations with the mentioned parameters ((E) n = 22, (F) n = 31, (G) n = 31, (H) n = 29). The Y-axis is shown as a percentage function to highlight low NT-proBNP values. A p-value of <0.05 was considered statistically significant.

Similar articles

Cited by

References

    1. Germain D.P. Fabry disease. Orphanet J. Rare Dis. 2010;5:30. doi: 10.1186/1750-1172-5-30. - DOI - PMC - PubMed
    1. Mehta A., Clarke J.T., Giugliani R., Elliott P., Linhart A., Beck M., Sunder-Plassmann G., Investigators F.O.S. Natural course of Fabry disease: Changing pattern of causes of death in FOS-Fabry Outcome Survey. J. Med. Genet. 2009;46:548–552. doi: 10.1136/jmg.2008.065904. - DOI - PubMed
    1. Pieroni M., Moon J.C., Arbustini E., Barriales-Villa R., Camporeale A., Vujkovac A.C., Elliott P.M., Hagege A., Kuusisto J., Linhart A., et al. Cardiac Involvement in Fabry Disease: JACC Review Topic of the Week. J. Am. Coll. Cardiol. 2021;77:922–936. doi: 10.1016/j.jacc.2020.12.024. - DOI - PubMed
    1. Azevedo O., Cordeiro F., Gago M.F., Miltenberger-Miltenyi G., Ferreira C., Sousa N., Cunha D. Fabry Disease and the Heart: A Comprehensive Review. Int. J. Mol. Sci. 2021;22:4434. doi: 10.3390/ijms22094434. - DOI - PMC - PubMed
    1. Fuller M., Mehta A. Fabry cardiomyopathy: Missing links from genotype to phenotype. Heart. 2020;106:553–554. doi: 10.1136/heartjnl-2019-316143. - DOI - PubMed

LinkOut - more resources