

Early Fever in Allogeneic Stem Cell Transplantation: Are Presepsin and YKL-40 Valuable Diagnostic Tools?
- PMID: 39408051
- PMCID: PMC11478026
- DOI: 10.3390/jcm13195991
Early Fever in Allogeneic Stem Cell Transplantation: Are Presepsin and YKL-40 Valuable Diagnostic Tools?
Abstract
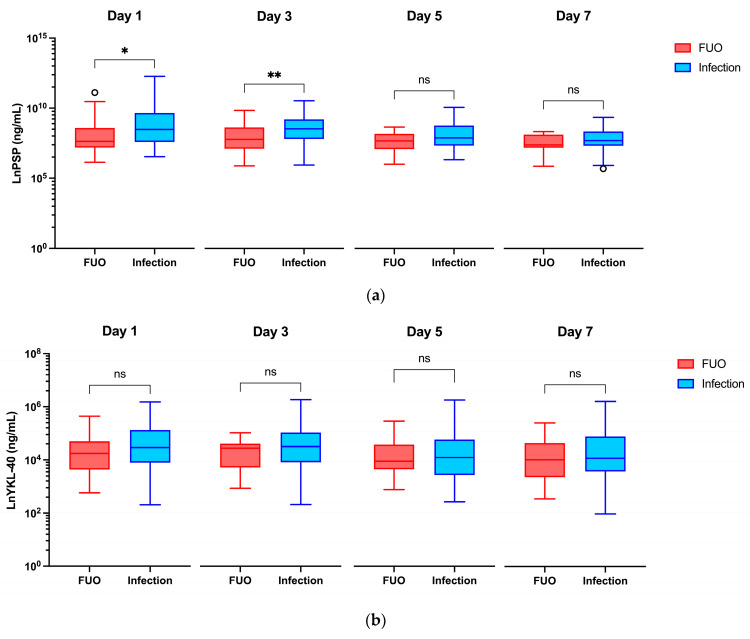
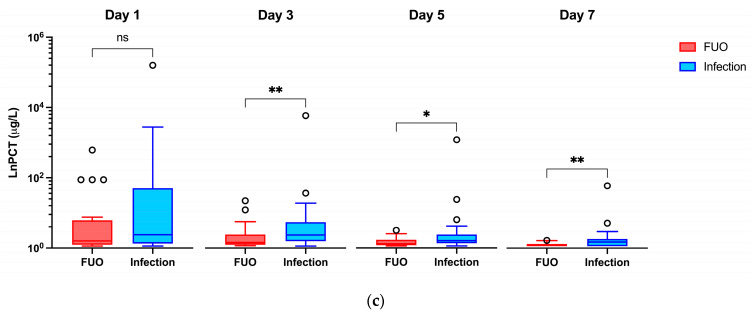
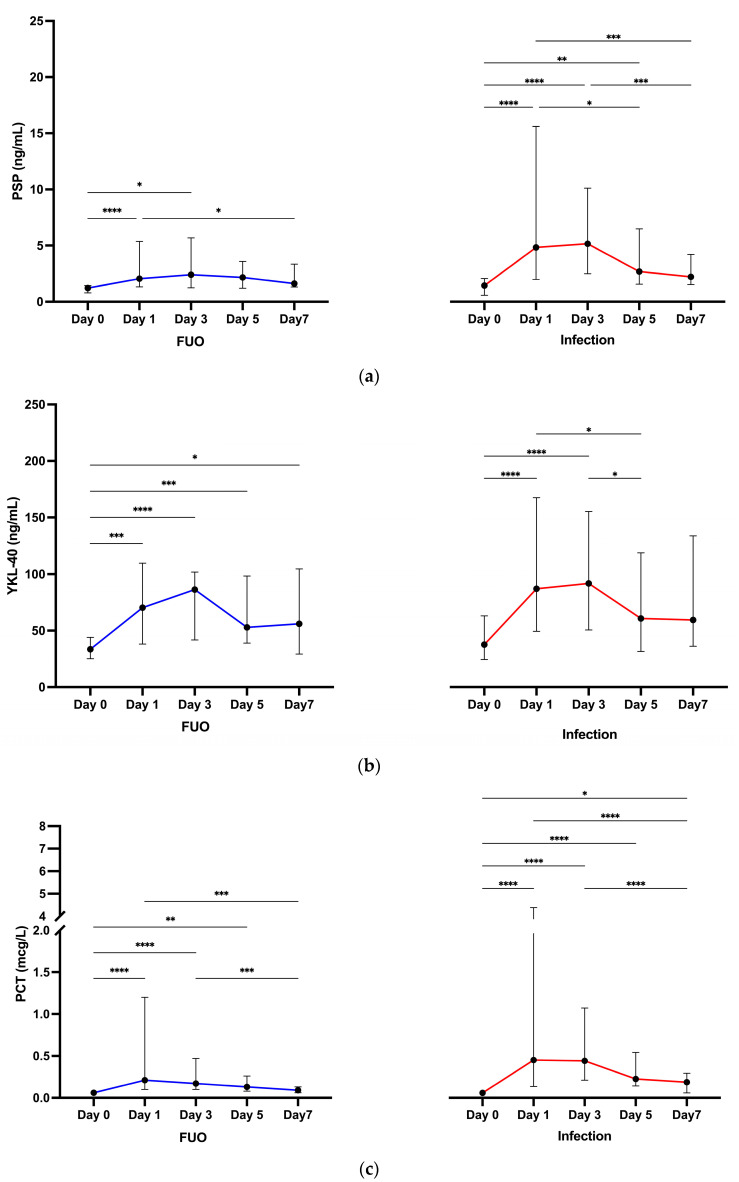
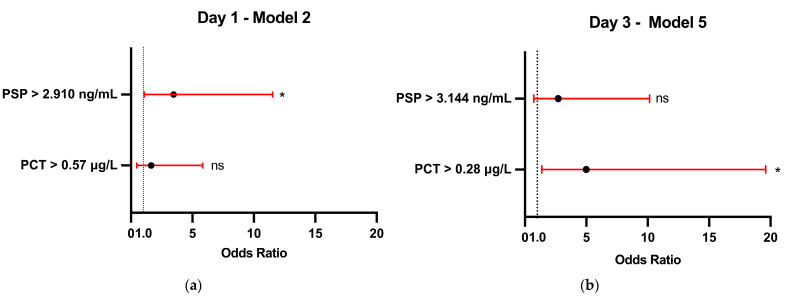
Background: Allogeneic hematopoietic stem cell transplantation (allo-HSCT) is a lifesaving treatment but carries a high infection risk. Diagnosing infections remains challenging due to the limited accuracy of standard biomarkers. Methods: This single-center study aimed to evaluate presepsin (PSP) and YKL-40 as infection biomarkers in febrile patients during the allo-HSCT pre-engraftment phase. Biomarker levels were prospectively measured in 61 febrile episodes from 54 allo-HSCT patients at admission, representing baseline levels, and then at Day 1, 3, 5, and 7 following fever onset. The diagnostic value was compared to that of procalcitonin (PCT). Results: PSP showed fair diagnostic value on Day 1 (AUC 0.656; 95% CI: 0.510-0.802) and Day 3 (AUC 0.698; 95% CI: 0.559-0.837). YKL-40 did not provide any significant diagnostic value across measured time points. PCT outperformed PSP and YKL-40, particularly on Day 3 (AUC 0.712; 95% CI: 0.572-0.852). When combining biomarkers, the best model for predicting infection used PSP > 3.144 ng/mL and PCT > 0.28 μg/L on Day 3, resulting in R2 of about 31% (p < 0.001). Conclusions: Neither test showed sufficient discriminative power for early infection to recommend their use as individual diagnostic tools in clinical practice.
Keywords: YKL-40 protein; bone marrow transplantation; chitinase-3-like protein 1; hematopoietic stem cell transplantation; human; presepsin protein; procalcitonin.
Conflict of interest statement
The authors declare no conflicts of interest. The funders had no role in the design of the study; in the collection, analyses, or interpretation of data; in the writing of the manuscript; or in the decision to publish the results.
Figures
Similar articles
-
Diagnostic value of sepsis biomarkers in hematopoietic stem cell transplant recipients in a condition of high prevalence of gram-negative pathogens.Hematol Oncol Stem Cell Ther. 2017 Mar;10(1):15-21. doi: 10.1016/j.hemonc.2016.09.002. Epub 2016 Oct 20. Hematol Oncol Stem Cell Ther. 2017. PMID: 27793578
-
The Clinical Value of Procalcitonin in the Neutropenic Period After Allogeneic Hematopoietic Stem Cell Transplantation.Front Immunol. 2022 Apr 25;13:843067. doi: 10.3389/fimmu.2022.843067. eCollection 2022. Front Immunol. 2022. PMID: 35547733 Free PMC article.
-
Serum procalcitonin as an independent diagnostic markers of bacteremia in febrile patients with hematologic malignancies.PLoS One. 2019 Dec 10;14(12):e0225765. doi: 10.1371/journal.pone.0225765. eCollection 2019. PLoS One. 2019. PMID: 31821331 Free PMC article.
-
The combination of procalcitonin and C-reactive protein or presepsin alone improves the accuracy of diagnosis of neonatal sepsis: a meta-analysis and systematic review.Crit Care. 2018 Nov 21;22(1):316. doi: 10.1186/s13054-018-2236-1. Crit Care. 2018. PMID: 30463590 Free PMC article.
-
Presepsin as a diagnostic marker of sepsis in children and adolescents: a systemic review and meta-analysis.BMC Infect Dis. 2019 Aug 30;19(1):760. doi: 10.1186/s12879-019-4397-1. BMC Infect Dis. 2019. PMID: 31470804 Free PMC article.
Cited by
-
Biomarkers Affecting Treatment Outcomes of Febrile Neutropenia in Hematological Patients with Lymphomas: Is Presepsin the New Promising Diagnostic and Prognostic Biomarker?J Clin Med. 2025 Mar 25;14(7):2238. doi: 10.3390/jcm14072238. J Clin Med. 2025. PMID: 40217689 Free PMC article.
References
-
- Styczyński J., Tridello G., Koster L., Iacobelli S., van Biezen A., van der Werf S., Mikulska M., Gil L., Cordonnier C., Ljungman P., et al. Death after Hematopoietic Stem Cell Transplantation: Changes over Calendar Year Time, Infections and Associated Factors. Bone Marrow Transplant. 2020;55:126–136. doi: 10.1038/s41409-019-0624-z. - DOI - PMC - PubMed
-
- Weisser M., Theilacker C., Tschudin S.S., Babikir R., Bertz H., Götting T., Dettenkofer M., Kern W.V., Widmer A.F. Secular Trends of Bloodstream Infections during Neutropenia in 15 181 Haematopoietic Stem Cell Transplants: 13-Year Results from a European Multicentre Surveillance Study (ONKO-KISS) Clin. Microbiol. Infect. 2017;23:854–859. doi: 10.1016/j.cmi.2017.03.020. - DOI - PubMed
-
- Kumar A., Roberts D., Wood K.E., Light B., Parrillo J.E., Sharma S., Suppes R., Feinstein D., Zanotti S., Taiberg L., et al. Duration of Hypotension before Initiation of Effective Antimicrobial Therapy Is the Critical Determinant of Survival in Human Septic Shock. Crit. Care Med. 2006;34:1589–1596. doi: 10.1097/01.CCM.0000217961.75225.E9. - DOI - PubMed
Grants and funding
LinkOut - more resources
Full Text Sources
Research Materials
Miscellaneous
