. 2024 Sep 30;16(19):3318.
doi: 10.3390/nu16193318.

Vitamin D Significantly Inhibits Carcinogenesis in the Mogp-TAg Mouse Model of Fallopian Tube Ovarian Cancer

Affiliations

Vitamin D Significantly Inhibits Carcinogenesis in the Mogp-TAg Mouse Model of Fallopian Tube Ovarian Cancer

Omar L Nelson et al. Nutrients. .

Abstract

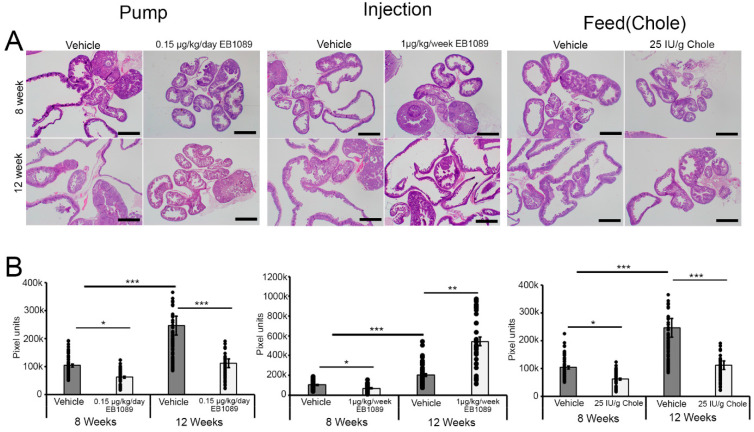
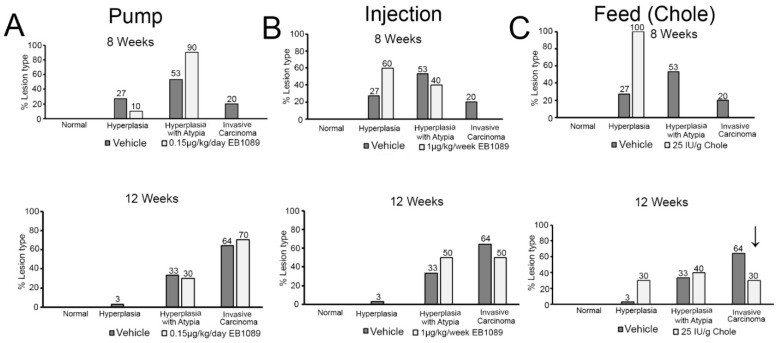
Epidemiological and observational studies suggest that vitamin D has potential for the chemoprevention of ovarian cancer. The anticancer effect of vitamin D in the fallopian tube epithelium (FTE), which is now thought to harbor the precursor cells for high grade ovarian cancer, is not known. The purpose of this study was to investigate whether vitamin D can inhibit carcinogenesis in the mogp-TAg fallopian tube (FT) ovarian cancer mouse model and examine underlying mechanisms. To test this hypothesis, 3 groups of 40 5-week-old female mogp-TAg mice were divided equally into two cohorts of 20 mice, treated with either vehicle (vitamin D solvent) or the active 1,25(OH)2D3 analogue EB1089, delivered via mini-pump or IP injection or cholecalciferol delivered in the feed. The FTs were characterized histologically and pathologically after 3 and 7 weeks of treatment. The effect of vitamin D on cultured human FTE cells was also examined. After 3 weeks, vitamin D, delivered as either cholecalciferol or EB1089 significantly inhibited FT carcinogenesis. After 7 weeks, cholecalciferol significantly reduced p53 signatures, serous tubal epithelial carcinoma, FT cancer, and plasma CA125 while increasing apoptosis in the FTE. EB1089 had no significant effect on FT carcinogenesis at 7 weeks. Cholecalciferol significantly reduced proliferation and increased apoptosis in vitro in p53-altered FTE cells. In conclusion, vitamin D inhibited FT carcinogenesis by clearing cells with p53 alterations. These data suggest that vitamin D has merit for the chemoprevention of fallopian tube/ovarian cancer. The optimal chemopreventive effect may be dependent on the route of vitamin D administration.

Keywords: carcinogenesis; chemoprevention; cholecalciferol; fallopian tube epithelium; mogp-TAg; vitamin D.


Conflict of interest statement

The authors declare no potential conflicts of interest, with the exception of Rodriguez, who has patents on the use of vitamin D for ovarian cancer prevention, but none have commercial value.

Figures

Figure 1
Figure 1
Effects of vitamin D on mogp-TAg mouse weight and calcium levels 8 and 12 weeks of age. (A) Trial design for the three different delivery systems for vitamin D in 5-week-old mice. Mice were euthanized at (1) 8 weeks of age (short term, 3 weeks of treatment) and (2) 12 weeks of age (long term, 7 weeks of treatment) for each delivery system. Sample size for each age group is n = 60 (a) Vehicle (n = 10) and osmotic mini-pump (0.15 µg/kg/day of EB1089) (n = 10), (b) Vehicle (n = 10) and I.P. injection (0.5 µg/kg EB1089 twice per week) (n = 10), and (c) Vehicle (n = 10) and feed (25 IU cholecalciferol (Chole) per gram of diet ad libitum) (n = 10). (B) Body weight gain (BWG) (grams) charts for the short- and long-term trials for each treatment group. (C) Calcium (Ca2+) (mg/dL) levels in the plasma of vehicle (n = 5) and vitamin D (n = 5) treated mice in the 3 different treatment groups at 8 and 12 weeks of age. (D) Plasma quantification of 25(OH)D3 at 8 weeks for vehicle (n = 6) and Chole (n = 8) and at 12 weeks for vehicle (n = 10) and Chole (n = 8). (E) Western blot of p53, VDR, and PAX8 in the kidney of 8-week-old mice and the fallopian tubes of 5-, 8- and 12-week-old mice. Mean ± SEM. * (p < 0.05), ** (p < 0.005), t-test.
Figure 2
Figure 2
Morphological changes in the fallopian tube at 8 and 12 weeks of age following treatments. (A) Representative H&E sections of the FT in the vehicle- and vitamin D-treated mice at 8 and 12 weeks of age following treatments in the 3 groups. Images were captured at 2× magnification. Scale bar: 1 mm. (B) Average cross-sectional area (pixel units) of the FT in Pump group at 8 weeks (vehicle (n = 65) and EB1089 (n = 47) and 12 weeks (vehicle (n = 57) and EB1089 (n = 45), Injection group at 8 weeks (vehicle (n = 52) and EB1089 (n = 65) and 12 weeks (vehicle (n = 55) and EB1089 (n = 39) and feed group at 8 weeks (vehicle (n = 60) and Chole (n = 61) and 12 weeks (vehicle (n = 55) and Chole (n = 54). mean ± SEM, * (p < 0.05), ** (p < 0.005), *** (p < 0.0005), t-test.
Figure 3
Figure 3
p53 positivity in the FT at 8 and 12 weeks of age following treatments. (A) Representative IHC staining of p53 at 8 and 12 weeks following treatment with vehicle and vitamin D in the 3 treatment groups. Images were captured at 2× magnification. Scale bar: 1mm. (B) Quantification of the p53 signatures and STIC lesions in the FT following treatment with vehicle (n = 10) and vitamin D (n = 10) at 8 at 12 weeks in the pump, injection, and feed treatment groups. Not significant (n.s.), mean ± SEM, * (p < 0.05), t-test.
Figure 4
Figure 4
FT histologic/pathologic characterization for normal, hyperplasia, hyperplasia with atypia, and invasive carcinoma at 8 and 12 weeks of age following treatments. The percentage of mice with the different types of FT lesions at 8 and 12 weeks are displayed on the graph: (A) The pump treatment group. (B) The injection treatment group. (C) The feed treatment group. Arrow indicates a 50% reduction in invasive carcinoma between vehicle and Chole in the feed group at 12 weeks.
Figure 5
Figure 5
Cleaved caspase-3 induction in the FT at 8 and 12 weeks of age after treatment with Cholecalciferol. (A) Representative FT IHC of cleaved caspase-3 (brown) captured at 10× magnification following treatment with vehicle and Chole at 8 and 12 weeks. Triangles highlight cropped FTE layer (black squares) showing cleaved caspase-3 positive cells. Arrow indicates normal-appearing epithelial layer that does not contain cleaved-caspase 3 positive cells. (B) Quantification of cleaved caspase-3 positive cells in the FT cross-section following treatment at 8 weeks for vehicle (n = 71) and Chole (n = 55) and at 12 weeks for vehicle (n = 52) and Chole (n = 65). mean ± SEM, * (p < 0.05), t-test. n = the number of cross-section examined for cleaved caspase-3 positive cells.
Figure 6
Figure 6
Cholecalciferol induces apoptosis and inhibits proliferation of FTE cells expressing inactivated p53 protein. (A) Apotox-Glo Triplex Assay showing cell viability (solid line), cytotoxicity (broken line), and apoptosis (dotted line) at 0.5 µM, 1 µM, 2.5 µM, 5 µM, 7.5 µM, 10 µM, and 20 µM Chole in FT194 (i) and FT190 (ii). Each concentration was done in triplicates. (B) MTS assay showing dose-dependent growth inhibition of FT194 at 24 h of treatment with increasing dose of Chole; the average of four independent wells was used to obtain the absorption for each concentration. Mean ± SEM, ** (p < 0.005), *** (p < 0.0005), t-test. (C) MTS assay showing growth inhibition of FT190 at 24 h of treatment with increasing dose of Chole; the average of four independent wells was used to obtain the absorption for each concentration. Mean ± SEM, ** (p < 0.005), *** (p < 0.0005), t-test. (D) MTS assay in primary FT cells (FT1026 and FT1028) showing the percentage growth inhibition with increasing dose of Chole; the average of four independent wells was used to obtain the absorption for each concentration. Mean ± SEM, * (p < 0.05), ** (p < 0.05), *** (p < 0.005), t-test. (E) Western blot of endogenous p53 in FT190, FT194, and FT246 (negative) (i), in addition to cleaved-caspase 3, CYP24A1, and VDR following treatment with vehicle and Chole in FT190 (ii) and FT194 (iii). (F) Western blot of cleaved-caspase 3 and CYP24A1 following treatments CYP24A1 inhibitor SDZ285428 only, Chole only, and SDZ285428/Chole combination in FT190.

References

    1. American Cancer Society . Cancer Facts & Figures 2024. American Cancer Society; Atlanta, GA, USA: 2024.
    1. Kurnit K.C., Fleming G.F., Lengyel E. Updates and New Options in Advanced Epithelial Ovarian Cancer Treatment. Obstet. Gynecol. 2021;137:108–121. doi: 10.1097/AOG.0000000000004173. - DOI - PMC - PubMed
    1. Folkins A.K., Jarboe E.A., Saleemuddin A., Lee Y., Callahan M.J., Drapkin R., Garber J.E., Muto M.G., Tworoger S., Crum C.P. A candidate precursor to pelvic serous cancer (p53 signature) and its prevalence in ovaries and fallopian tubes from women with BRCA mutations. Gynecol. Oncol. 2008;109:168–173. doi: 10.1016/j.ygyno.2008.01.012. - DOI - PMC - PubMed
    1. Roh M.H., Kindelberger D., Crum C.P. Serous Tubal Intraepithelial Carcinoma and the Dominant Ovarian Mass: Clues to Serous Tumor Origin? Am. J. Surg. Pathol. 2009;33:376–383. doi: 10.1097/PAS.0b013e3181868904. - DOI - PubMed
    1. Grant W.B. Ecologic studies of solar UV-B radiation and cancer mortality rates. Recent Results Cancer Res. 2003;164:371–377. doi: 10.1007/978-3-642-55580-0_27. - DOI - PubMed

MeSH terms