Comparative Study
. 2024 Oct 7;16(19):3398.
doi: 10.3390/nu16193398.

Evaluation of the Effects of Diet-Induced Obesity in Zebrafish (Danio rerio): A Comparative Study

Affiliations
Comparative Study

Evaluation of the Effects of Diet-Induced Obesity in Zebrafish (Danio rerio): A Comparative Study

Maria Gabriela F R Silva et al. Nutrients. .

Abstract

Objectives: This study aimed to compare diet-induced obesity (DIO) models in zebrafish and investigate the complications and differences between sexes in biochemical and inflammatory parameters.

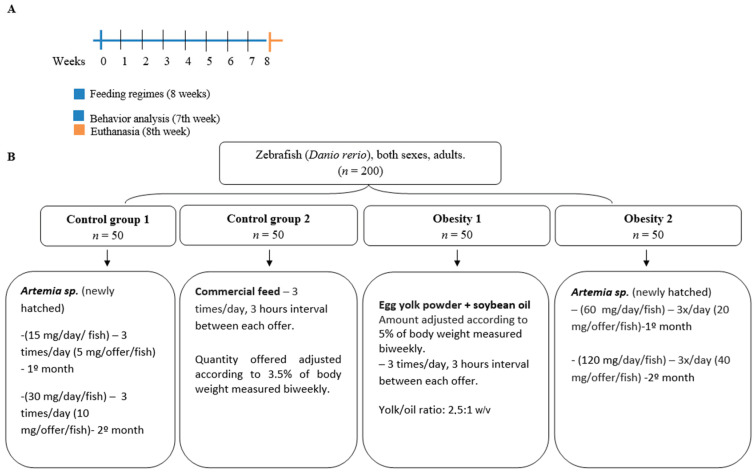
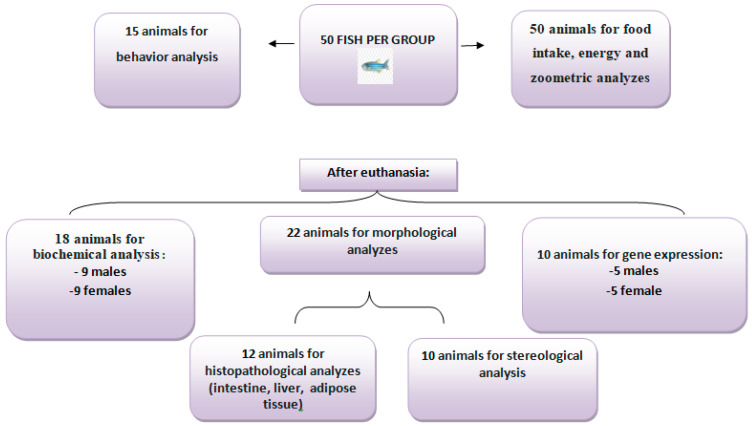
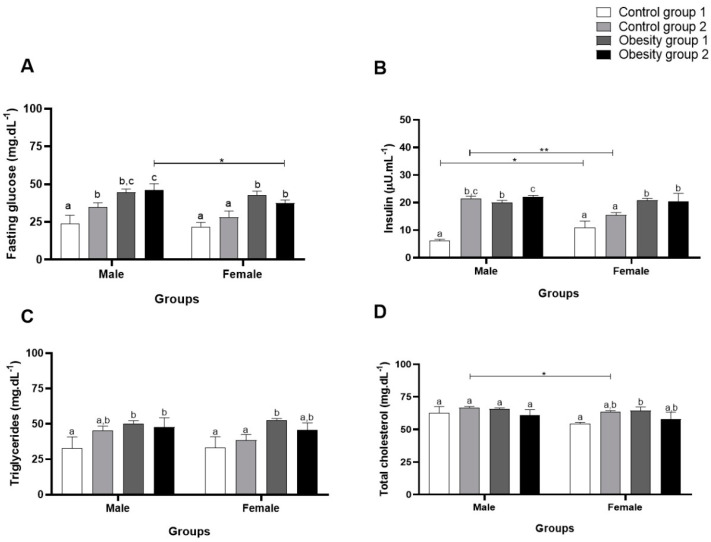
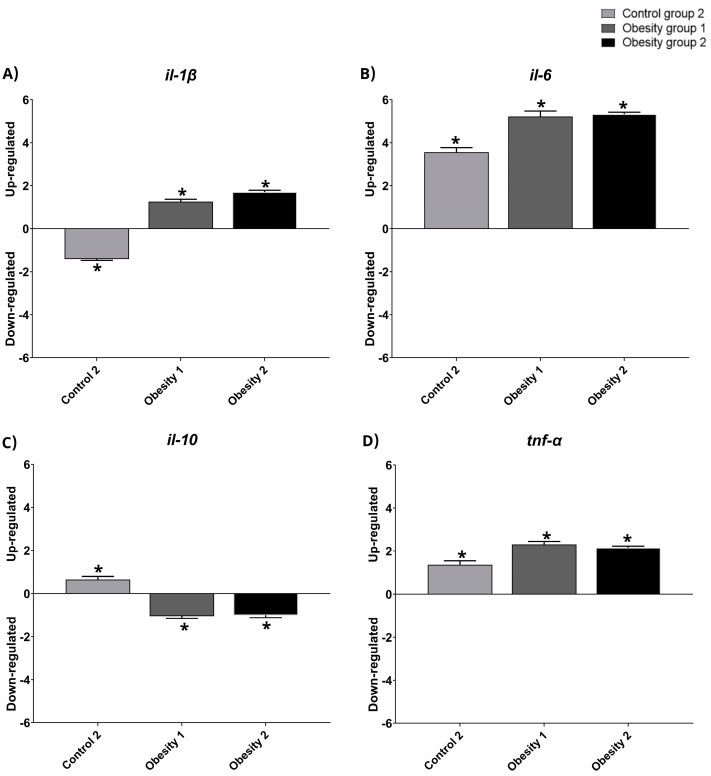
Methods: Adult animals of both sexes were divided into four groups (n = 50) and fed for eight weeks: control group 1: Artemia sp. (15-30 mg/day/fish); control group 2: commercial fish food (3.5% of average weight); obesity group 1: pasteurized egg yolk powder + soybean oil (5% of average weight); obesity group 2: Artemia sp. (60-120 mg/day/fish). Dietary intake, caloric intake and efficiency, body mass index, biochemical, inflammatory, behavioral, histopathological, and stereological parameters, and inflammation-related gene expression were investigated.

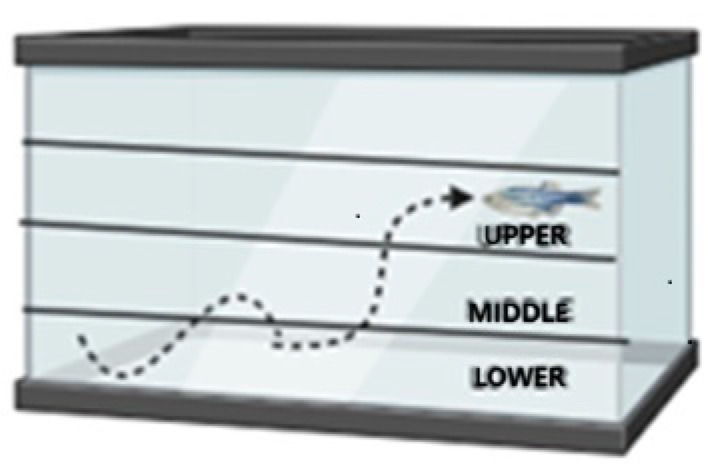
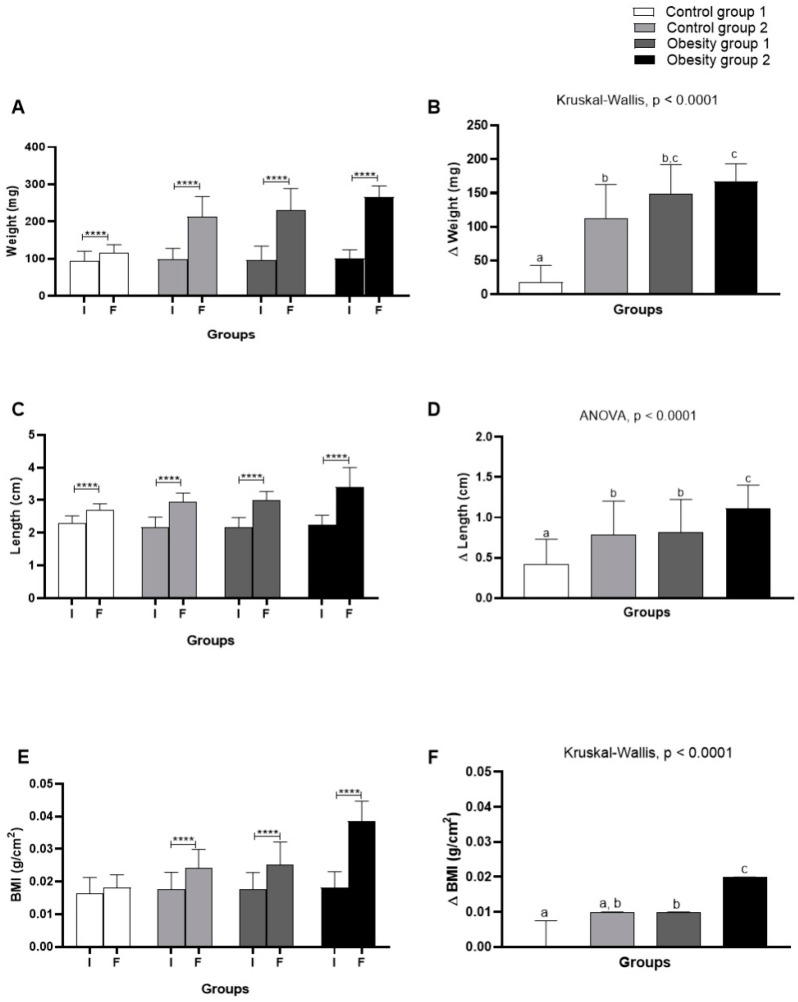
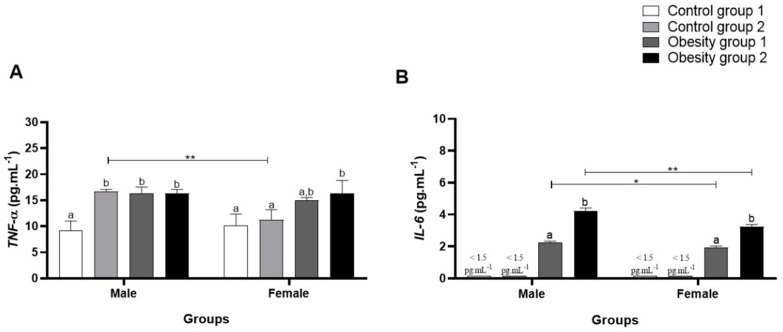
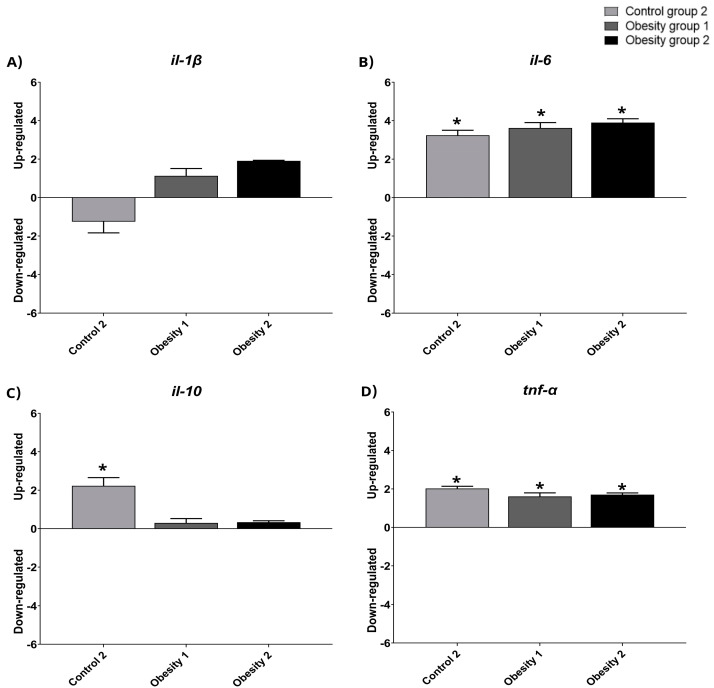
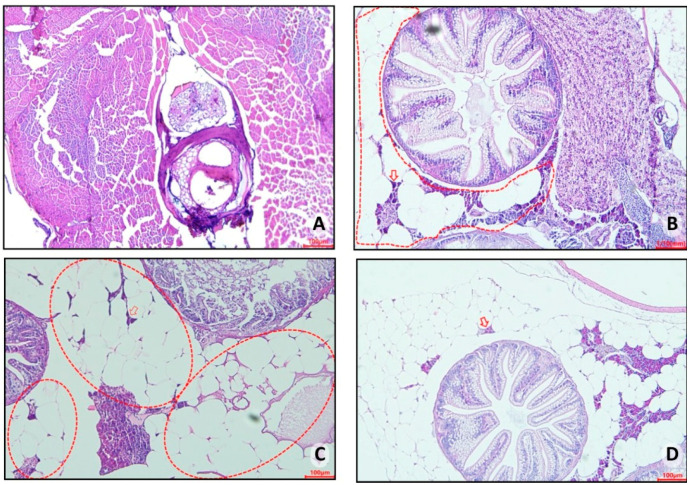
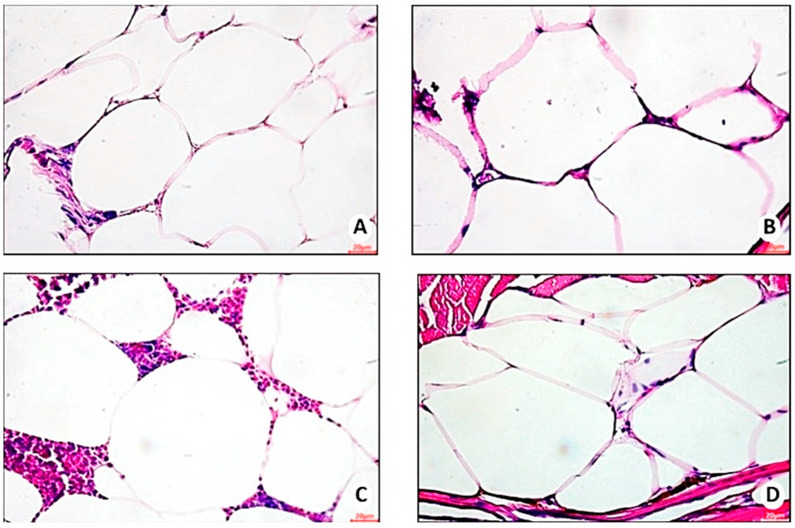
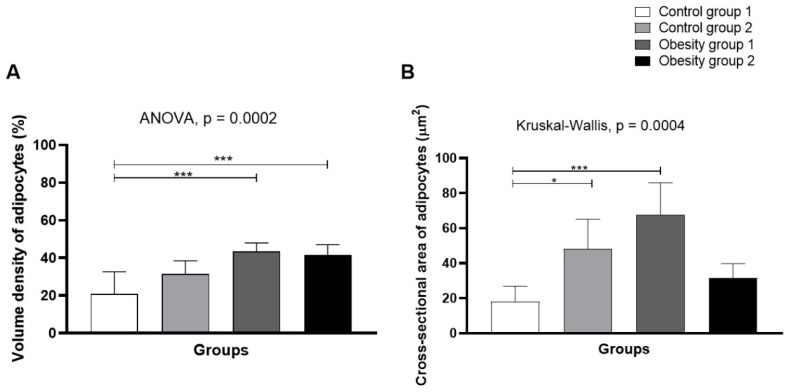
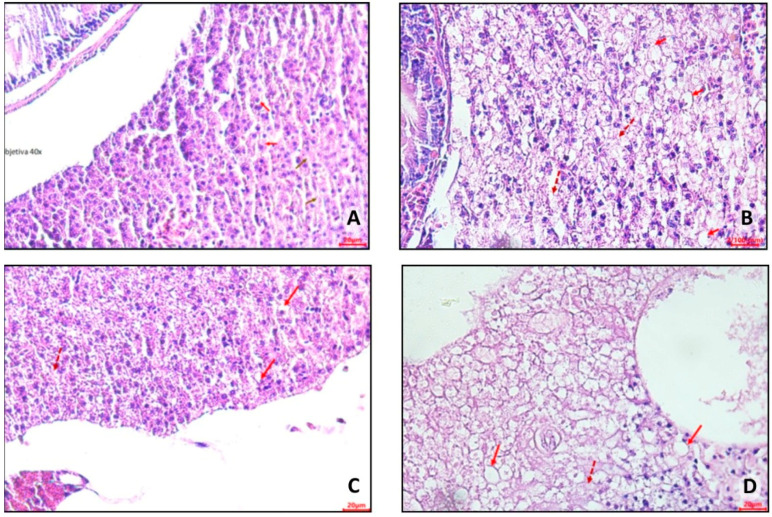
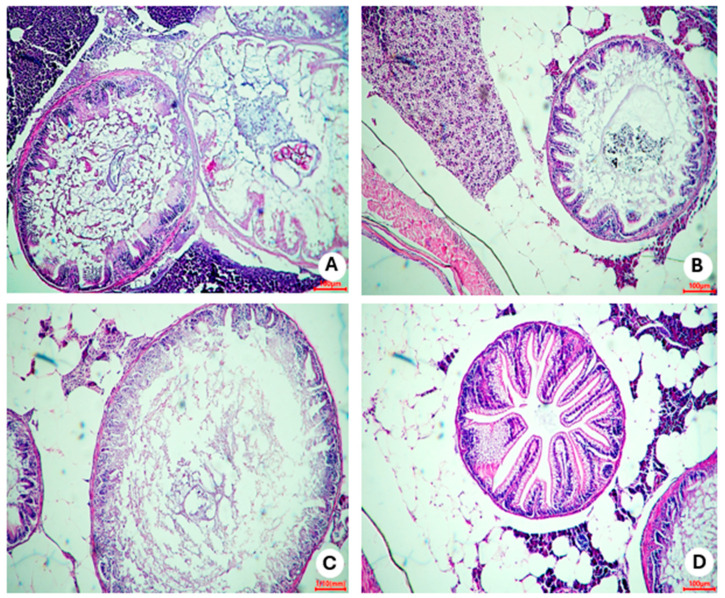
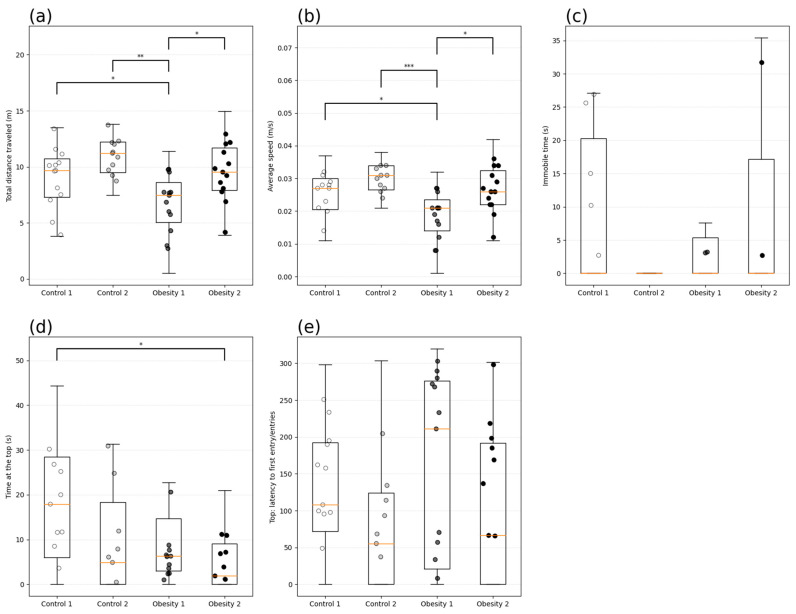
Results: Obesity group 1 was the most indicated to investigate changes in the anxious behavioral profile (p < 0.05), triglyceride elevation [52.67 (1.2) mg/dL], adipocyte hypertrophy [67.8 (18.1) µm2; p = 0.0004], and intestinal inflammation. Obesity group 2 was interesting to investigate in terms of weight gain [167 mg; p < 0.0001), changes in fasting glucose [48.33 (4.14) mg/dL; p = 0.003), and inflammatory parameters [IL-6: 4.24 (0.18) pg/mL; p = 0.0015].

Conclusions: Furthermore, both DIO models evaluated in the present study were effective in investigating hepatic steatosis. The data also highlighted that sex influences inflammatory changes and fasting blood glucose levels, which were higher in males (p > 0.05). The results show new metabolic routes to be explored in relation to DIO in zebrafish.

Keywords: anxiety; high-fat diet; inflammation; weight gain.


Conflict of interest statement

The authors declare no conflicts of interest.

Figures

Figure 1
Figure 1
Design of the eight-week diet-induced obesity experiment. (A) time scale in weeks. (B) division of zebrafish into groups. Control group 1: fed with Artemia sp.; control group 2: fed with commercial fish food; obesity group 1: overfed with egg yolk added with soybean oil; and obesity group 2: overfed with Artemia sp.
Figure 2
Figure 2
Distribution of the number of animals according to the type of analysis. All 50 animals per group were analyzed for food intake, energy intake, and zoometric analyses, and 15 were used for behavioral analysis. After euthanasia, 18 animals were used for biochemical analyses (nine males and nine females), 22 for morphological studies, and 10 for gene expression (five males and five females).
Figure 3
Figure 3
Schematic representation demonstrating the tank divisions. New tank experiment. The tank was divided into three horizontal areas of the same proportion (lower, middle, and upper).
Figure 4
Figure 4
Comparison of initial (I) and final (F) assessment and variation (Δ) of body weight, length, and body mass index (BMI) of adult zebrafish (three months) with diet-induced obesity (DIO) for eight weeks. (A) Weight; (B) weight variation; (C) length; (D) length variation; (E) BMI; (F) BMI variation. Values are expressed as mean (standard deviation). n = 50 adult animals per group. Letters a, b, and c represent statistical differences in the comparison between groups. Equal letters indicate no significant difference between the groups evaluated for each parameter (Asterisks: **** p = 0.0001). Control group 1: fed with Artemia sp. (first month: 15 mg/day/fish and in the second month 30 mg/day/fish); control group 2: fed with commercial food (3.5% of the group’s average weight); obesity group 1: overfed with powdered egg yolk mixed with soybean oil (2.5:1 w/w)—5% of average body weight; obesity group 2—overfed with Artemia sp. in the first month (60 mg/day/fish) and in the second month (120 mg/day/fish). BMI: body mass index.
Figure 5
Figure 5
Visual comparison of zebrafish with DIO. (A) Control group 1: fed with Artemia sp. (first month: 15 mg/day/fish and in the second month 30 mg/day/fish); (B) Obesity group 1: overfed with powdered egg yolk mixed with soybean oil (2.5:1 w/w); (C) Control group 2: fed with commercial food (3.5% of the group’s average weight); (D) Obesity group 2—overfed with Artemia sp. in the first month (60 mg/day/fish) and in the second month (120 mg/day/fish).
Figure 6
Figure 6
Concentrations of biochemical parameters of adult male and female zebrafish (three months) with diet-induced obesity (DIO) for eight weeks. Values are expressed as mean (standard deviation). n = 50 adult animals per group. Letters a, b and c represent statistical differences in the comparison between groups. Equal letters indicate no significant difference between the groups evaluated for each parameter. Asterisks: * p < 0.05; ** p < 0.001. Control group 1: fed with Artemia sp. (first month: 15 mg/day/fish and in the second month 30 mg/day/fish); control group 2: fed with commercial food (3.5% of the group’s average weight); obesity group 1: overfed with powdered egg yolk mixed with soybean oil (2.5:1 w/w)—5% of average body weight; obesity group 2—overfed with Artemia sp. in the first month (60 mg/day/fish) and in the second month (120 mg/day/fish). (A): results of Fasting glucose; (B): results of insulin; (C): results of triglycerides; (D): results of total cholesterol.
Figure 7
Figure 7
Plasma concentrations of inflammatory parameters of adults male and female zebrafish (three months) with diet-induced obesity (DIO) for eight weeks. Values are expressed as mean (standard deviation), n = 9 adult animals per group and sex. Letters a and b represent statistical differences in the comparison between groups. Equal letters indicate no significant difference between the groups evaluated for each parameter (Asterisks: * p < 0.05; ** p < 0.01). Control group 1: fed with Artemia sp. (first month: 15 mg/day/fish and in the second month 30 mg/day/fish); control group 2: fed with commercial food (3.5% of the group’s average weight); obesity group 1: overfed with powdered egg yolk mixed with soybean oil (2.5:1 w/w)—5% of average body weight; obesity group 2—overfed with Artemia sp. in the first month (60 mg/day/fish) and in the second month (120 mg/day/fish). (A): results of TNF-α: tumor necrosis factor alpha; (B): results of IL-6: interleukin-6.
Figure 8
Figure 8
Relative gene expression values of inflammatory markers in visceral adipose tissue in adult male zebrafish (three months) with diet-induced obesity (DIO) for eight weeks. Qualitative data and normalization with control group 1. Control group 2: fed with commercial food (3.5% of the group’s average weight); obesity group 1: overfed with powdered egg yolk mixed with soybean oil (2.5:1 w/w)—5% of average body weight; obesity group 2—overfed with Artemia sp. in the first month (60 mg/day/fish) and in the second month (120 mg/day/fish). Asterisks indicate significant statistical differences. (A): il-1 β: interleukin 1 beta; (B): il-6: interleukin 6; (C): il-10: interleukin 10; (D): tnf-α: tumor necrosis factor alpha. Down-regulated: low gene expression. Up-regulated: high gene expression.
Figure 9
Figure 9
Relative gene expression values of inflammatory markers in visceral adipose tissue in adult female zebrafish (three months) with diet-induced obesity (DIO) for eight weeks. Qualitative data and normalization with control group 1. Control group 2: fed with commercial food (3.5% of the group’s average weight); obesity group 1: overfed with powdered egg yolk mixed with soybean oil (2.5:1 w/w)—5% of average body weight; obesity group 2—overfed with Artemia sp. in the first month (60 mg/day/fish) and in the second month (120 mg/day/fish). Asterisks indicate significant statistical differences. (A): il-1 β: interleukin 1 beta; (B): il-6: interleukin 6; (C): il-10: interleukin 10; (D): tnf-α: tumor necrosis factor alpha. Down-regulated: low gene expression. Up-regulated: high gene expression.
Figure 10
Figure 10
Representative photomicrograph, at 10× using a 100 µm objective, of visceral adipose tissue from adult zebrafish (three months) with diet-induced obesity (DIO) for eight weeks. In control group 2, an accumulation of unilocular adipocytes was observed involving organs located in the abdominal cavity (dashed circle) with the presence of macrophages (red arrow) (B). The fish in obesity group 1 showed an extensive area of unilocular adipose tissue distributed in the abdominal cavity (red outline), in addition to a crown of macrophages surrounding the adipocytes (red arrow) (C). Zebrafish from obesity group 2 presented the highest number of unilocular adipocytes surrounded by macrophages (red arrow). (A) Control group 1: fed with Artemia sp. (first month: 15 mg/day/fish and in the second month 30 mg/day/fish); (B) control group 2: fed with commercial food (3.5% of the group’s average weight); (C) obesity group 1: overfed with powdered egg yolk mixed with soybean oil (2.5:1 w/w)—5% of average body weight; (D) obesity group 2—overfed with Artemia sp. in the first month (60 mg/day/fish) and in the second month (120 mg/day/fish).
Figure 11
Figure 11
Representative photomicrograph, at 40× using a 20 µm objective, of hypertrophied adipocytes in visceral adipose tissue of zebrafish with diet-induced obesity (DIO) for eight weeks (n = 10 per group). (A) Control group 1: fed with Artemia sp. (first month: 15 mg/day/fish and in the second month 30 mg/day/fish); (B) control group 2: fed with commercial food (3.5% of the group’s average weight); (C) obesity group 1: overfed with powdered egg yolk mixed with soybean oil (2.5:1 w/w)—5% of average body weight; (D) obesity group 2—overfed with Artemia sp. in the first month (60 mg/day/fish) and in the second month (120 mg/day/fish).
Figure 12
Figure 12
Volume density (A) and mean cross-sectional area of adipocytes (B) from visceral adipose tissue of zebrafish adults (three months) with diet-induced obesity (DIO) for eight weeks. Control group 1: fed with Artemia sp. (first month: 15 mg/day/fish and in the second month 30 mg/day/fish); control group 2: fed with commercial food (3.5% of the group’s average weight); obesity group 1: overfed with powdered egg yolk mixed with soybean oil (2.5:1 w/w)—5% of average body weight; obesity group 2—overfed with Artemia sp. in the first month (60 mg/day/fish) and in the second month (120 mg/day/fish). Asterisks: * p < 0.05; *** p < 0.0001.
Figure 13
Figure 13
Representative photomicrographs, at 40× using a 20 µm (A,C,D) and 100 µm (B) objective, of hepatocytes from adult zebrafish (three months) with diet-induced obesity (DIO) for eight weeks. (A) Control group 1: fed with Artemia sp. (first month: 15 mg/day/fish and in the second month 30 mg/day/fish); (B) control group 2: fed with commercial food (3.5% of the group’s average weight); (C) obesity group 1: overfed with powdered egg yolk mixed with soybean oil (2.5:1 w/w)—5% of average body weight; (D) obesity group 2—overfed with Artemia sp. in the first month (60 mg/day/fish) and in the second month (120 mg/day/fish). The red arrows indicate hepatocytes with a large amount of lipid deposits in the cytoplasmic location, and the dashed hepatocytes have areas of necrosis and the absence of nuclei.
Figure 14
Figure 14
Representative photomicrographs, at 10× using a 100 µm objective, of areas of the intestine of zebrafish adults (three months) with diet-induced obesity (DIO) for eight weeks. (A) Control group 1: fed with Artemia sp. (first month: 15 mg/day/fish and in the second month 30 mg/day/fish); (B) control group 2: fed with commercial food (3.5% of the group’s average weight); (C) obesity group 1: overfed with powdered egg yolk mixed with soybean oil (2.5:1 w/w)—5% of average body weight; (D) obesity group 2—overfed with Artemia sp. in the first month (60 mg/day/fish) and in the second month (120 mg/day/fish).
Figure 15
Figure 15
Behavioral analysis of anxiety by the new tank test of adult male and female zebrafish (three months) with diet-induced obesity (DIO) for eight weeks. Data are expressed as medians (interquartile distance) analyzed using the Kruskal–Wallis test. Each circle represents an individual animal (n = 15). Control group 1: fed with Artemia sp. (first month: 15 mg/day/fish and in the second month 30 mg/day/fish); control group 2: fed with commercial food (3.5% of the group’s average weight); obesity group 1: overfed with powdered egg yolk mixed with soybean oil (2.5:1 w/w)—5% of average body weight; obesity group 2—overfed with Artemia sp. in the first month (60 mg/day/fish) and in the second month (120 mg/day/fish). Asterisks indicate significant statistical differences: * p < 0.05; ** p < 0.01; *** p < 0.0001. (a) Total distance traveled (m); (b): Average speed (m/s); (c) Immobile time (s); (d): Time at the top (s); (e) Top: latency to first entry.

References

    1. World Obesity Atlas. [(accessed on 2 February 2023)]. Available online: https://www.worldobesity.org/resources/resource-library/world-obesity-at....
    1. Pepe R.B., Lottenberg A.M.P., Fujiwara C.T., Beyruti M., Cintra D.E., Machado R.M., Rodrigues A., Jensen N.S., Caldas A., Fernandes A.E., et al. Posicionamento Sobre o Tratamento Nutricional do Sobrepeso e da Obesidade Departamento de Nutrição da Associação Brasileira para o Estudo da Obesidade e da Síndrome Metabólica—ABESO—2022. [(accessed on 2 February 2023)]. Available online: https://abeso.org.br/wp-content/uploads/2022/11/posicionamento_2022-alte....
    1. Queiroz L.J., Medeiros I., Rosa S., Coimbra M., Camillo C.S., Paulo P., Guerra G.C.B., da Silva V.C., Schroeder H.T., Krause M., et al. Efficacy of Carotenoid-Loaded Gelatin Nanoparticles in Reducing Plasma Cytokines and Adipocyte Hypertrophy in Wistar Rats. Int. J. Mol. Sci. 2023;24:10657–10667. doi: 10.3390/ijms241310657. - DOI - PMC - PubMed
    1. Silva F.P., Araújo D., Carnier M., Paloma K.M., Valter T.B., Rischiteli A.B.S., Avila F., Pontes L.P.P., Hachul A.C.L., Neto N.I.P., et al. Low dose of Juçara pulp (Euterpe edulis Mart.) minimizes the colon inflammatory milieu promoted by hypercaloric and hyperlipidic diet in mice. J. Funct. Foods. 2021;1:104343–104353. doi: 10.1016/j.jff.2020.104343. - DOI
    1. Laranjo L., Fortes N.C.L., Santiago H.C., Marcelo V.C., Maria A.G., Moura D. Obesity-induced diet leads to weight gain, systemic metabolic alterations, adipose tissue inflammation, hepatic steatosis, and oxidative stress in gerbils (Meriones unguiculatus) PeerJ. 2017;5:2967. doi: 10.7717/peerj.2967. - DOI - PMC - PubMed

Publication types

LinkOut - more resources